how to debug in vscode #611
Comments
|
Perhaps use this? https://code.visualstudio.com/blogs/2017/12/20/chrome-debugging |
|
I would also be interested in this, when using webpack with a launch.json similar to this: I have no problems hitting breakpoints in my typescript, but no matter what sourceMapPathOverrides I try with parcel I can't seem to get vscode to say anything other than Breakpoint ignored because generated code not found (source map problem?). |
|
Any ideas on this? |
|
Hello @Frank1e0927 & @dkapellusch, this is the {
"version": "0.2.0",
"configurations": [
{
"type": "node",
"request": "launch",
"name": "Debug App",
"program": "${workspaceFolder}/bin/cli.js",
"env": {
"PARCEL_WORKERS": "0" // Run workers in same thread for debugging
},
"args": [
"C:\\path\\to\\your\\app\\index.html" // Your entry point (e.g. parcel <entry>)
]
}
]
}
Replace the path in args to your entry point. If you'd like to debug the |
|
Just realized you may be trying to debut the output, not parcel itself. The above will debug the build process. |
|
Yeah my intention is to debug the output from Parcel in Chrome. I saw in the previous release notes that sourcemaps are now generated, and I can see them being created in my dist directory, and chrome sees them when I check the chrome dev tools. VsCode however does not seem to use them correctly with my current launch.json though. |
|
Bumping this thread again as I still haven't had any luck finding / discovering this answer on my own. |
|
@dkapellusch I finally got it working after what seemed like hours of banging my head against the wall. Keep me updated on your progress!
|
|
I got it working by using almost the same solution as @anderskleve, except my sourceMapPathOverrides is a little different. // ... other config
"sourceMapPathOverrides": {
"../*": "${webRoot}/*"
}I did it like this because my project is directly on the root. Not in some folder inside the workspaceFolder. |
|
#1078 should help with the issue too so that you don't need to override with "sourceMapPathOverrides" My config works with: |
|
I'm trying to solve this problem here: https://github.com/mohsen1/parcel-react-typescript-vscode it's not working at the moment but I really want to get it working as an example that works end-to-end. Feel free to fiddle with it until its working and let others know how it should be done! By not working I mean the source maps are not working right. in VSCode console you have to access |
|
I'm having the same problem with a game that uses parcel, phaser and typescript, I'm no expert so if anyone could help me I would really appreciate it. I put the code on this repository: []https://github.com/polferrando98/Phaser-ts-yarn-parcel-template Thanks in advance! |
|
I can't get it to work on firefox. The firefox adapter doesn't have a |
|
Oh nvm It seems to have fixed itself when i created a new project. Strange... |
|
The settings here worked for me |
|
Hot module reloading seems to break when using chrome |
|
This is how I debug when running my app in a Docker container from VS code. |
|
I used a similar approach to @anderskleve, but had to add
|
|
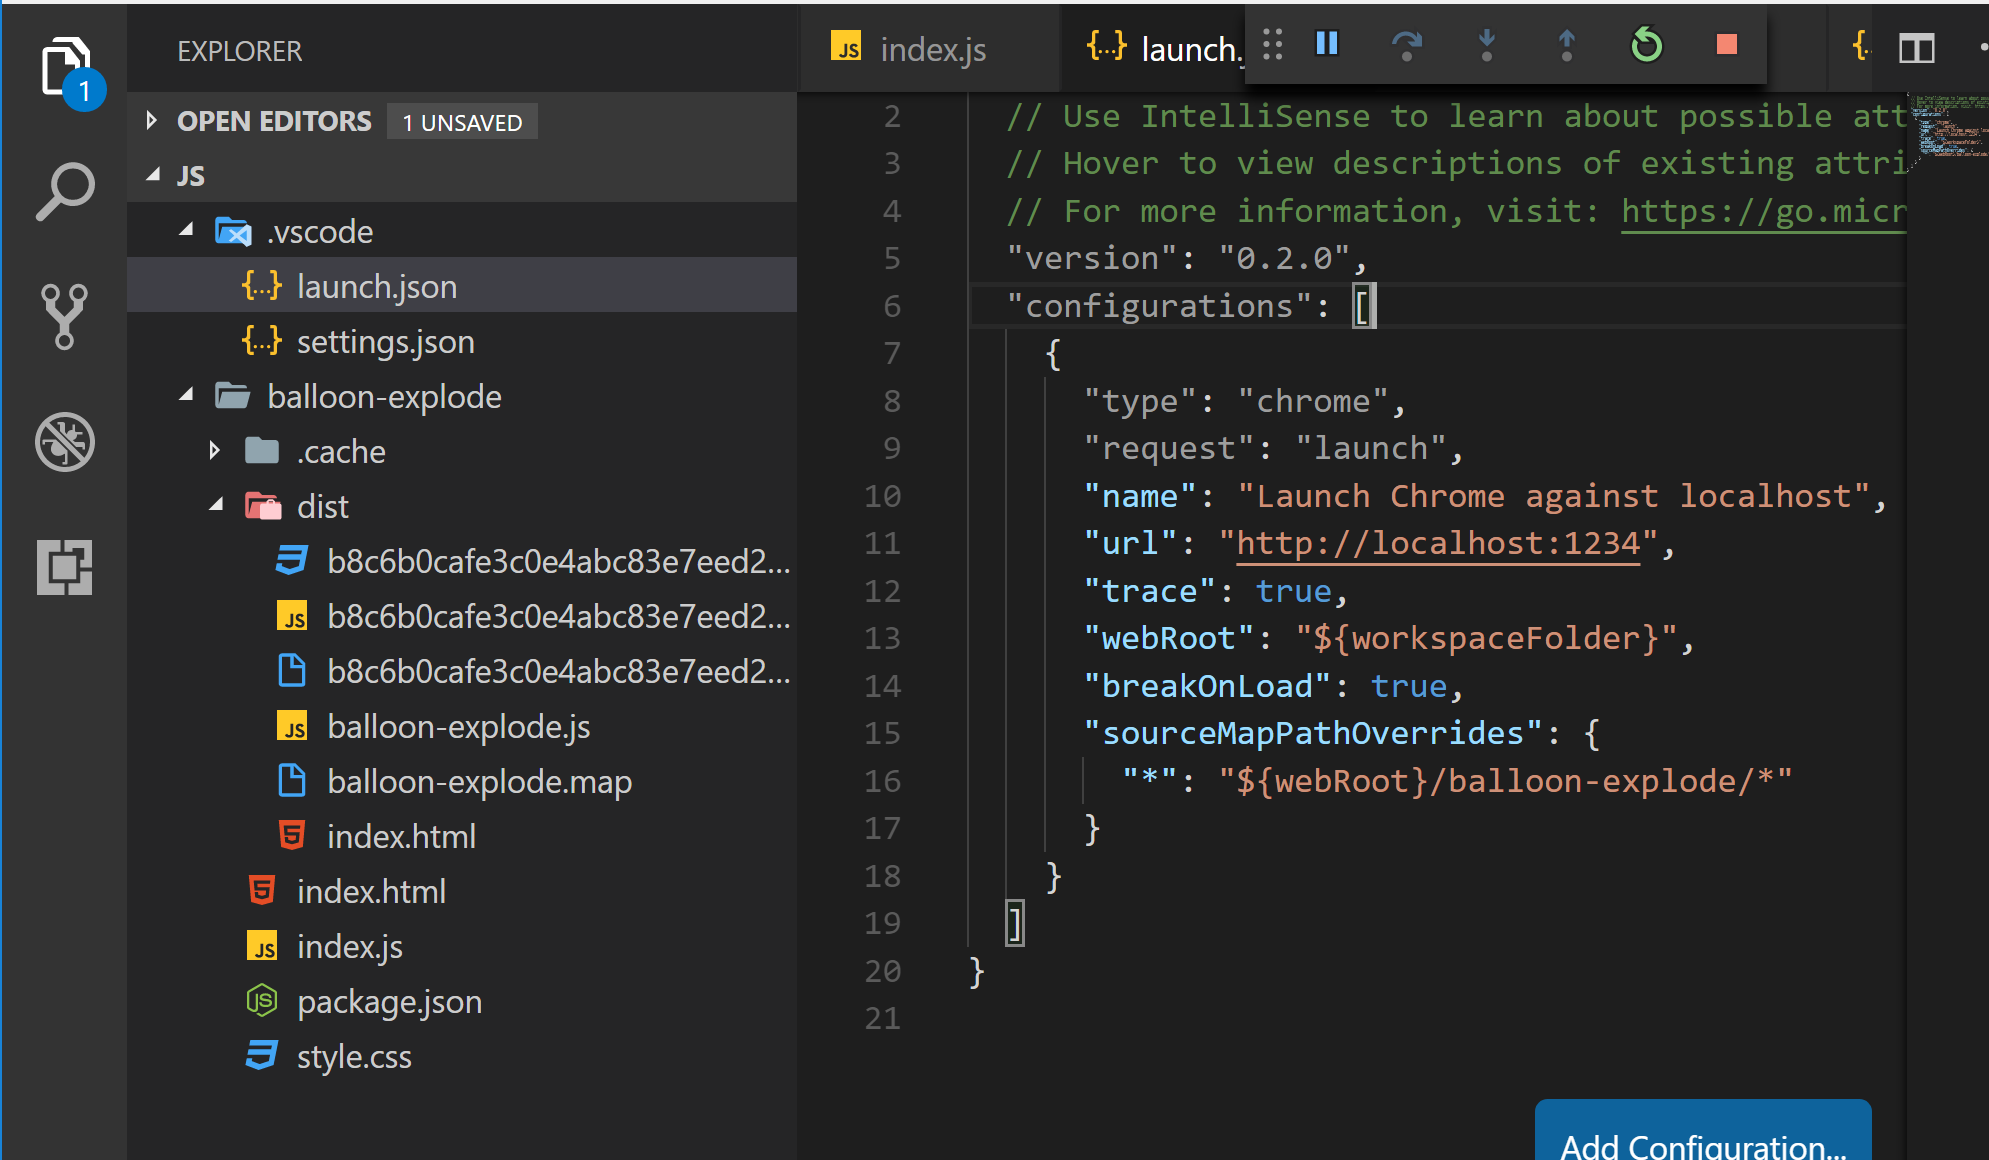
For those who want a real quick copy-paste, in general, it's: {
// Use IntelliSense to learn about possible attributes.
// Hover to view descriptions of existing attributes.
// For more information, visit: https://go.microsoft.com/fwlink/?linkid=830387
"version": "0.2.0",
"configurations": [
{
"type": "chrome",
"request": "launch",
"name": "Launch Chrome against localhost",
"url": "http://localhost:1234",
"trace": true,
"webRoot": "${workspaceFolder}",
"breakOnLoad": true,
"sourceMapPathOverrides": {
"../*": "${webRoot}/*"
}
}
]
} |
|
This took me good long time to figure out! @SwiftWinds response got me the closest out of all my internet research. The other thing that helped me finally understand was this section about configuring for ionic and gulp. For me, parcel was outputting a sourceRoot of "__parcel_source_root." Thus, to get everything working, I needed sourceMapPathOverrides to look like this:
|
This depends on the config from parcel-bundler/parcel#611 for source mapping.
|
Pulling my hairs out over this for about 3 days now. Is this solution with old Chrome Debugger Extension in VS Code even possible now that new built-in debugging is introduced? Tried that too with no luck. Anyways, accessing project through Remote SSH and went through Get Started section of Parceljs.org, code runs, but breakpoints are ignored. When I type .scripts in debugging console, lots of lines like this are displayed: I guess __parcel_source_root needs to be replace with /home/pyc, but how? |
|
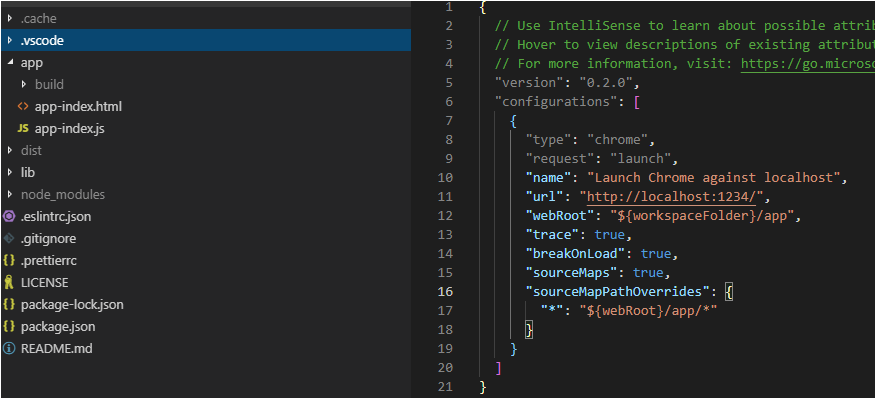
I have stumbled upon the same problem and the following seems to cover all the basics.
I've checked that with Parcel 2 and it worked like a charm. |
|
None of the above worked for me. So just to clarify, after I add the above |
how to debug in vscode with parcel react app?
anybody can give an easy example config for me ? or give a /.vscode/launch.json ?
The text was updated successfully, but these errors were encountered: