

This project is about representing a landscape as a 3D object in which all surfaces are outlined in lines
To be honest, this project FDF was a huge challenge in my journey. Creating an abstract perspective from matrix conversions was my biggest and toughest goal. To give you a better knowledge about the FDF project, I will give a short and pragmatic introduction to how it works.
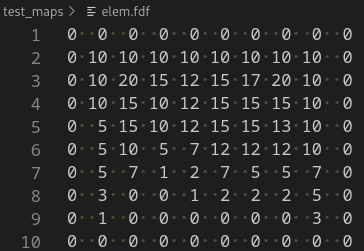
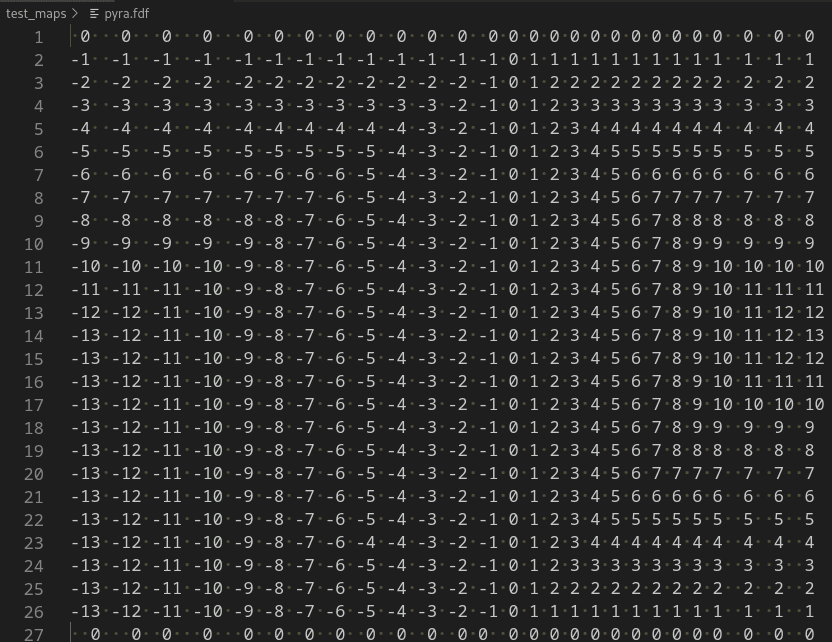
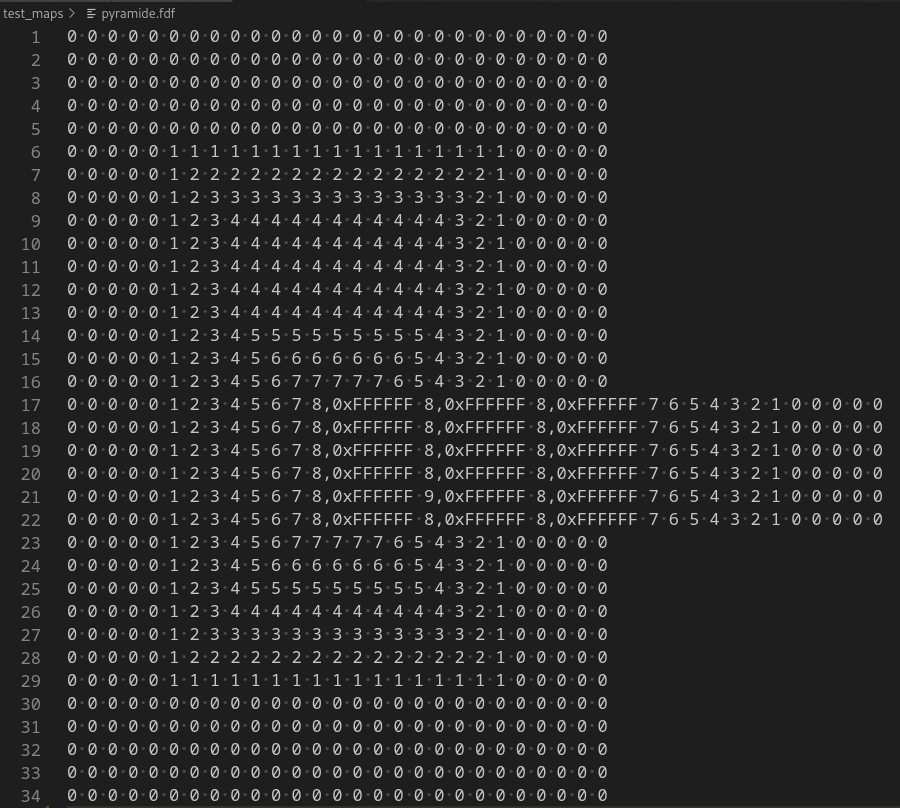
The journey of the FDF Chronicles: 2D Projections is to create a program that will receive a simple map in a file format .fdf. We presume this file contains the coordinates of a landscape which will be displayed in our output. So, in this image, you will understand a little bit of what kind of files we are expecting:
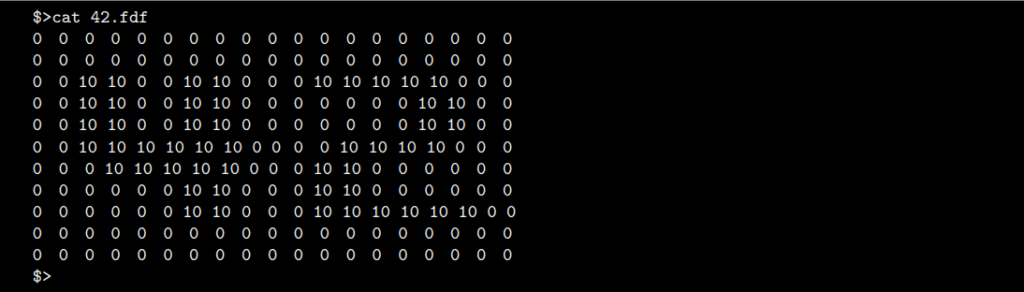
Each number from the file has 3 representations:
- The horizontal position corresponds to its axis;
- The vertical position corresponds to its ordinate;
- The value itself corresponds to the altitude.
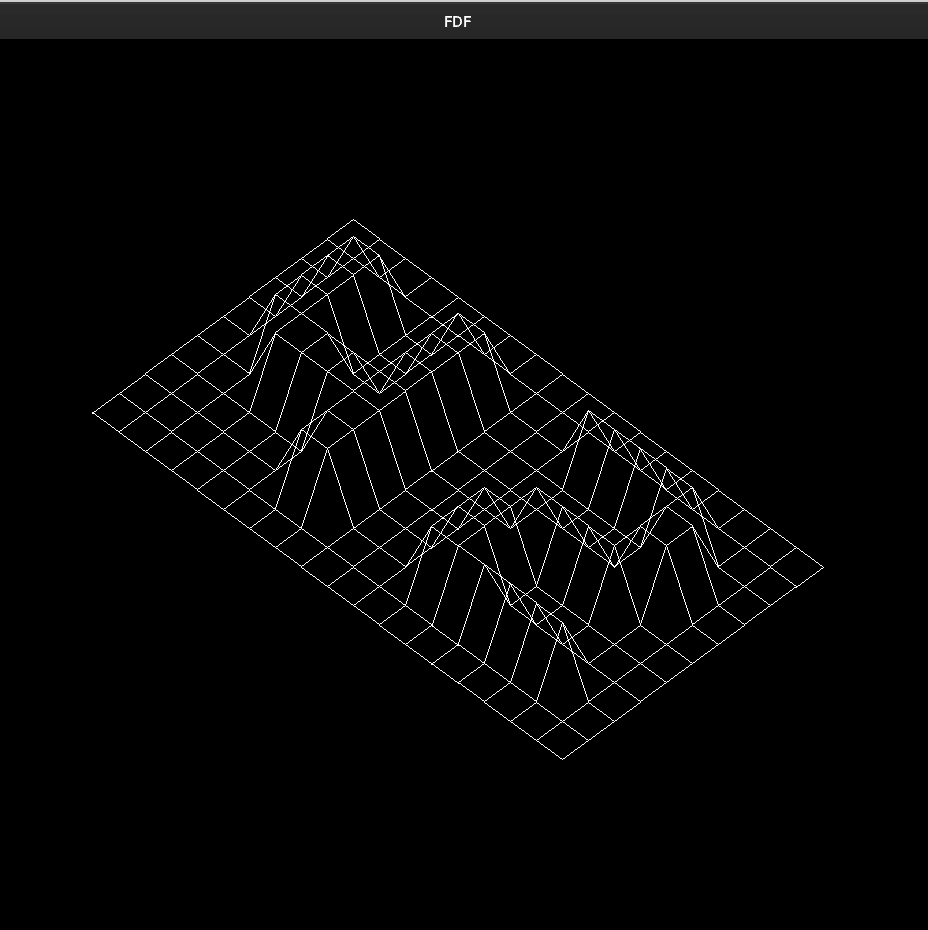
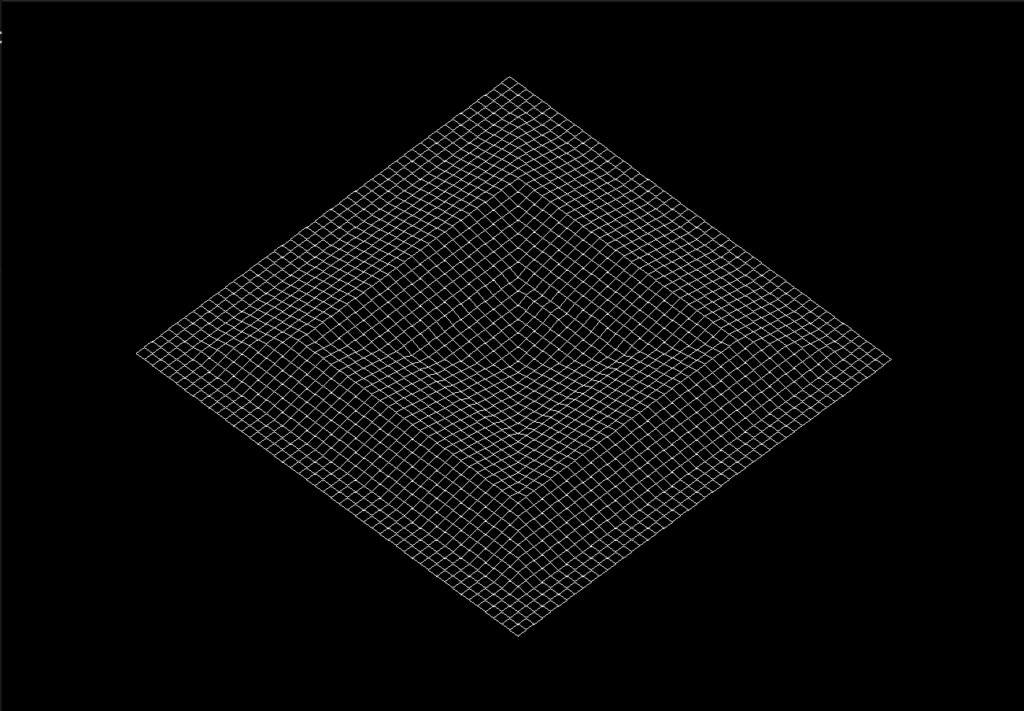
It could look a little bit nonsense and confusing right now. So, I will show the expected output from this same file and you will try to get it:
If you are looking for some code to help your development you can check my GitHub by clicking.
Disclaimer: This article "FDF Chronicles: 2D Projections" represents my perspective about my understanding of the scope of this project, and it might contain incorrect information. If you found any mistakes, I would be grateful if you sent them to me to make corrections.
Summary:
- What is an isometric projection?
- Think about your data structure very well!
- How drawing lines between coordinates?
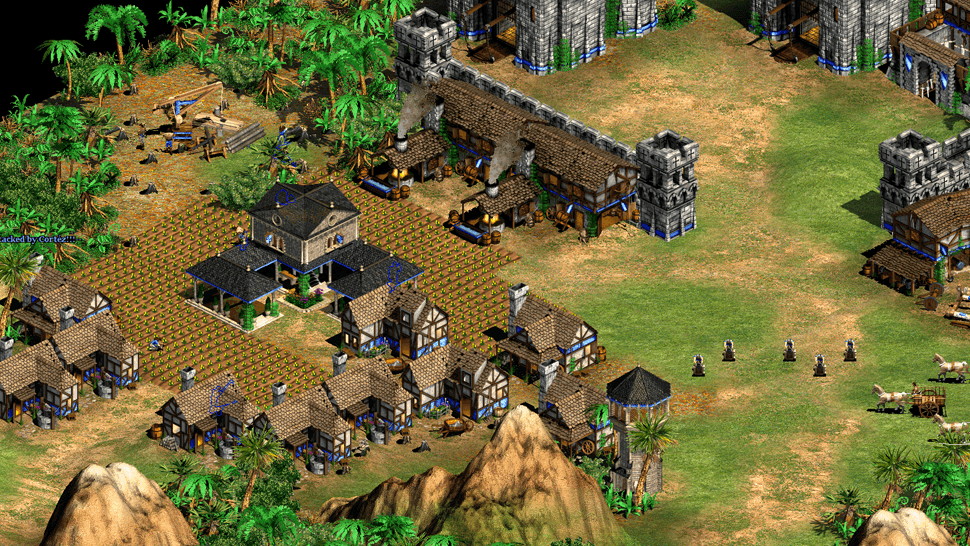
As I am a game lover, this is the best way to visualize the power of isometric views. Somehow, we created the idea that this is a 3D representation. But it is not! Each object works in the same abstract way as our maps from the FDF project.
At the time of development, 3D graphical representations demanded a lot of GPU resources, which were not too much available at that time (we are talking about 2000s).
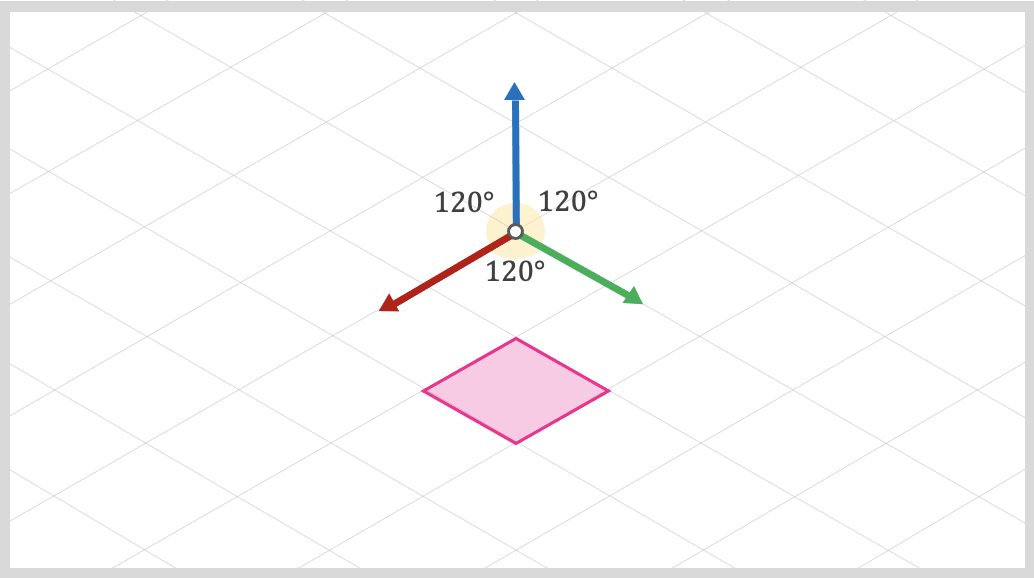
To create a short description, isometric projections use angles between the x-axis, y-axis, and z-axis equal to 120 degrees. To do this, we need to convert our matrix using formulas that will apply this perspective.
Right now, as I finished the project, I can create the best data structure from my perspective. But, at the beginning of this project, I didn´t have to understand and used structures and lists.
So, my tools were a little bit scarce and this is good because I spent a long time thinking about how I could manage my data in the best approach. And right now I can see it very clearly. So, if you also don´t have a deep comprehension of this topic, this is a great opportunity to create this idea. It will demand more time, but it is a good investment.
In my case, I first collected all information in a linked list with a structure containing x, y, and z values. To collect all coordinates from the file, use split and get next-line functions. Then, used two conversion functions to convert the matrix using my linked list and applying isometric conversions, and scales, using width and height dimensions from the map.
If you are looking for some code to help your development you can check my GitHub by clicking.
Drawing lines is a good challenge in the FDF project. After we had all the positions in our matrix, we had to "connect" all points from our map. In my case, I used Bresenham's line algorithm.
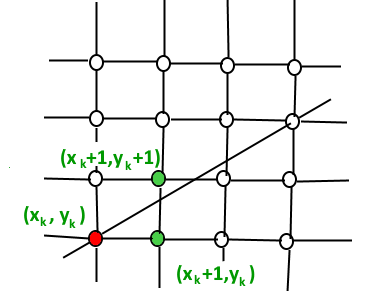
To draw lines, we need to draw all pixels between the initial coordinate to the final coordinate, using a while loop that increments and prints each pixel between these points. In FDF, our logic needs to do this from position x -> x+ 1, and x -> width for almost all map coordinates from our matrices.
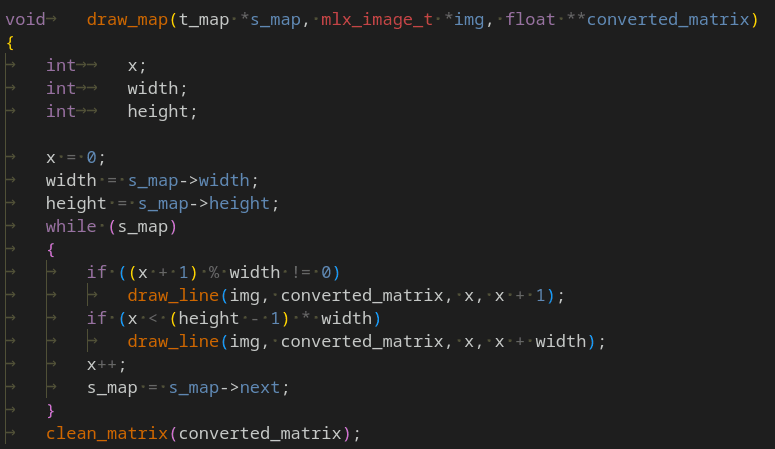
I was only concerned with this step when I had all my data correctly stored. It is also good to validate if the pixels are within the window height and width to avoid segmentation faults in your program.
Elem.fdf:
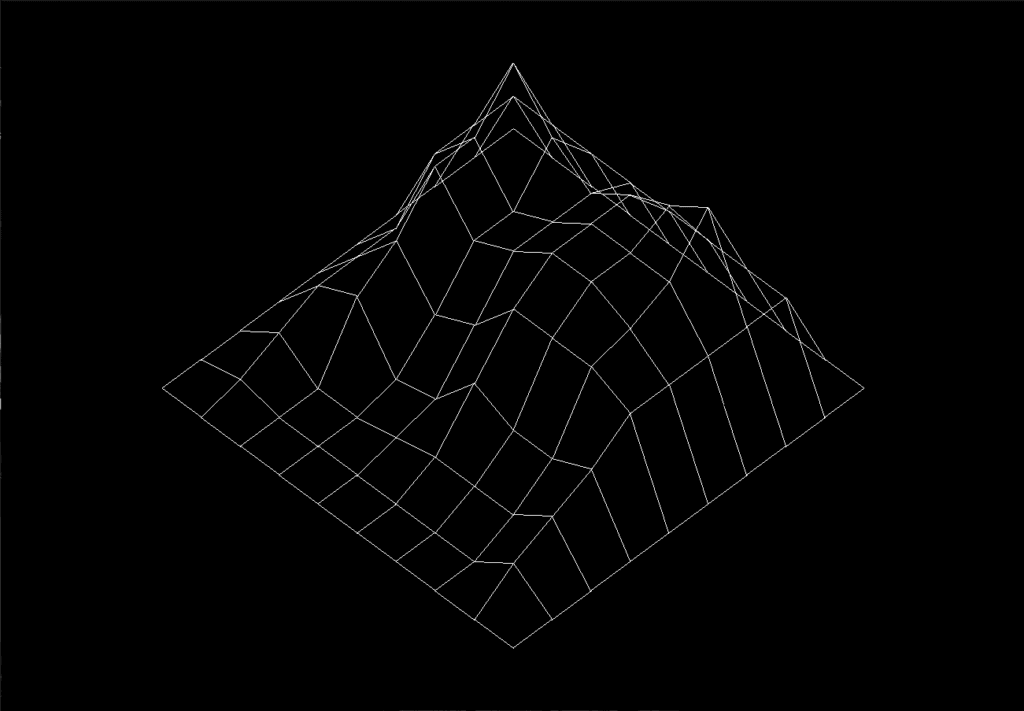
Pyra.fdf:
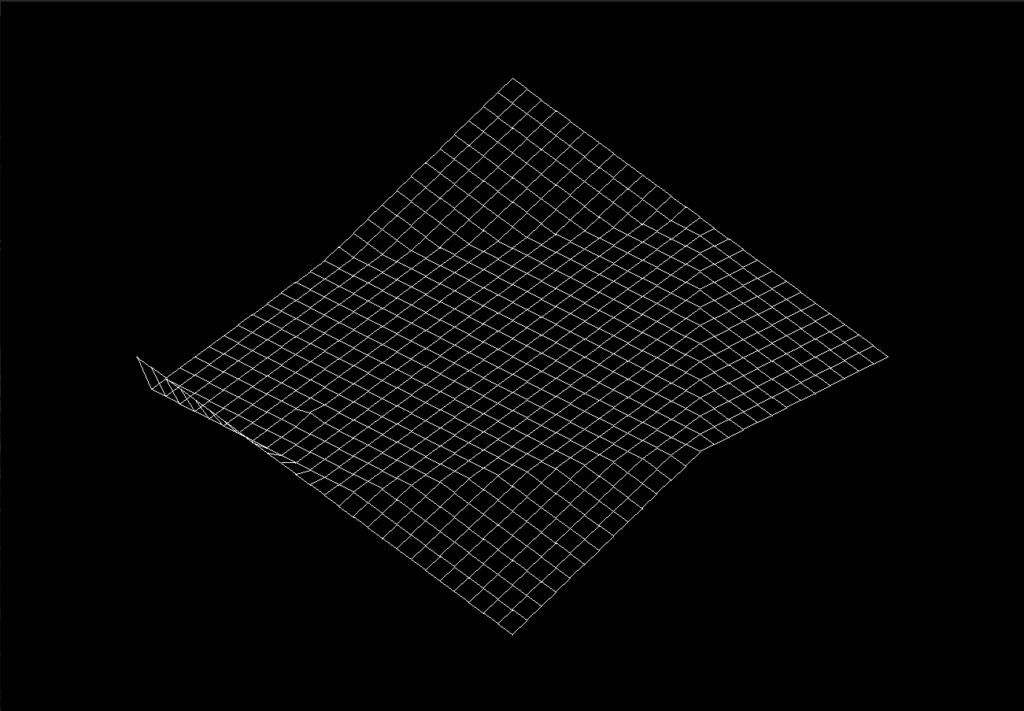
Pyramid.fdf:
If you want a deeper understanding of this project's topics, I recommend these links that can help you in your journey. Thank you for reading FDF Chronicles: 2D Projections
- My GitHub repository.
- 42 São Paulo Student repository
- Line drawing algorithm
- Another line-drawing algorithm
- MLX 42 Codam graphics library
Hope you enjoy it! I would love to talk about this project or other subjects. Feel free to reach me! Happy 2024!
"If you wish to improve, be content to appear clueless or stupid in extraneous matters—don't wish to seem knowledgeable. And if some regard you as important, distrust yourself."
- Enchiridion - Epictetus