Clients over time popover gets cut off #603
Comments
|
Same thing happens with the "Forward Destinations over Time" when you have multiple DNS servers. |
|
In raising this issue, I confirm the following:
How familiar are you with the the source code relevant to this issue?:
Expected behaviour: Tooltips should render outside of the canvas Actual behaviour: Tooltips only render within the canvas. Steps to reproduce: Mouseover a chart, and look at it. Troubleshooting undertaken, and/or other relevant information: A possible fix is to use External (Custom) Tooltip Some discussion on it here : chartjs/Chart.js#622 If I can get some time, I'll take a look into it. |
|
This article on Discourse is suggesting to increase the height of the graphs notable to mitigate this issue, what do you think @pi-hole/admin ? |
|
I mean, yeah, that's one way of doing it, but I think it would be nicer to go down the custom tooltip path. That said, I've had no time to work on that myself lately! |
|
With enough clients, it will still be an issue with that workaround. |
|
It helps, but you get repeating similar colours too (which is probably another issue, sorry).
We need fewer devices in the home but I doubt that's the trend :) |

|
Could the position of the legend be made static on the RHS of the chart, but the data fed from where the mouse is in terms of updating the legend? |
|
I haven't check that case, but it would depend on if the library supports it. I would guess not because it renders everything in a canvas |
|
Couple of thoughts:
On the 'Clients (over time)' chart, removing those clients with no data would help as well. An alternative approach could be to make the title of the chart clickable, taking the user to the chart on a single page, the chart could be much bigger (with more canvas space below the axis which might help. Could something like this be done? http://hoboman313.github.io/chartsjs-demo/ This http://www.flotcharts.org/flot/examples/tracking/index.html is quite a neat solution with a fixed legend though it uses flot and I have not been able to find a chartjs solution to match it. |
|
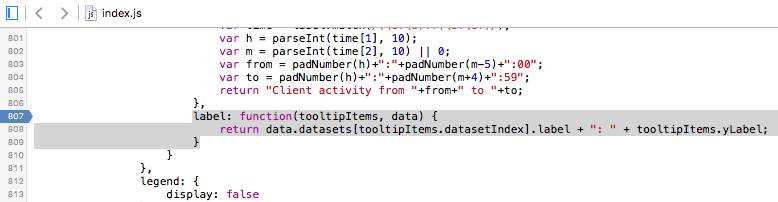
@excyruss Without having too much knowledge of the code, I’d assume it’s that code responsible: Filtering „if (tooltipItems.yLabel != 0)“ would do the job, or am I wrong? |
|
@maciboy Easy enough for anyone to update on their own. |
|
This is how to get a customtooltip that renders outside of the clients over time graph. I didn't apply it to the queries over time graph. Also, if you implemented the stripping out of 0 count clients above I would suggest undoing that as you will end up with blank lines with this new code. I am going to enjoy the rest of my Saturday rather than fiddling with that right now... The below is pretty much a hack of me googling and researching but it works. Not as pretty as it doesn't have the triangle fly away on the tooltip but it works. I am sure there is some process to officially submit it on github but I don't know if I am going to work on this anymore since I got it to do what I wanted. So do what you will with it. |
|
Would love to see some kind of adoption of @kh0505 modification! Maybe you can share a screenshot, of how your custom tooltip looks in usage? |
|
|

|
Good stuff @kh0505! I think this is one of those things we've just been putting off and off! You're free to submit a pull request against the repository ( |
|
I managed to edit both files the way @kh0505 explained, for those of you wanting to test it: |
|
Thank you so much @kh0505 , hope this gets added in the next update. honestly, they should put this in now, right away. but of course some possible breaks may endure and if any security risk but I doubt it. |
|
We'll add it in, just giving @kh0505 a grace period should he wish to submit it himself. However, we will now add it in and credit him in the commit message |
|
The issue can be mitigated by applying by hand the changes to the 2 files (plain text) indicated in the above posts. This is a low priority item that the DEV team will get to one day, for now doing it for yourself will be the only option if you really need something. Also if you make the changes, you can give feedback to assist with its improvement. |
|
It's in progress: |
|
was working for a while until last week or so, it reverted back to half screen unseeable address's. |
|
@91ajames if you have done an Update (pihole -up) or Reconfigure/Repair (pihole -r) of Pihole in the last week or so, this will overwrite (restore to release default) any manual changes that where made by hand. |
|
The PR has been merged into development |
|
Sorry for the stupid question but how do I modify these files to implement this fix myself? I stopped lighttpd but the files are still not writable and even if I force a write and then restart lighttpd or the entire pi, the changes don't actually get reflected in the admin page once it starts up again. How do I modify the files in /var/www/html/admin/ ? |
|
I would not suggest modifying the files yourself. They are writable if you use |
|
Well that's the thing, I transferred the modified files and I modified these two files to kh0505's instruction: /var/www/html/admin/scripts/pi-hole/js/index.js |
|
Sounds like a bad SDCard. Try touching a file in the home directory, rebooting and see if that file still exists after the reboot. |
|
touch test is fine, I also Everything else about the pi and pihole has been amazing, I just turned it into the DHCP server though and that grew my client list to the correct amount of clients I have around which is way too many for the small graph. Even just putting in the 0 requests check helps a lot, and I can modify that from chrome tools but it would be nice to be a persistent change |
|
So |
|
How about |
|
Correct, cat on the two index files shows the changes at all times after multiple reboots, I look at the source displayed in my browser and it's the original unmodified code that I wanted changed.
The other command looks like a good ol config file but messes up markdown so I won't insert that. The parts that specify directories and files are: server.document-root = "/var/www/html" |
|
It's |
|
Also, may not make a difference but have you |
|
oh no... 🤦 hard refresh works... thanks for your help! |
|
So this should have been in the next release, according to the label, but i have just updated to v4.0 but the graph error is still there :( Is it correct that the fix has not been released, or am i missing something? |
|
@Melantrix Please try a full refresh ( |
|
I've done that but after manually deleting chrome and reinstalling it. (NB: I am on mobile; Chrome on Android) |
|
@Melantrix Do you mean that it still doesn't work? |
|
Oh I'm sorry, that message was absolutely unclear xD it works now, but only after reinstalling the app.. |
|
By uninstalling and reinstalling the app, it cleared its cached data. This issue is fixed in v4.0. |
|
This issue has been mentioned on Pi-hole Userspace. There might be relevant details there: |
In raising this issue, I confirm the following:
How familiar are you with the codebase?:
3
The new Clients over Time popover gets cut off, rendering it basically unusable for determining which client made a huge spike in queries.
The text was updated successfully, but these errors were encountered: