Note Share via https://djay.github.io/covidthailand
Thailand COVID-19 case/test/vaccination data gathered and combined from various government sources for others to view or download.
- Updated daily 8-9am summary info, 1-3pm from full briefing. Testing data is updated every 1-3 weeks.
![]() .
.
Cases | Active Cases | Deaths | Testing | Vaccinations | Downloads | About
NEW Excess Deaths
Data offered here is offered as is with no guarentees. As much as possible government reportsk and data feeds have been used effort has gone into making this data collection accurate and timely. This sites only intention is to give an accurate representation of all the available Covid data for Thailand in one place.
Links to all data sources are including in Downloads

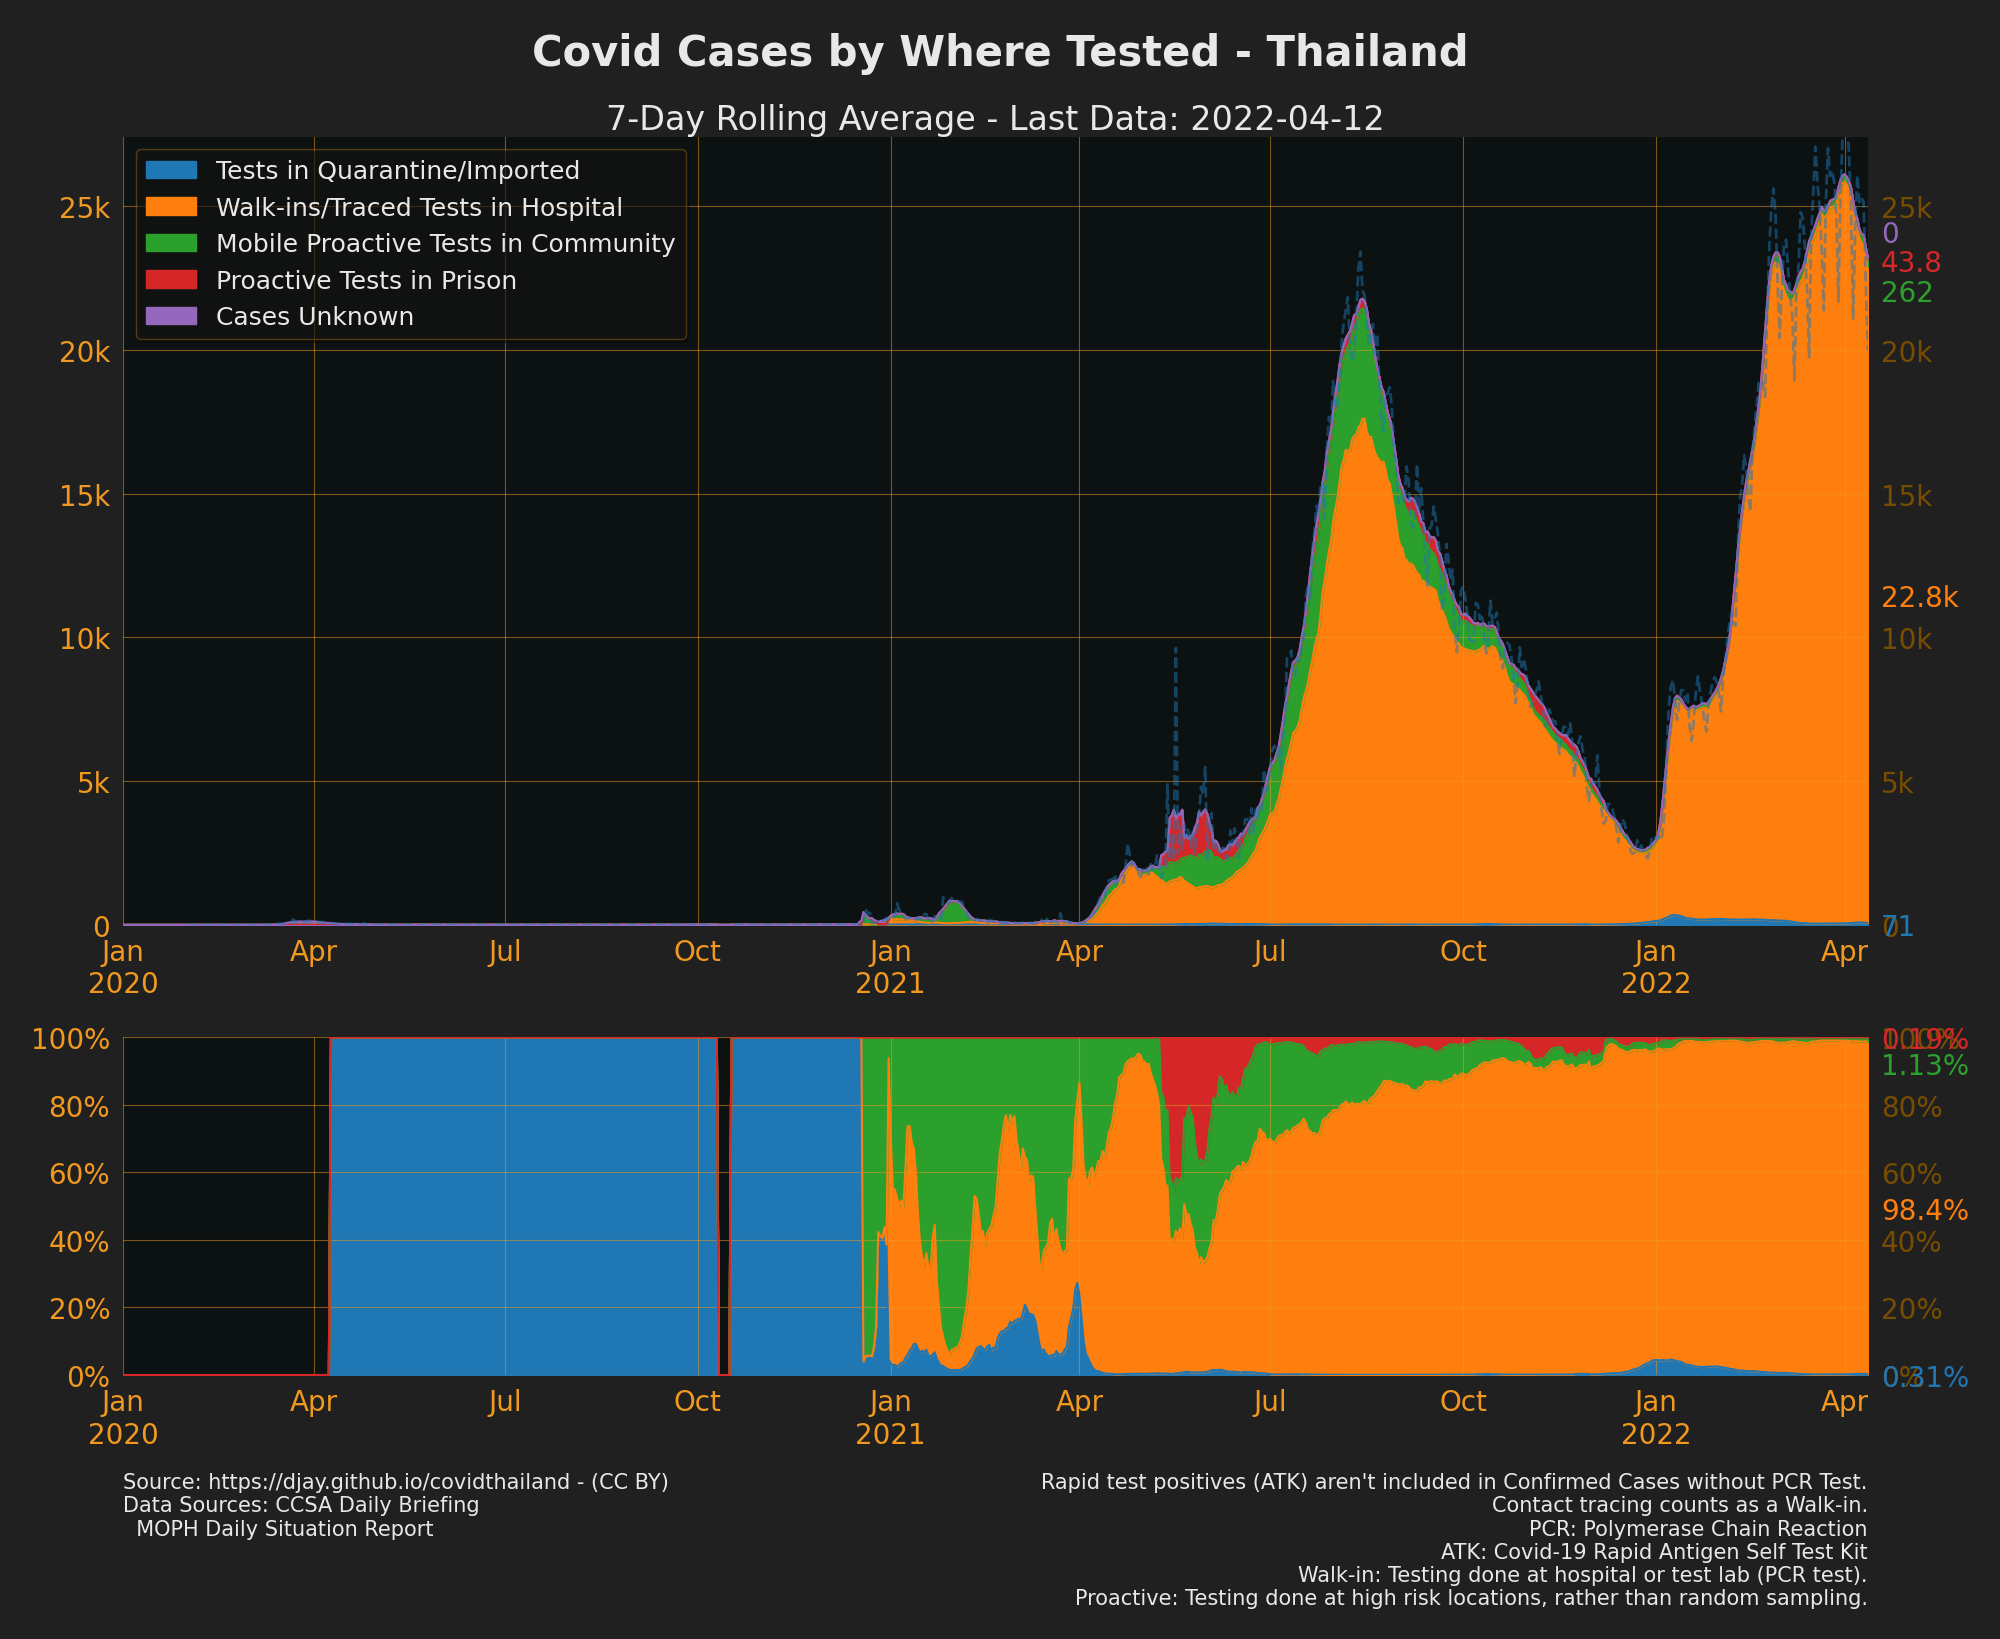
- Source of Confirmed Cases: 2020-2021
- Contact tracing normally counts as a "Walk-in"
- Proactive tests are normally done at specific high risk locations or places of known cases, rather than random sampling (but it's possible random sampling may also be included).
- Sources: CCSA Daily Briefing, MOPH daily situation report

- Grouped from original data which has over 70 risk categories. Clusters have been grouped into either Work (Factories), Entertainment (bars/gambling etc) or Community (markets) related.
- Note: SS Cluster is classified as "Work", but some other market clusters are classified as "Community". This is because there isn't enough data to separate out SS cluster cases between those from factories and those from the market. This could change later.
- Risk is most likely determined as part of the PUI criteria process?
- Cases by Risk: Full Year
- Source: API: Daily reports of COVID-19 infections
To see cases for every province go to The Researcher Covid Tracker


-
Sources: CCSA Daily Briefing, API: Daily reports of COVID-19 infections
-
see also Trending Down Confirmed Cases, Trending Up Contact Cases Trending Up Community Cases, Trending Up Work Cases and Trending Up Proactive Cases

- To see cases for every province go to The Researcher Covid Tracker
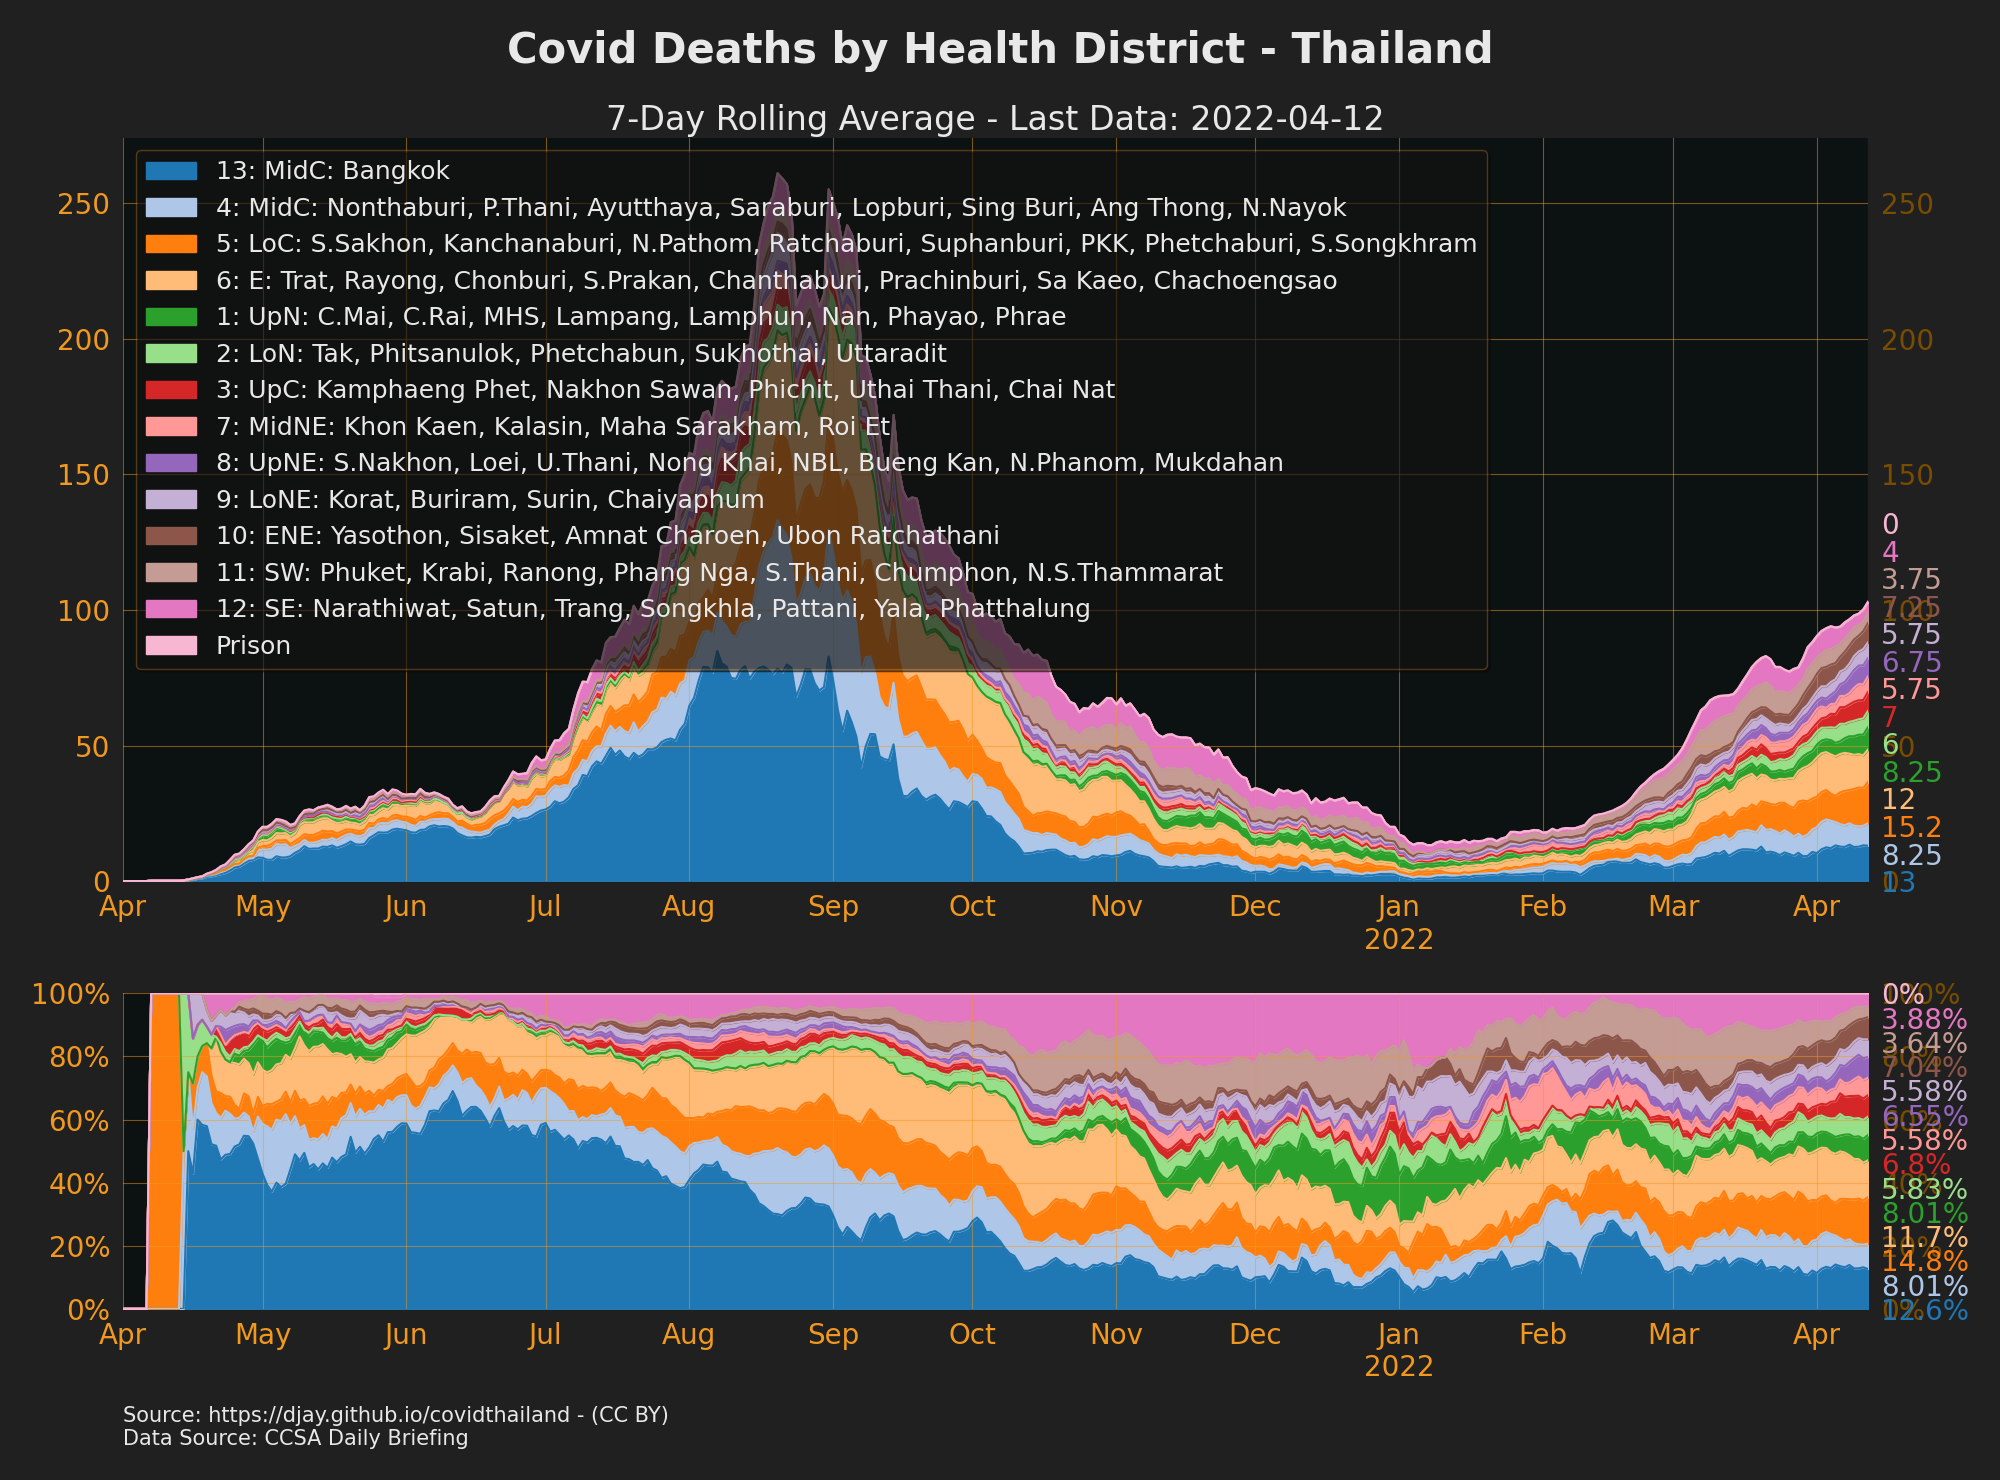
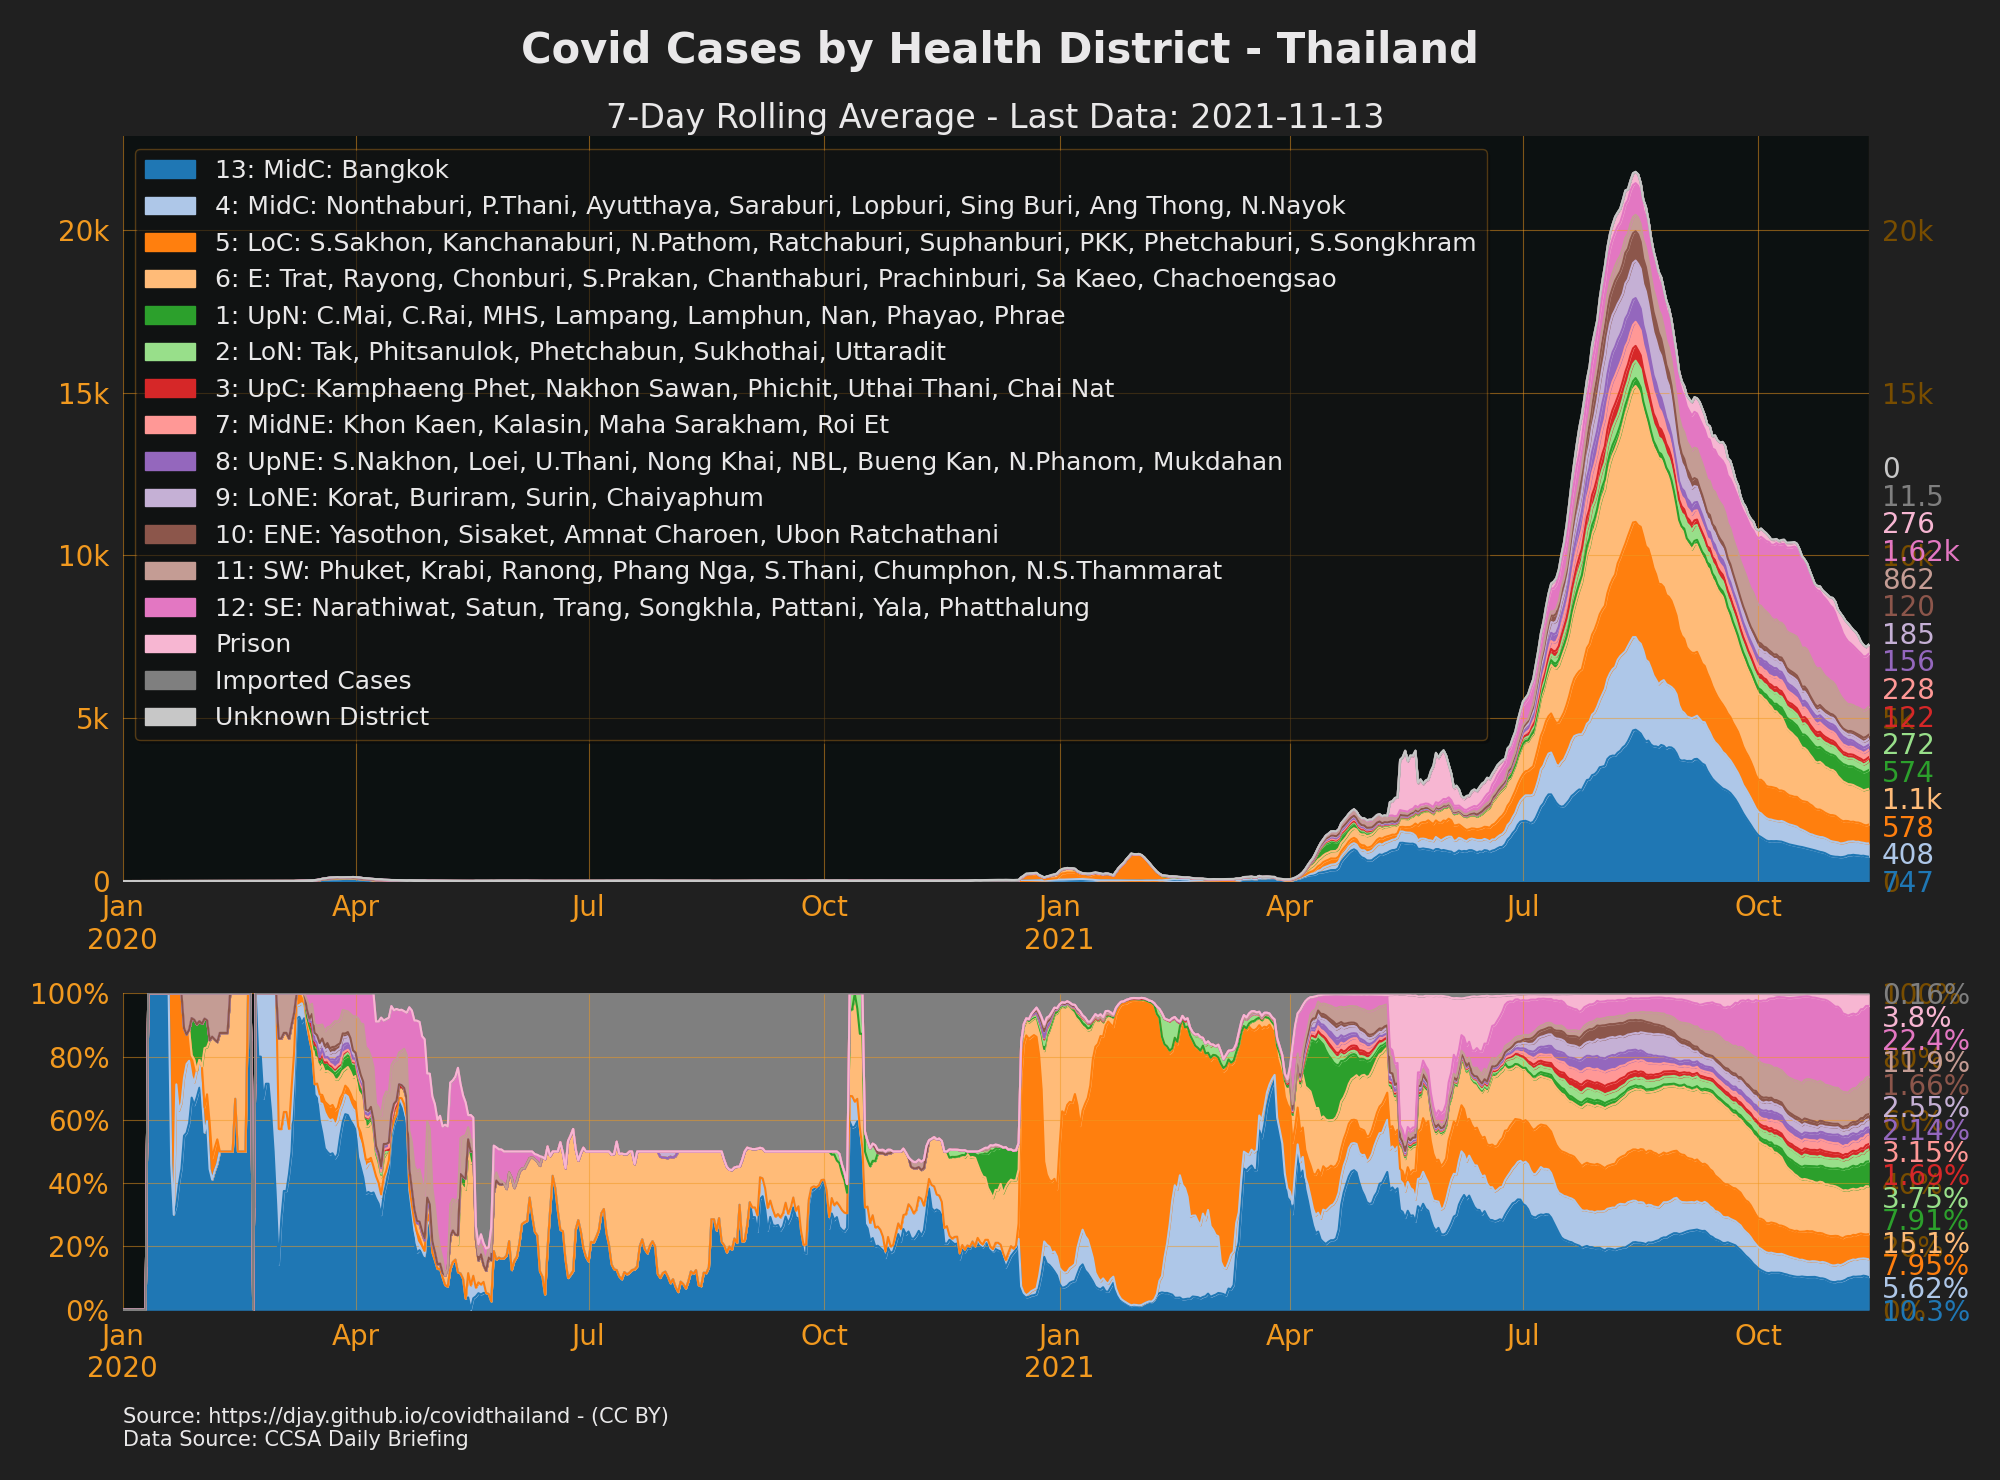
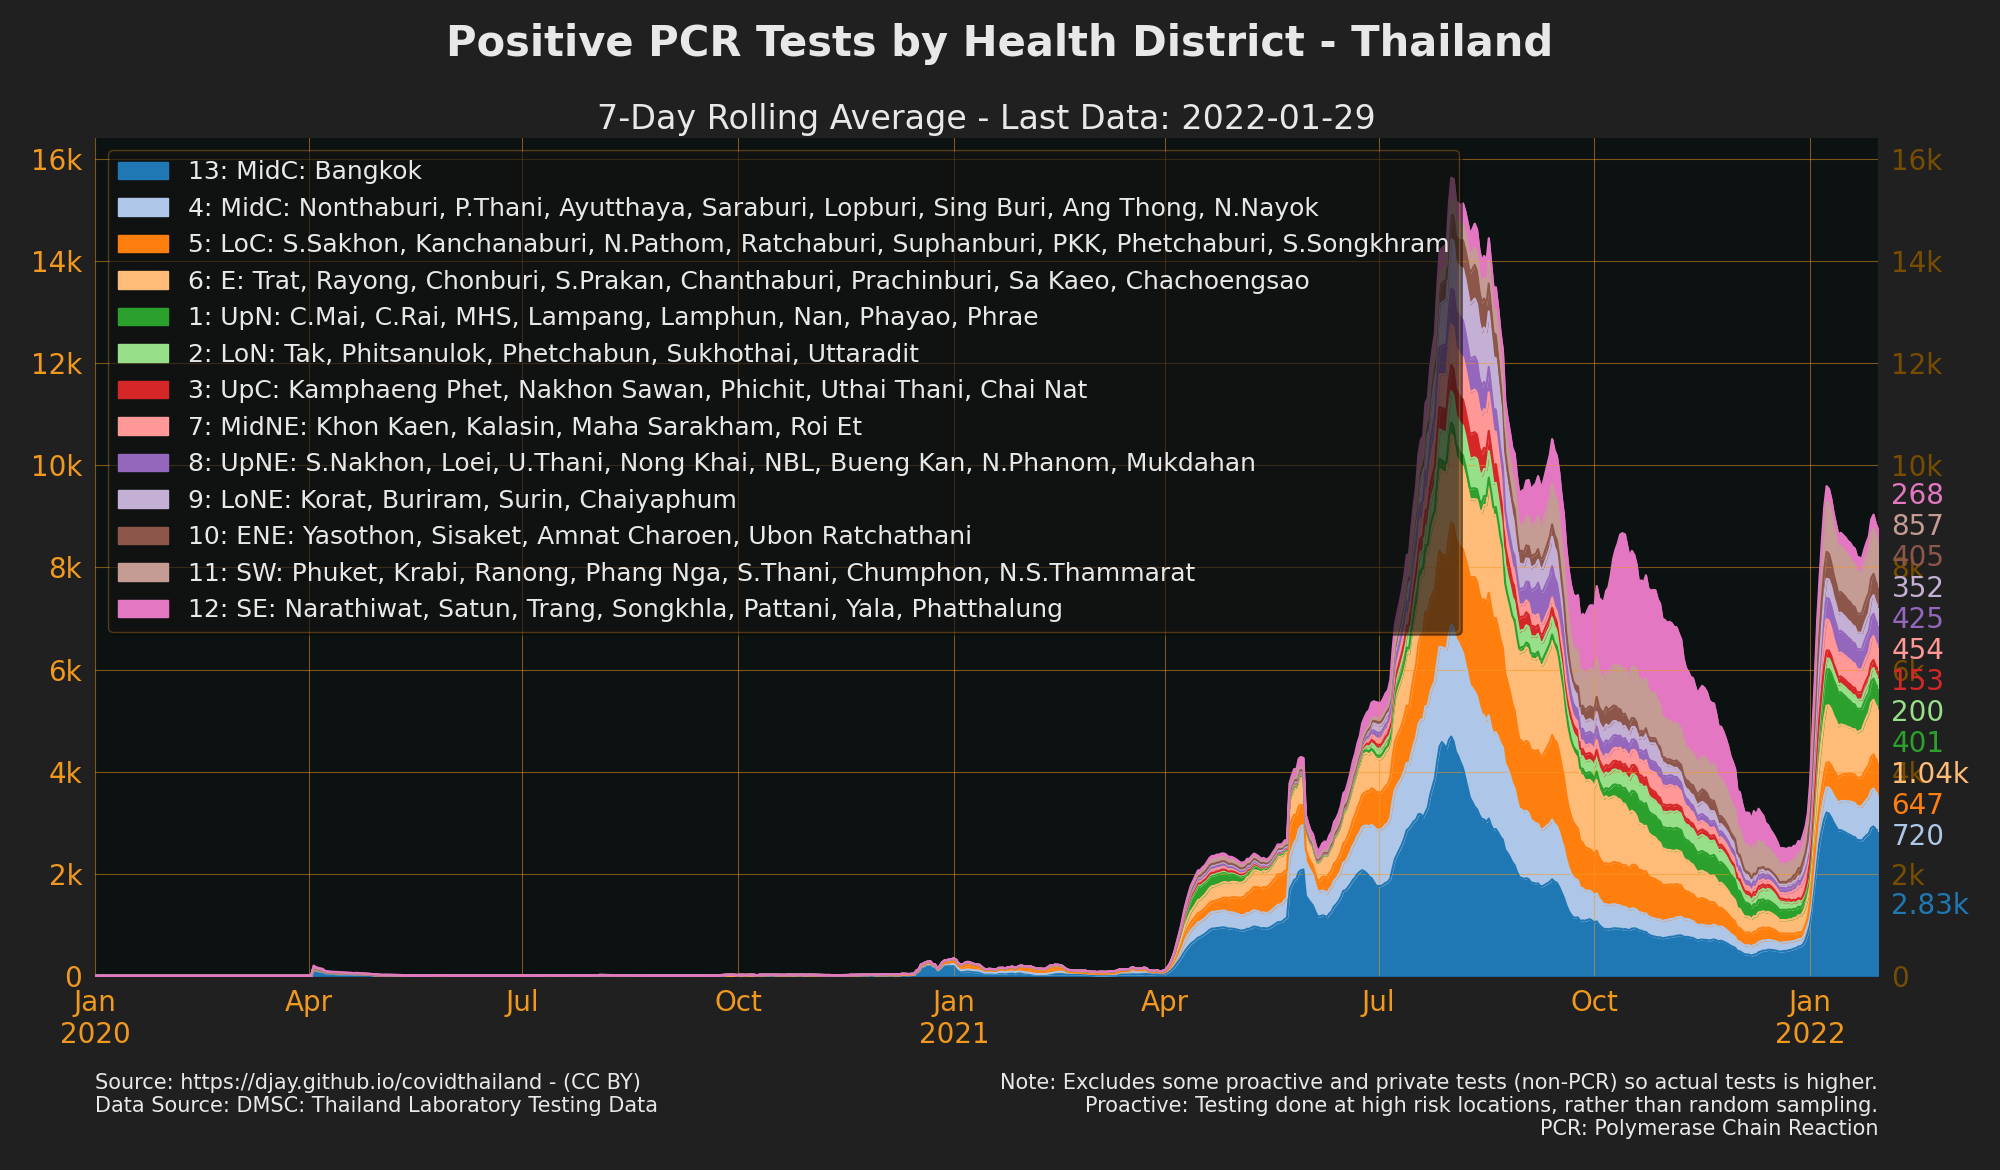
- Cases by Health District: Full Year
- Thailand Health Districts
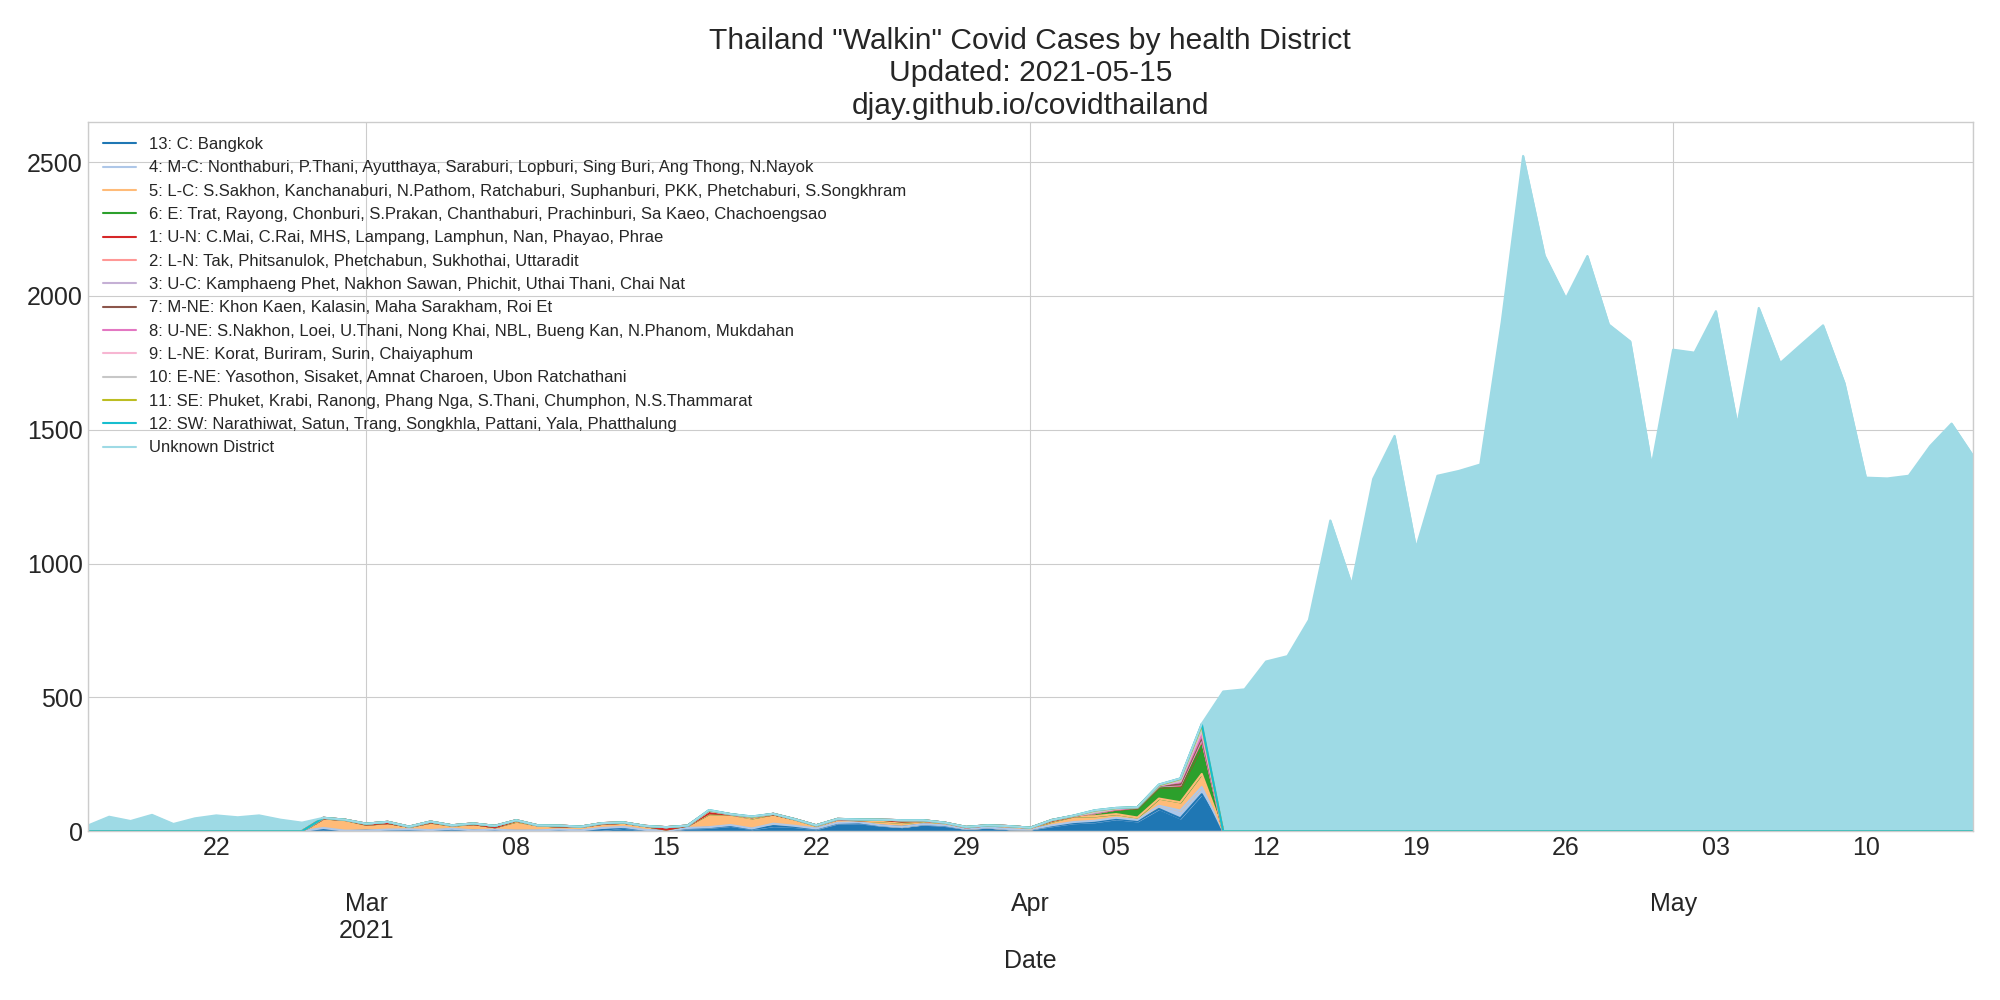
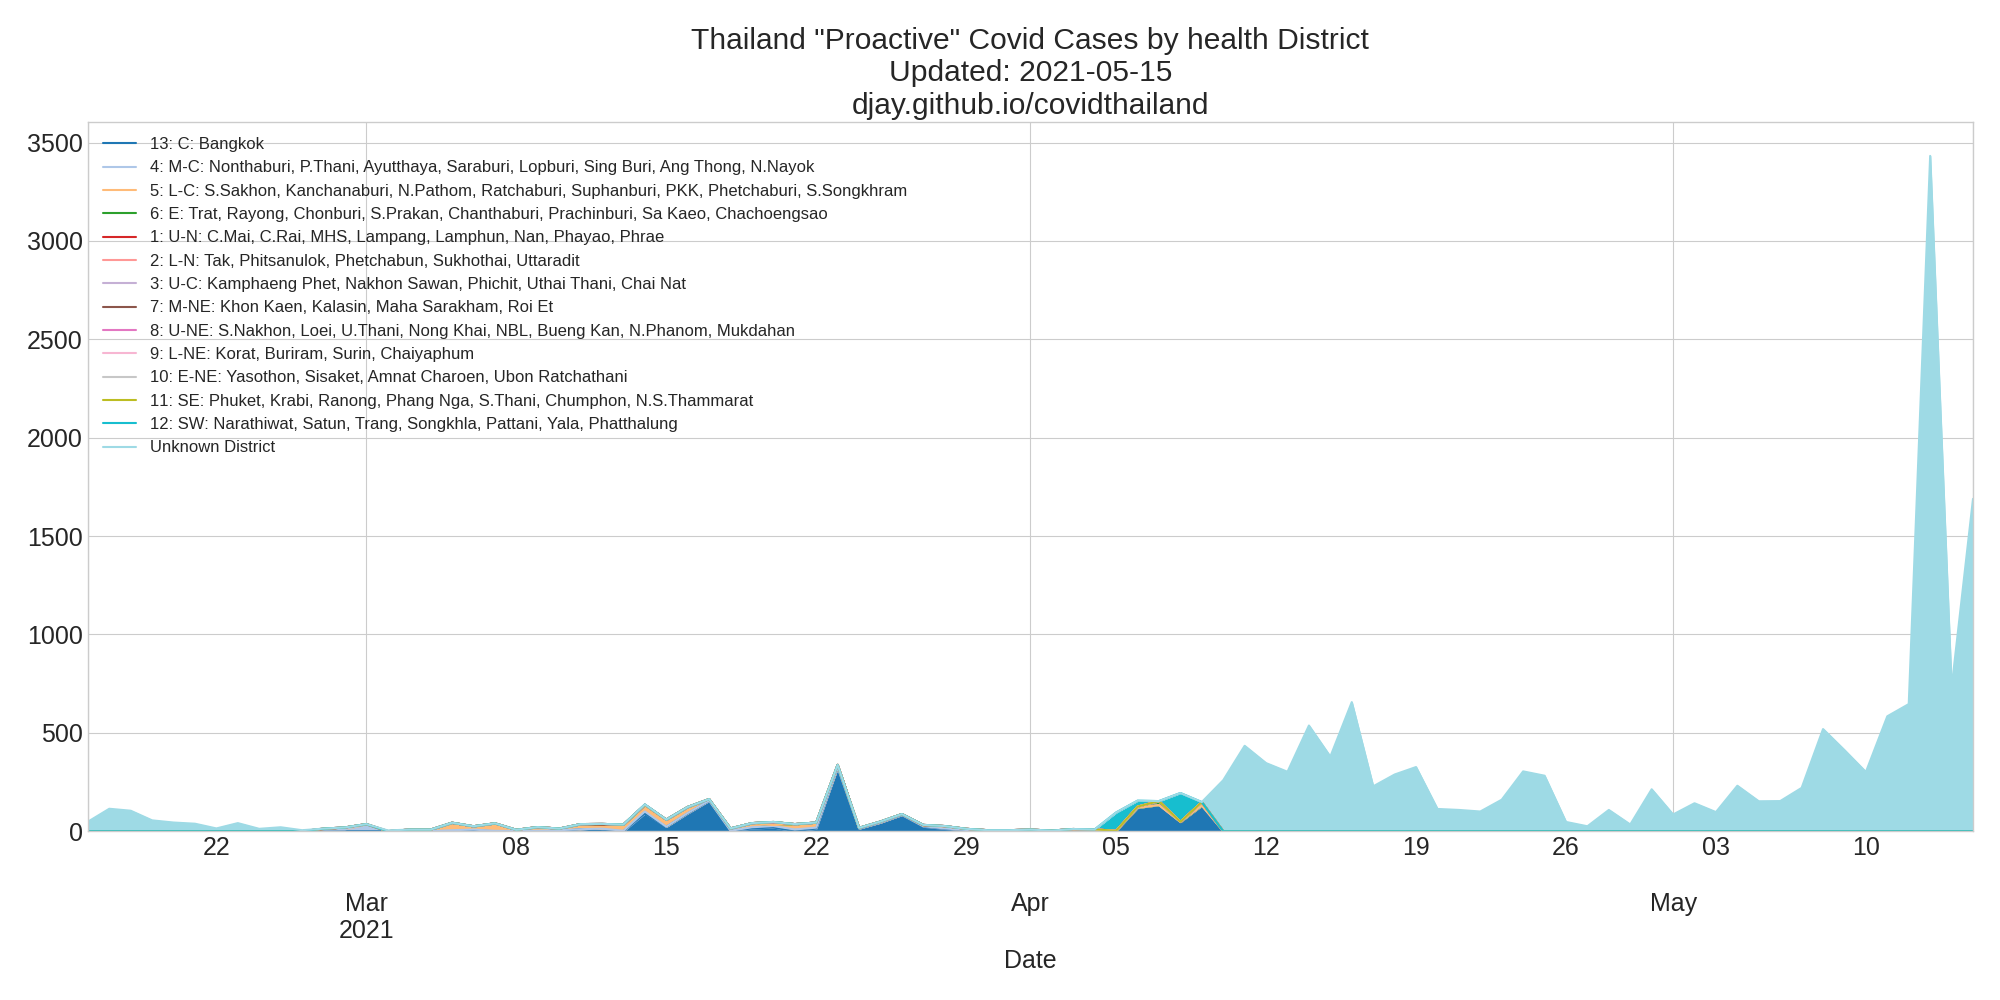
- You can also see Cases by District broken down by walk-in vs proactive but there is no longer a data source to keep this updated.
- Sources: CCSA Daily Briefing

- see Ages of confirmed cases 2020-2021
- Source: API: Daily reports of COVID-19 infections

- Due to the Asymptomatic nature of Covid all countries have more infections than can be confirmed via testing.
- Research has been done to work out how many real infections there are in many countries to work out an estimated global Infection Fatality Rate of the virus for each age group. A simple estimate based on reported deaths using a per province IFR back-dated 11 days (median reported time till death for thailand) gives an estimate of infections, however there are many assumptions, that if wrong, could make this estimate higher e.g. uncounted covid deaths.
- This doesn't mean there is not enough testing being done in Thailand. Positive rate is another indication of testing effectiveness.
- More detail models with predictions that take into account factors like Goggle mobility data to predict infections based on adherence to social distancing measures.
- ICL Covid Model (OWID ICL),
- IHME Covid Model (OWID IHME)
- LSHTM Model.
- OWID Covid Models for Thailand lets you compare these infection estimates.
- Sources: CCSA Daily Briefing, Covid IFR Analysis, Thailand population by Age

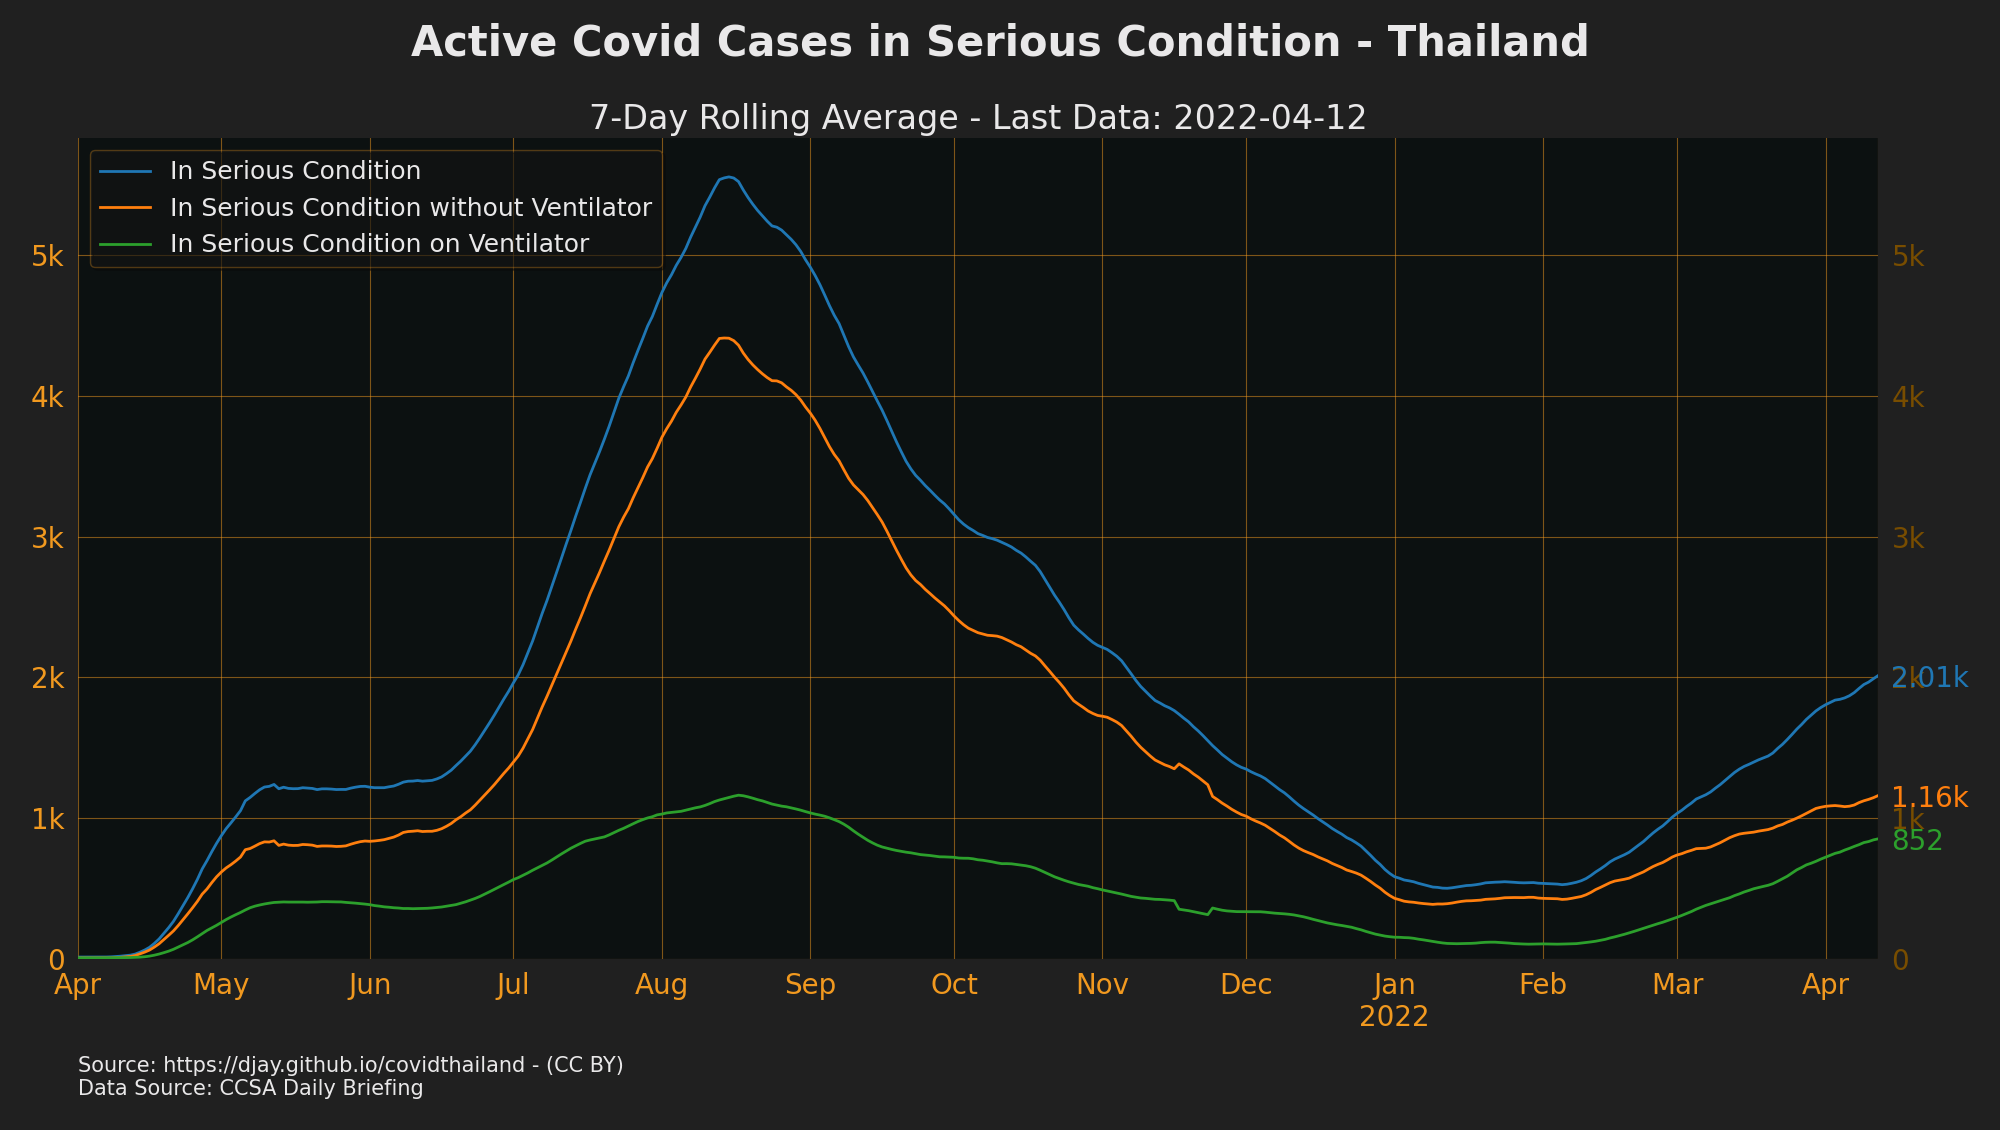
- Break down of active case status only available from 2020-04-24 onwards.
- Other Active Cases + ICU + Ventilator + Field hospitals = Hospitalised, which is everyone who is confirmed (for 14days at least)
- see Thailand Active Cases 2020-2021
- Source: CCSA Daily Briefing
- source: CCSA Daily Briefing
- source: CCSA Daily Briefing
- Source: CCSA Daily Briefing
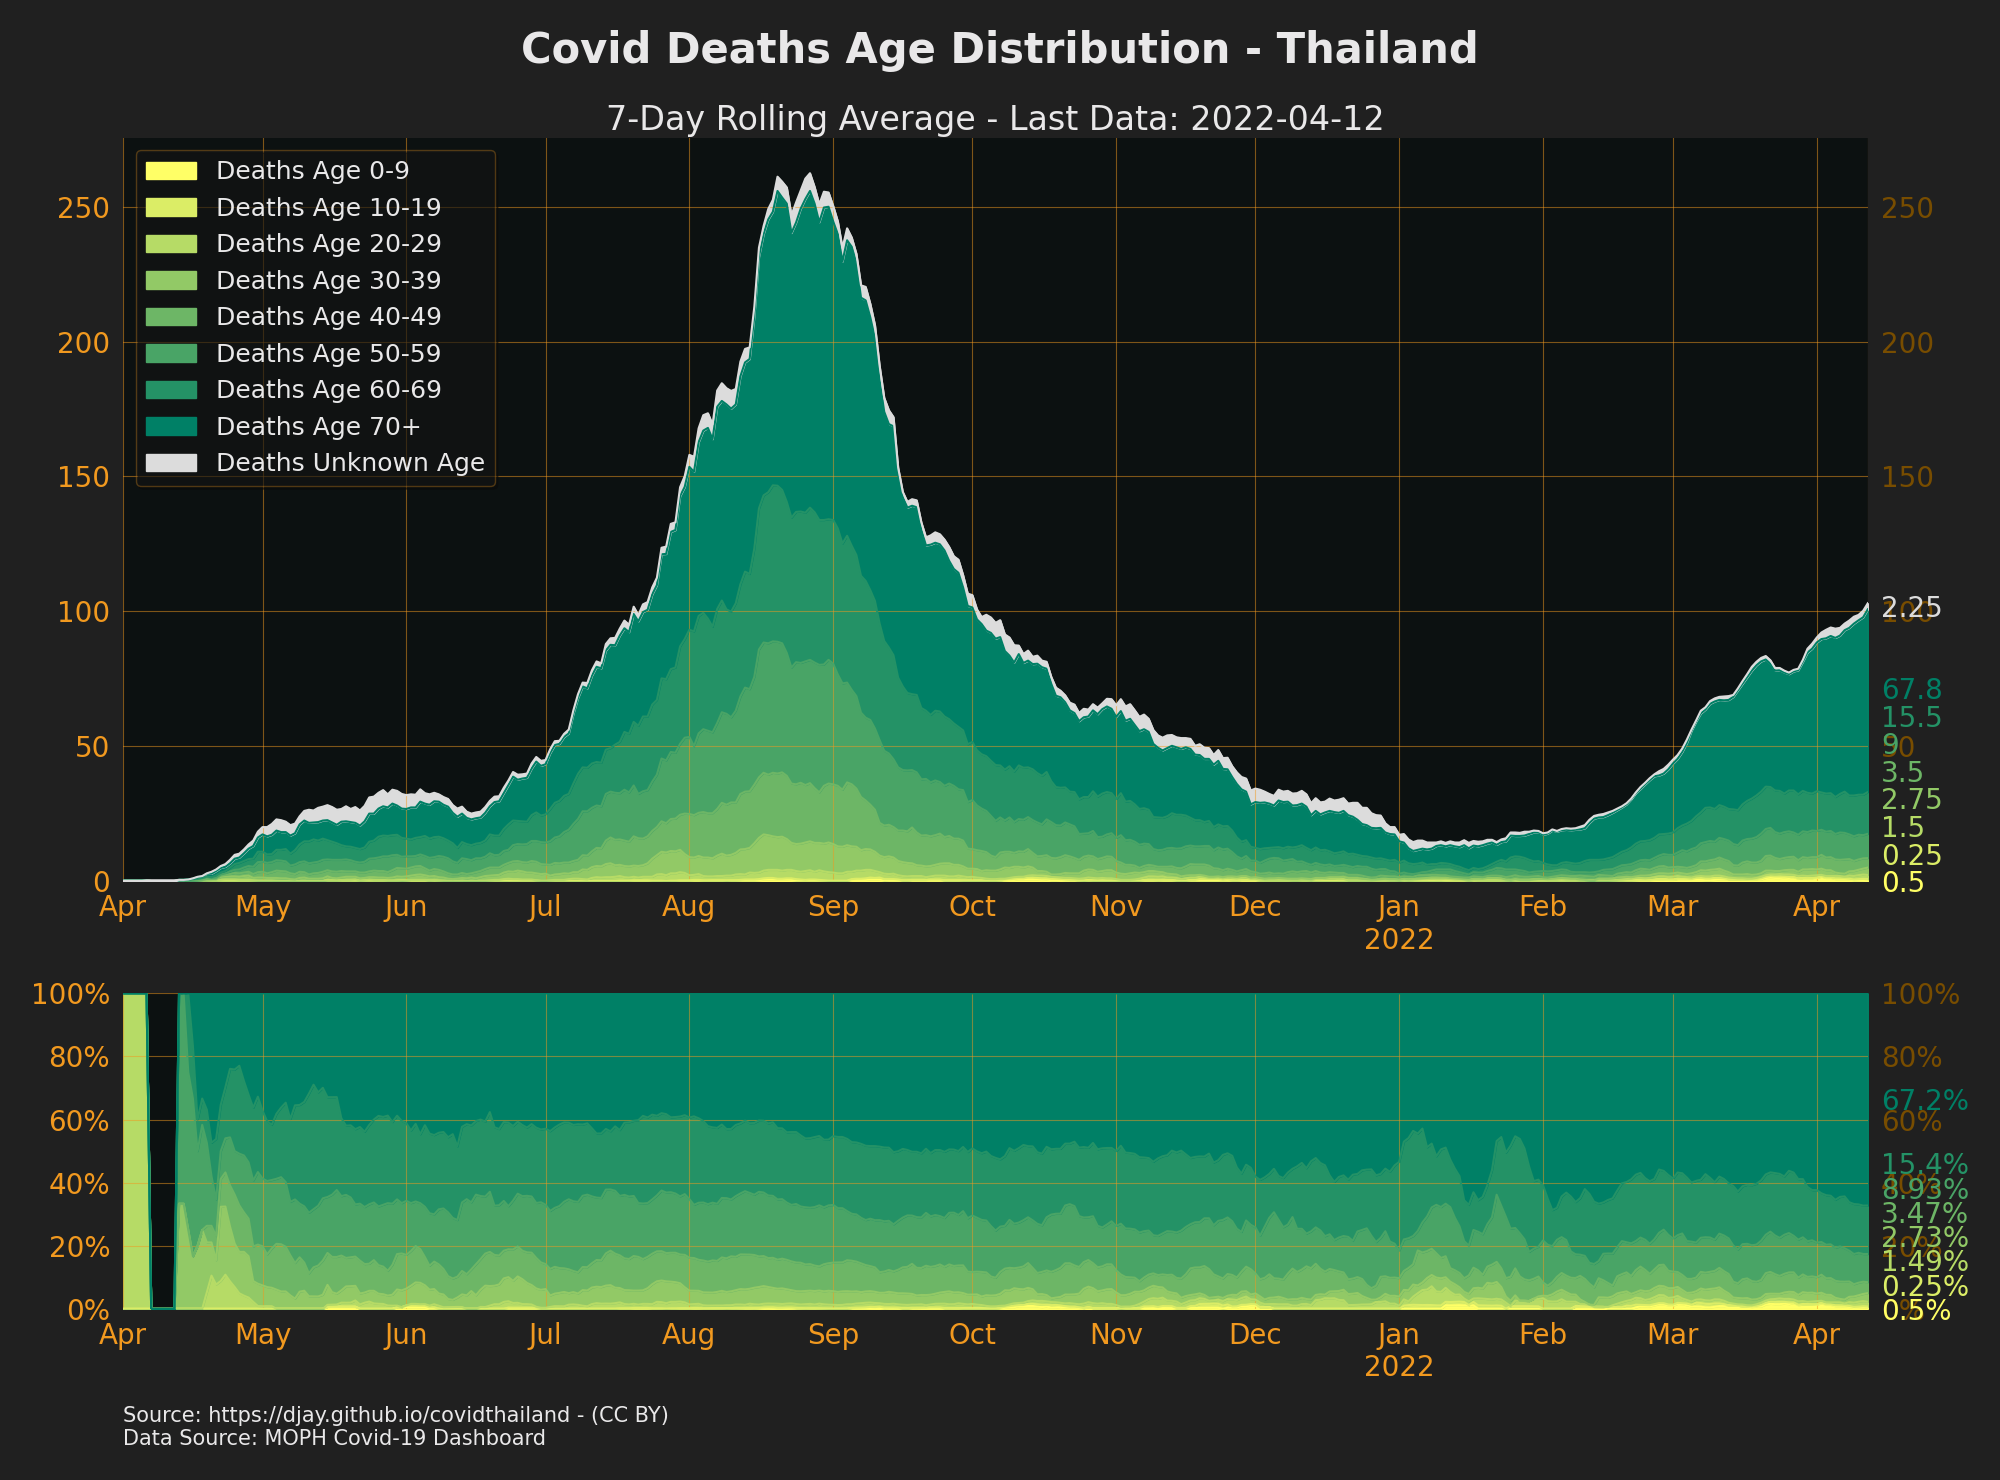
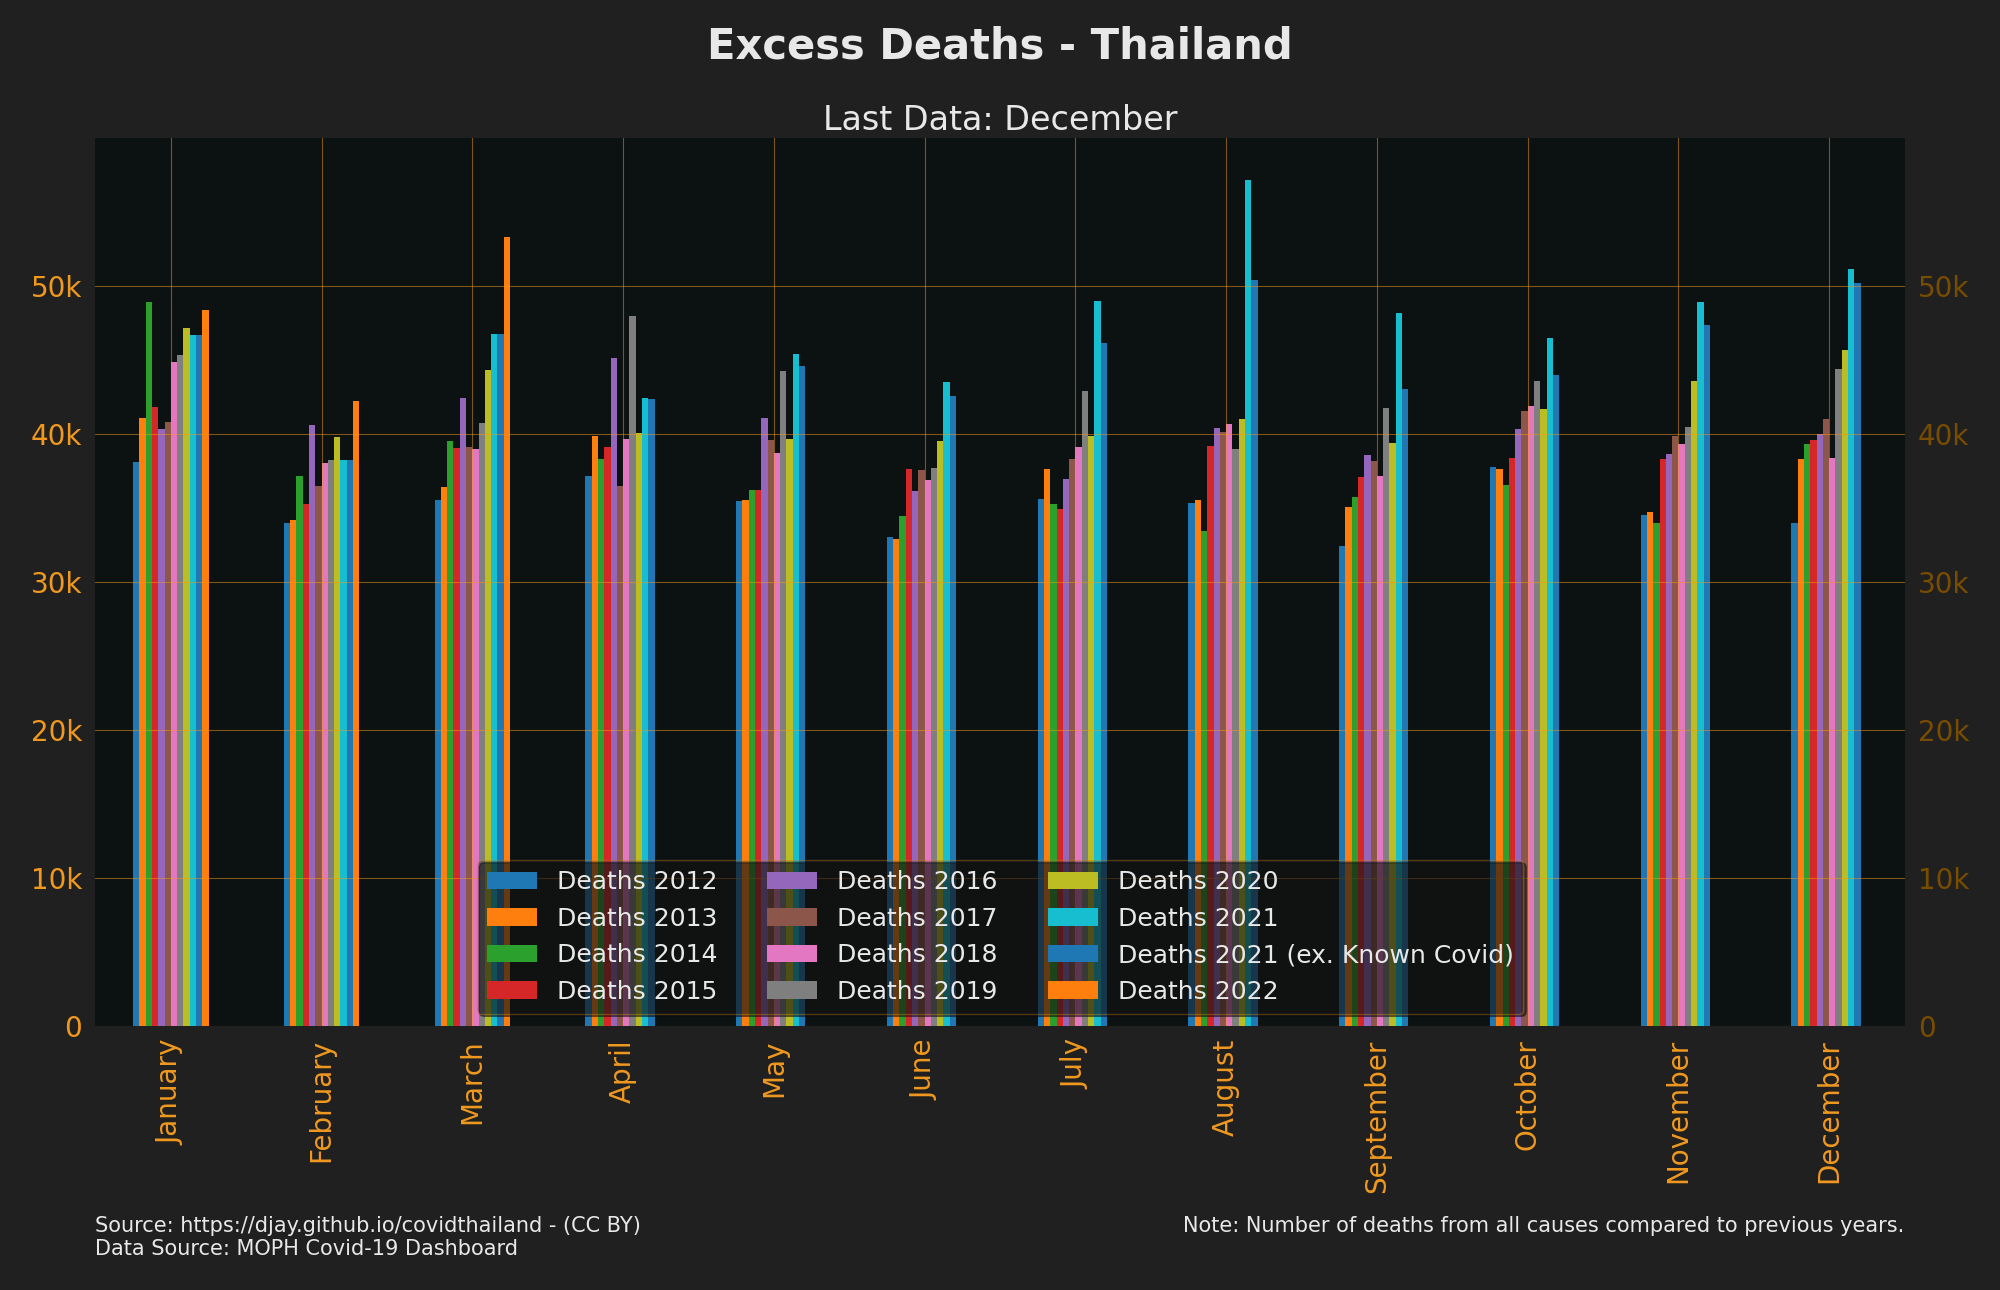
- Source: MOPH Covid-19 Dashboard
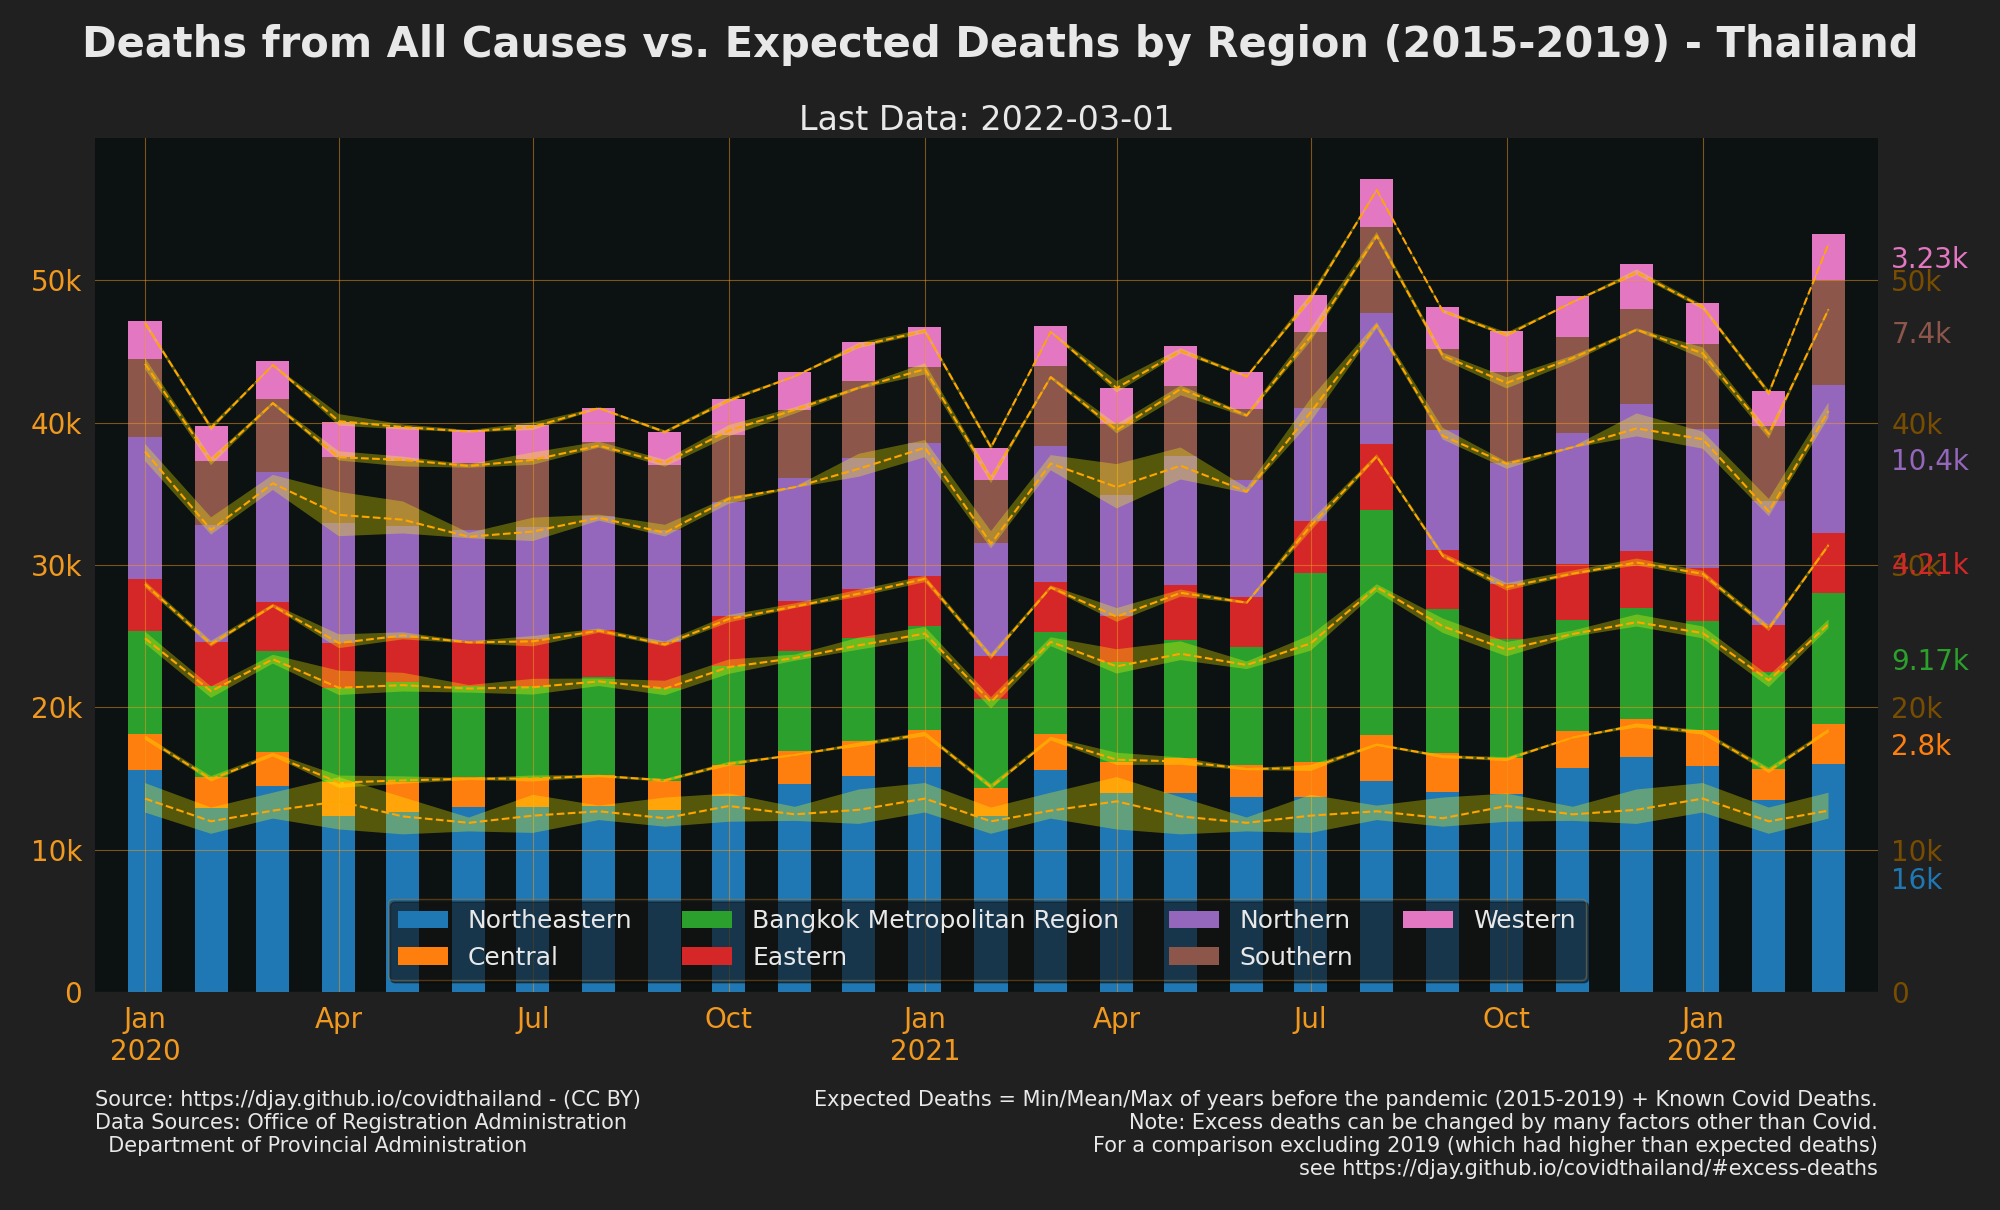
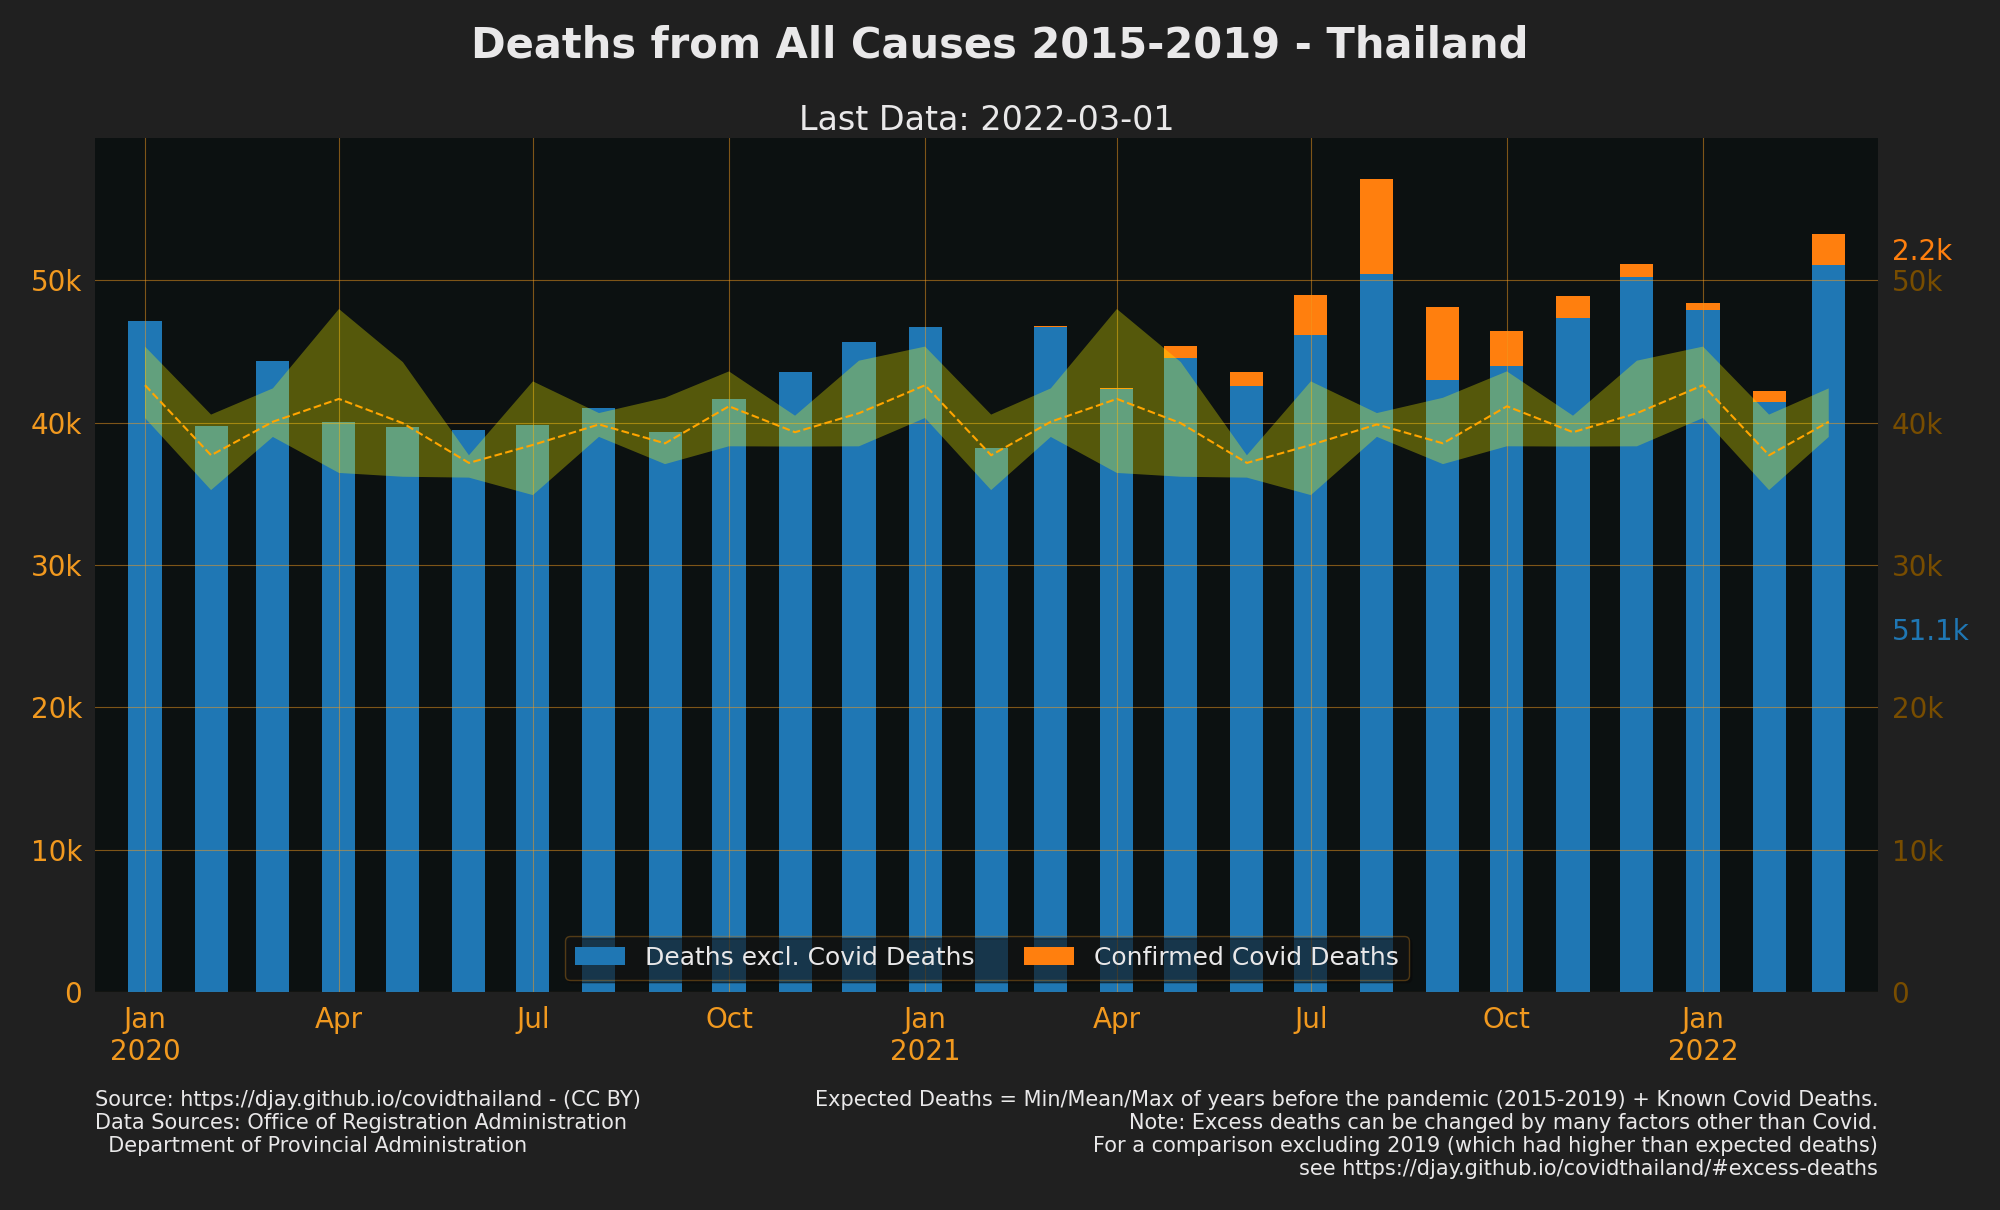
Shows Deaths from all causes in comparison to the min, max and mean of Deaths from the 5 years pre-pandemic.
- Note: there are many possible factors alter deaths up or down other than uncounted Covid Deaths

Notes
- 2019 had an unusual increase in deaths compared to the previous 4 years but is unclear yet why. Links excluding 2019 have additionally been included as it's not yet clear which range of years provides the best baseline to compare against.
- Compare Excess deaths across countries with OWID Excess Deaths or Economist Excess Death Tracker.
- Source Office of Registration Administration, Department of Provincial Administration

- NOTE Walkin Cases/3*PUI seems to give an estimate of positive rate (when cases are high), so it is included for when testing data is delayed. Note it is not the actual positive rate.
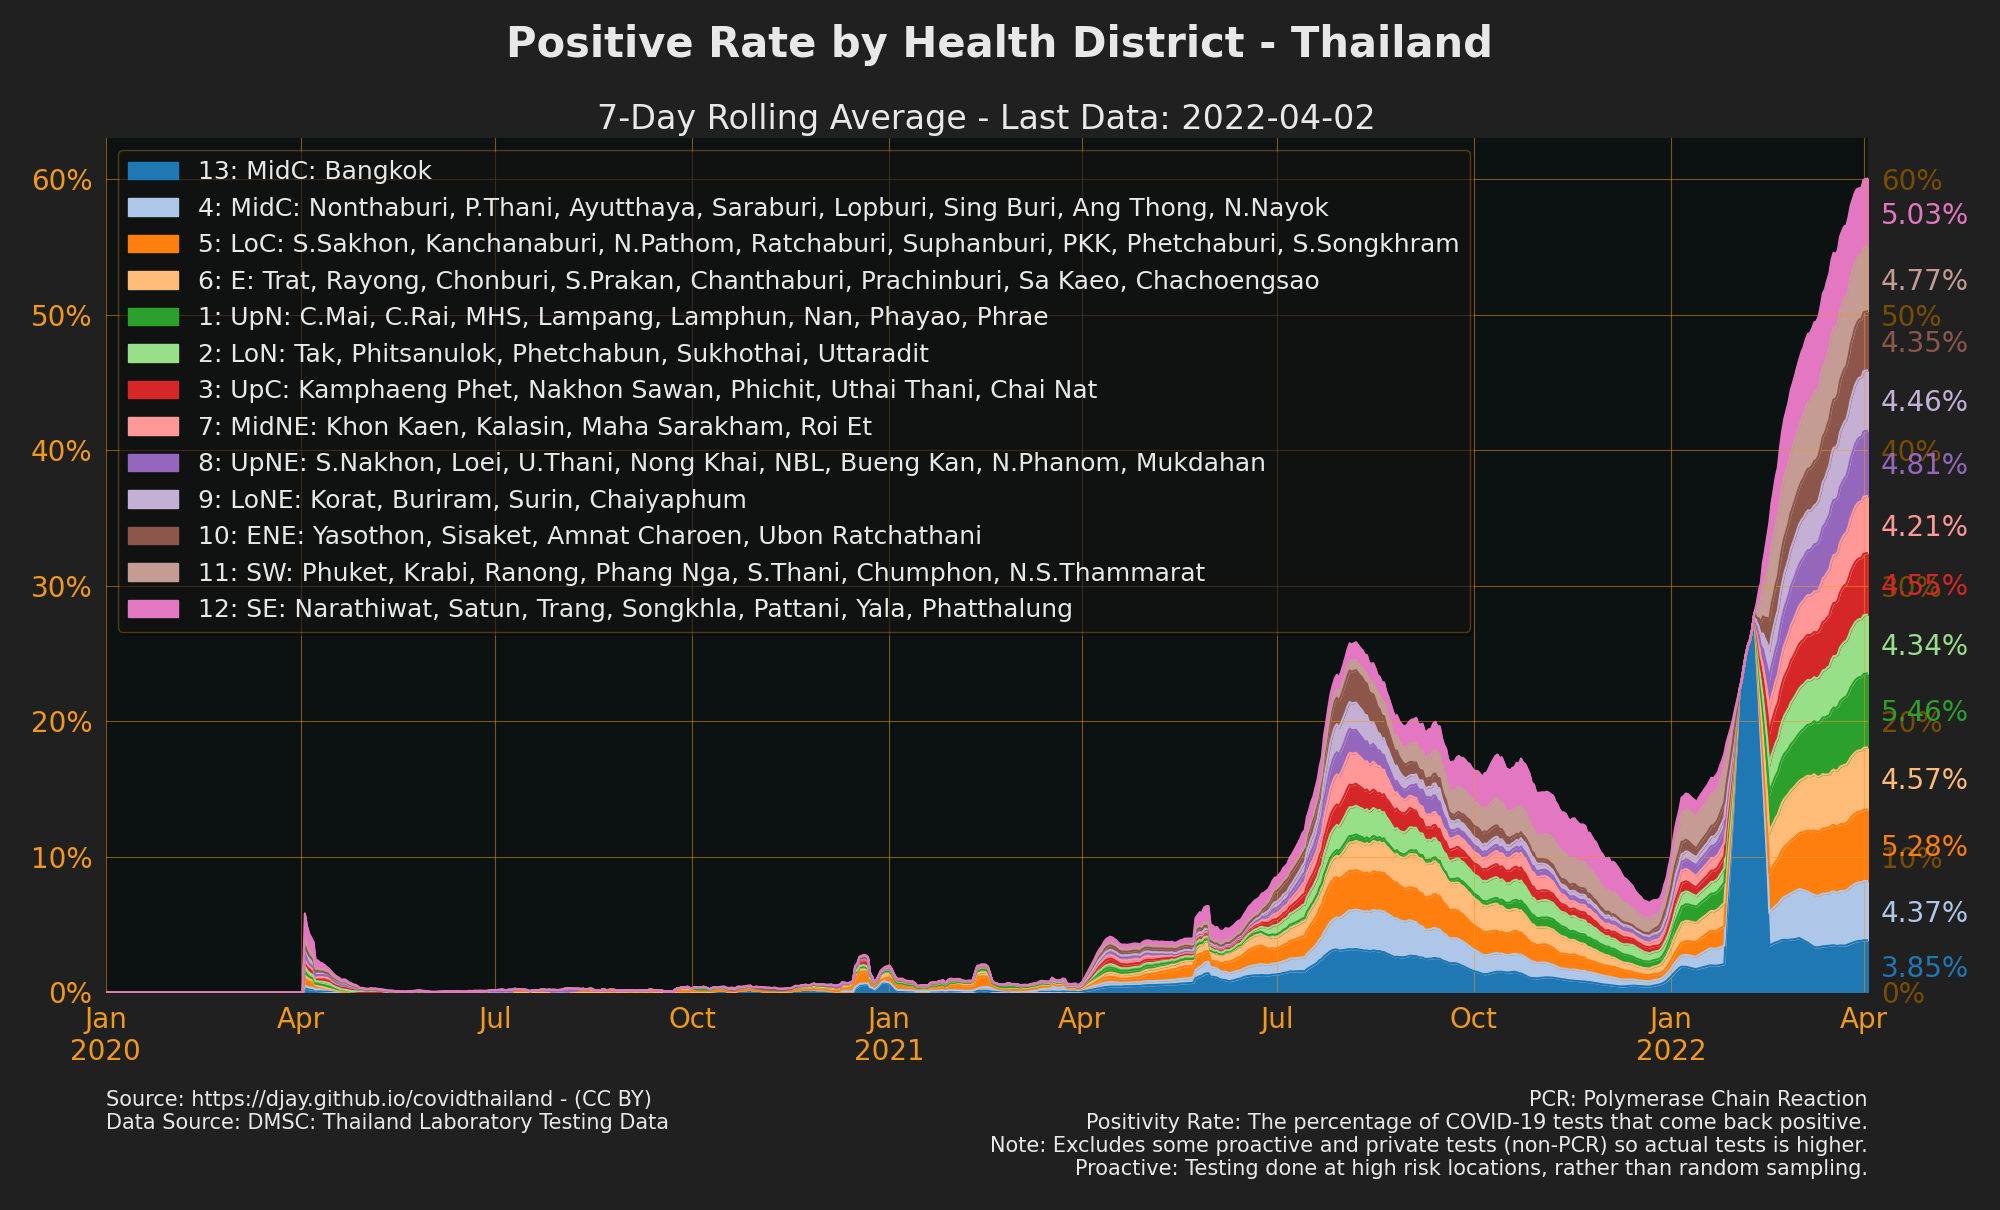
- Positive rate is little like fishing in a lake. If you get few nibbles each time you put your line in you can guess that there is few fish in the lake. Less positives per test, less infections likely in the population.
- WHO considers enough testing is happening if positive rate is under %5 rather than tests per population but only if 0.1% of the population is being tested per week (avg 7k tests per day for Thailand). Note this recommendation works best if everyone who might have COVID-19 is equally likely to get tested and there are reasons why this might not be the case in Thailand.
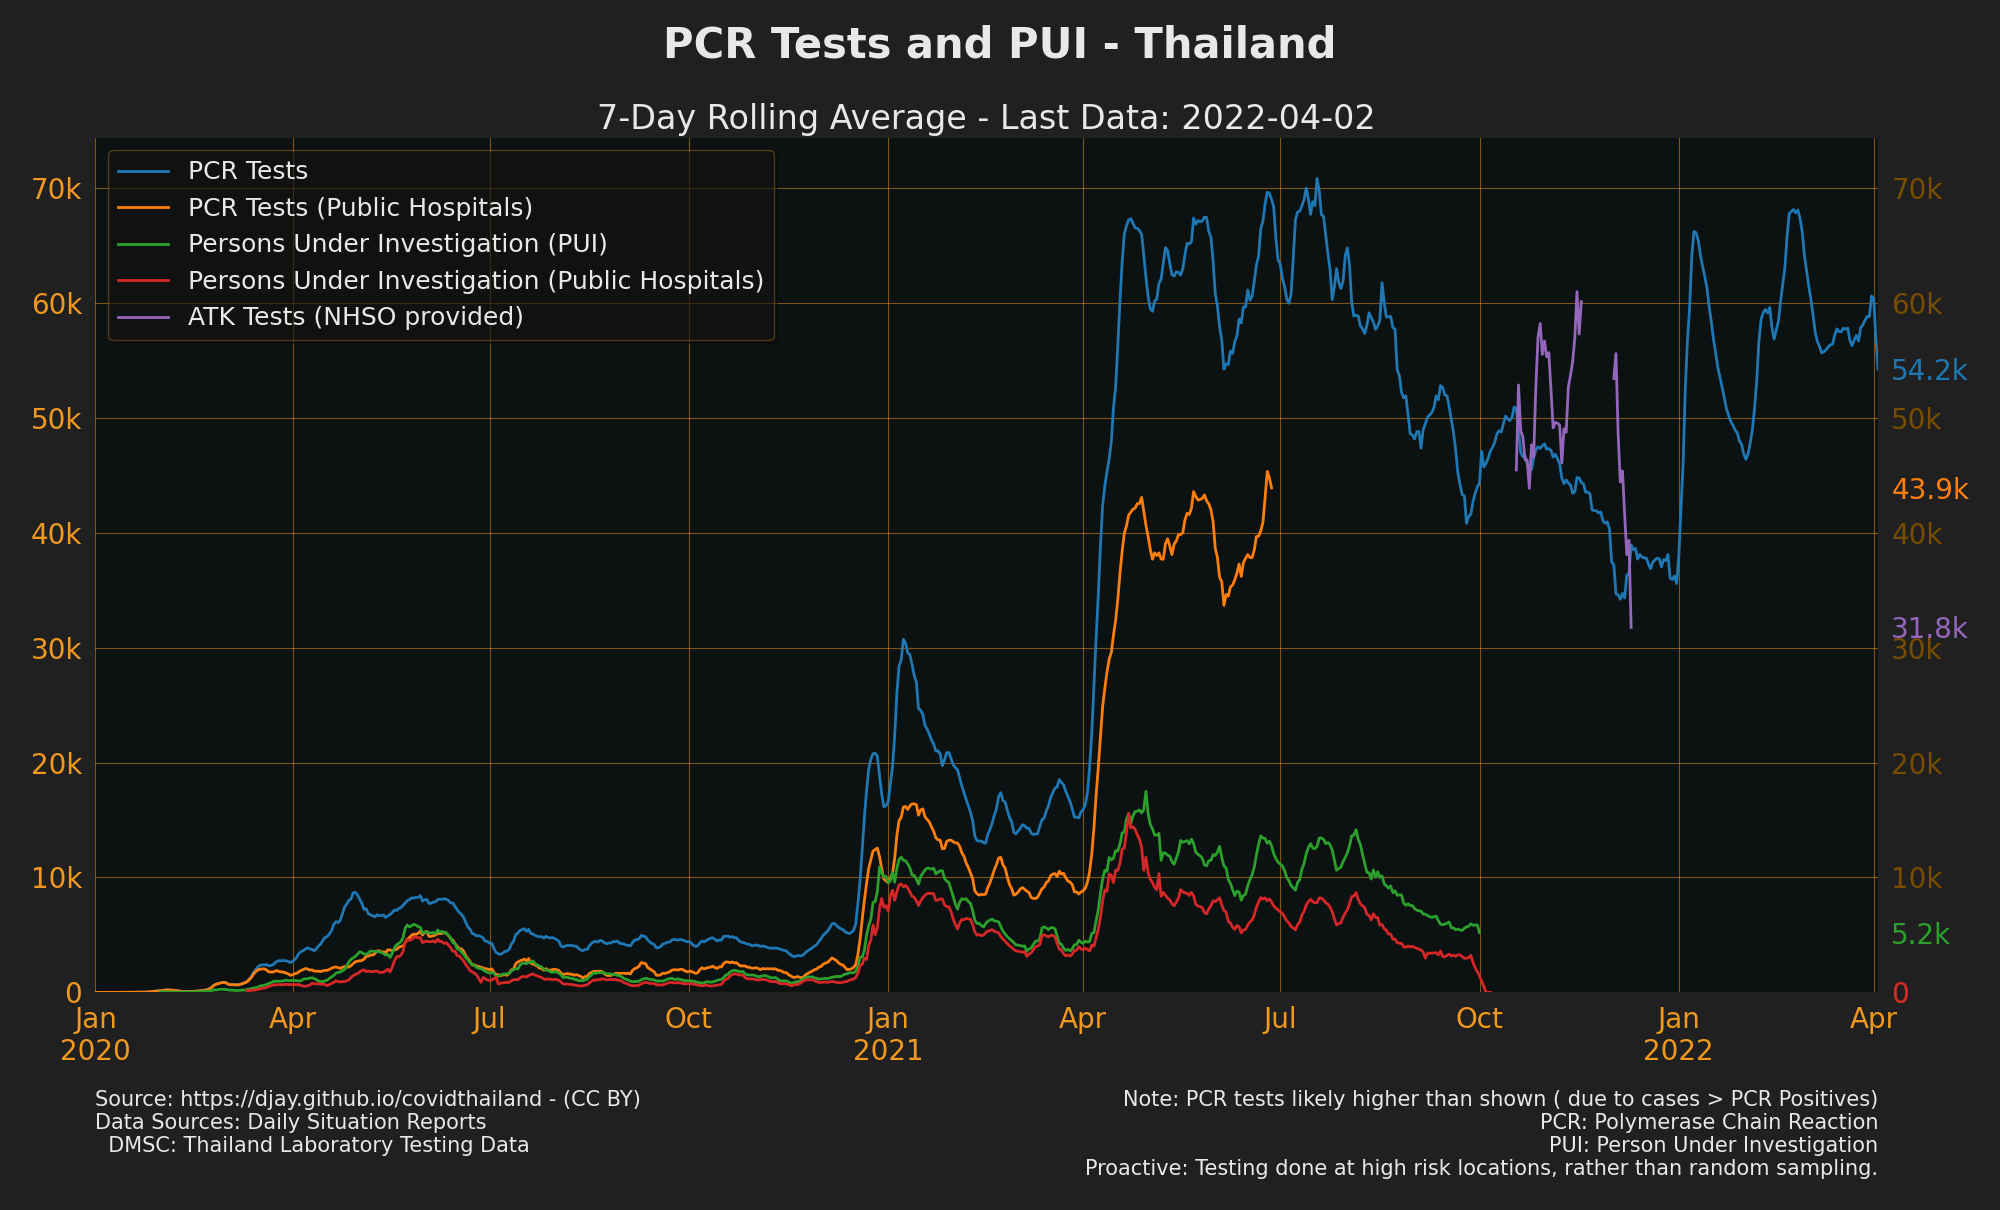
- It's likely Thailand excludes some test data so there could be more tests than this data shows. Excluding proactive tests from positive rate is perhaps better for comparison with other countries they are less random and more likely to be positive as its testing known clusters.
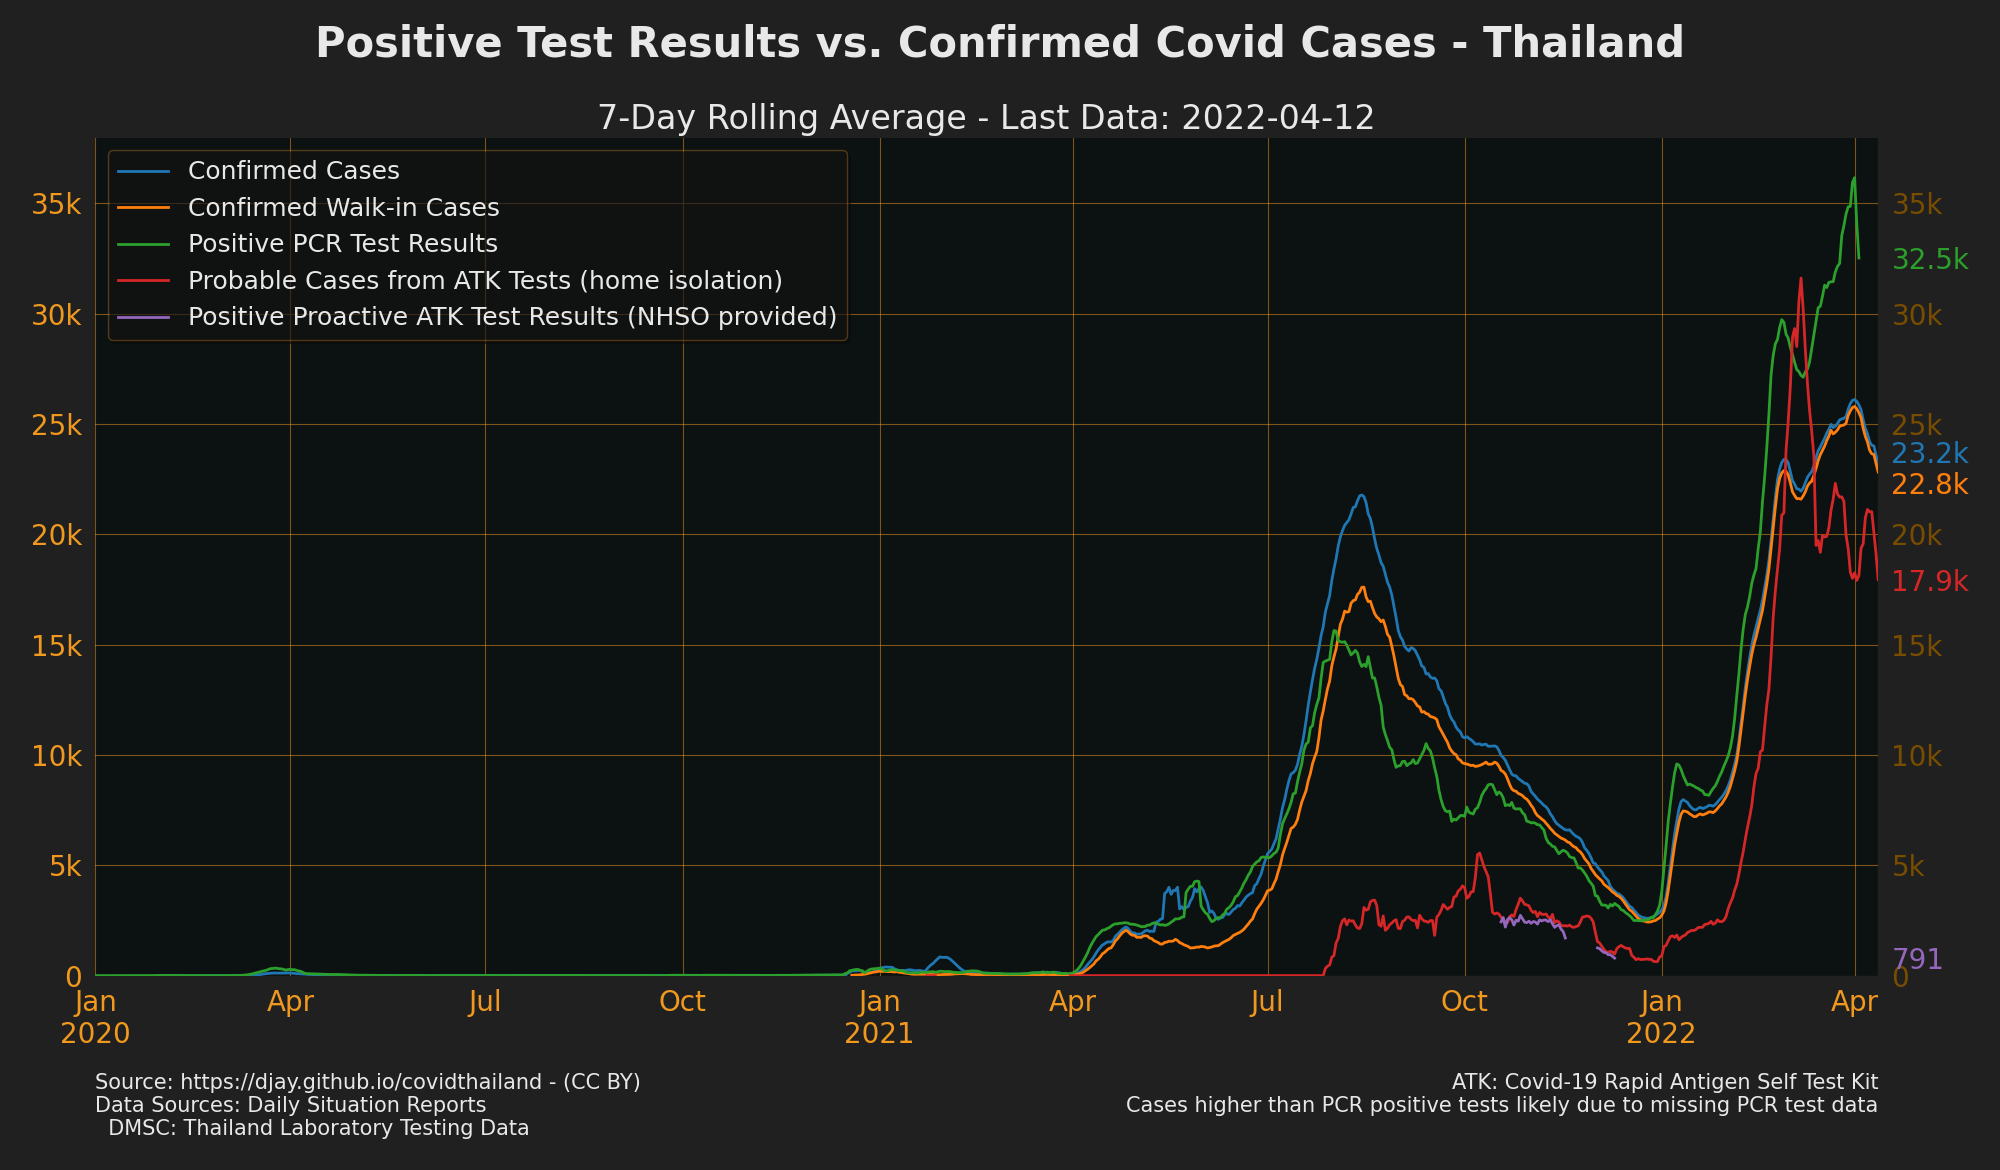
- Rapid antigen tests are not included in the test data, or in confirmed case numbers (unless they also had a positive PCR test). This is similar to most countries however some like UK count antigen tests in both tests and confirmed cases.
- This positive rate is based on DMSC: Thailand Laboratory testing data. In the Daily MOPH Situation Reports is a number labelled
Total number of laboratory tests.Total number of laboratory testsis mislabelled and is exactly the same as the PUI number. - see also Positive Rate: Full year, Tests per Case Graph (Positive rate inverted) could be easier to understand.
- Sources: DMSC: Thailand Laboratory testing data, Daily situation Reports


- There are more confirmed cases than positives in Thailands testing data, this could be for various reasons but could make the positive rate lower.
- Sources: Daily situation Reports, DMSC: Thailand Laboratory testing data

- Tests by health area: Full Year
- NOTE Excludes some proactive tests (non-PCR) so actual tests is higher
- Source: DMSC: Thailand Laboratory testing data
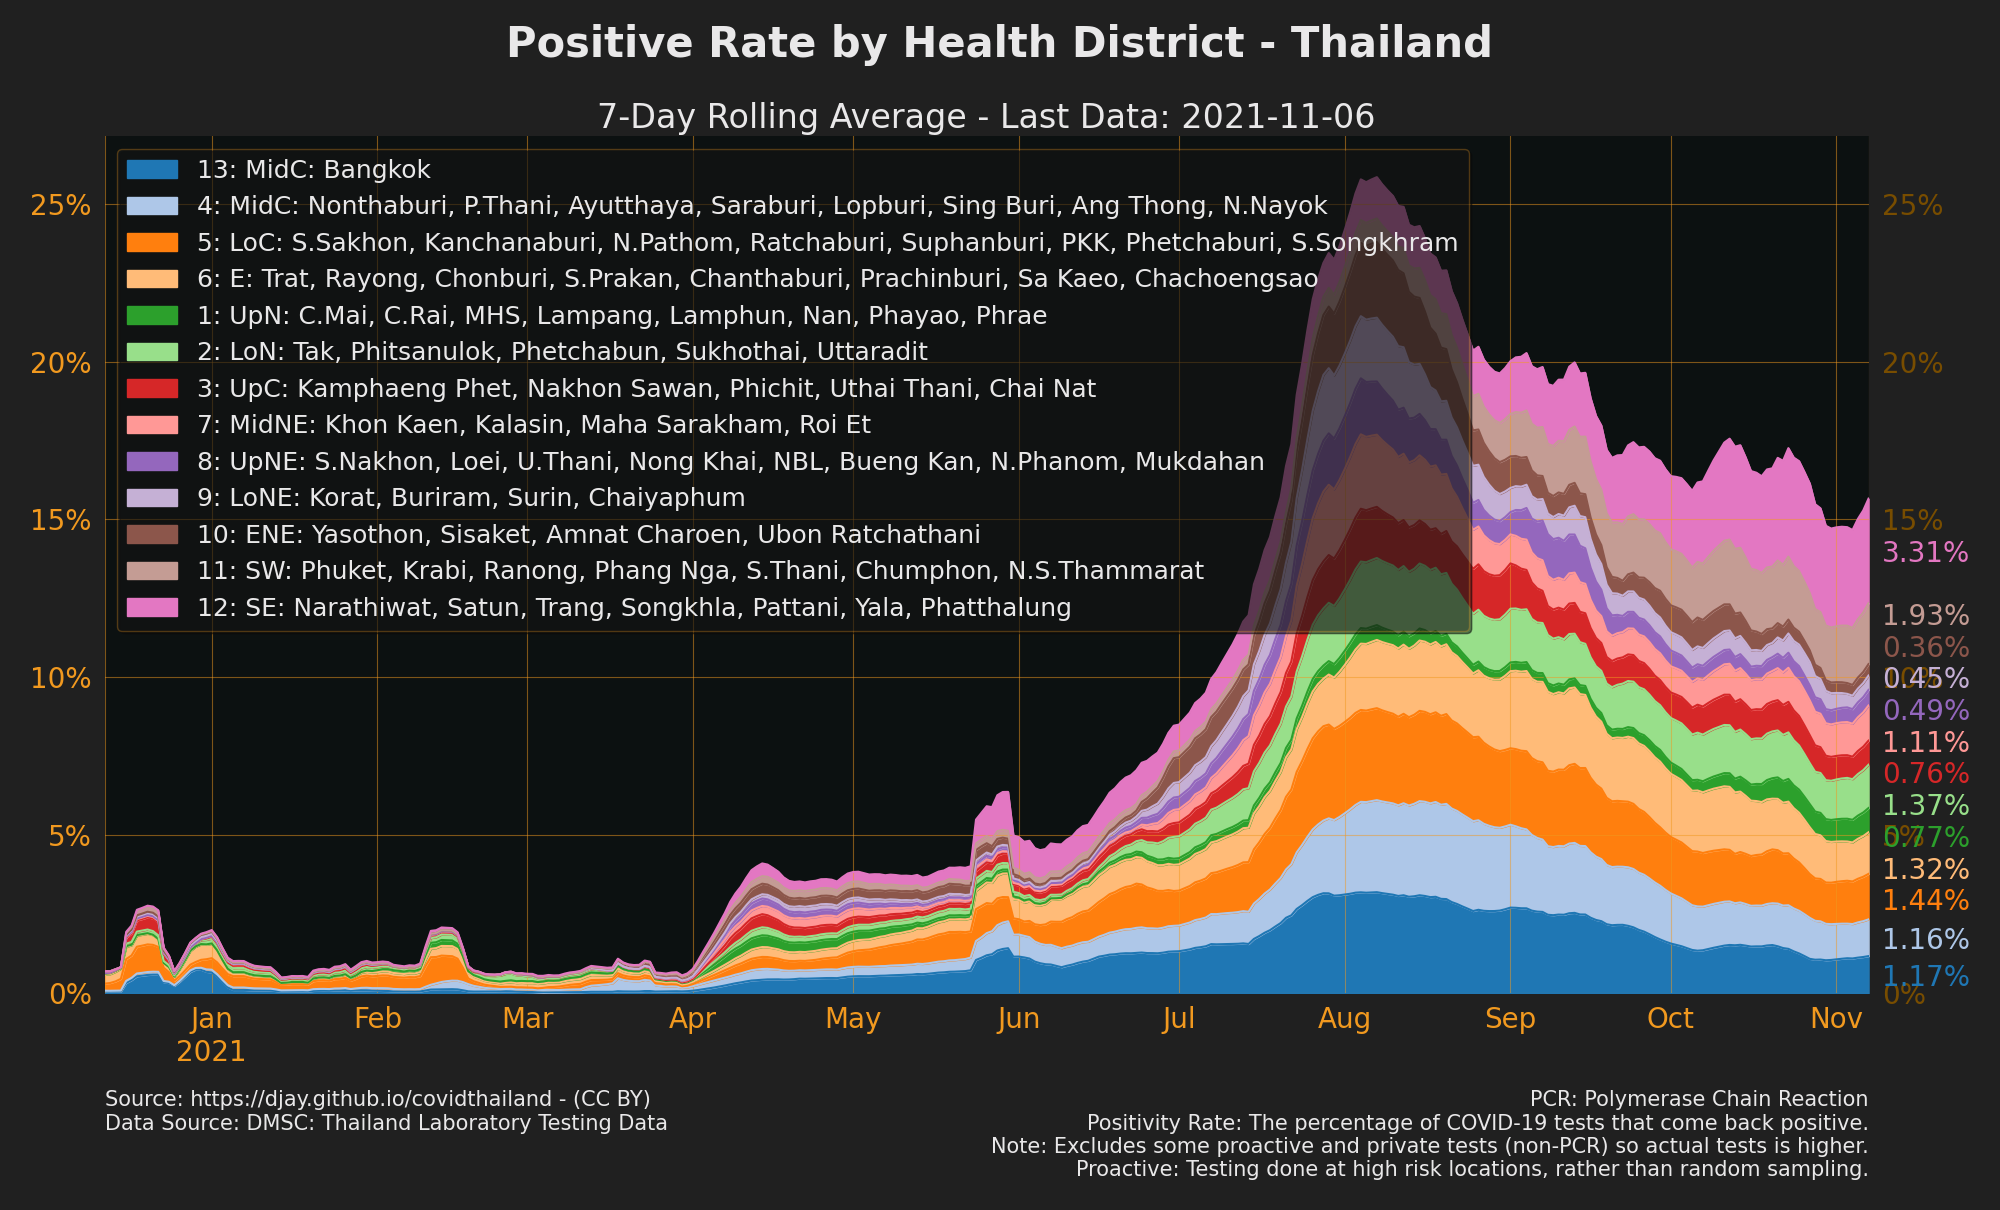
- Shows if all health districts are testing similarly

-
Shows which districts have the highest positive rate
- Sources
- CCSA Daily Briefing - Uploaded ~1-2pm each day
- MOPH COVID 19 Dashboard
- API: Details of all confirmed COVID-19 infections - 1-2 days delayed
- API: Daily Summary of Cases/Deaths/Recovered
- Daily infographics translated and tweeted Updated daily around midday (after gov briefing) - No Longer updated
- Schema:
- Date: e.g "2021-04-06"
- Cases: Total cases that day. (Cases Imported + Cases Local Transmission)
- Cases In Quarantine: "Cases found in quarantine facilities/centers"
- Cases Imported: Cases In Quarantine + Cases outside quarantine
- Cases Proactive: Local transmissions that aren't walk-ins
- Cases Local Transmission: "Cases infected in Thailand". Cases Walkins + Cases Proactive
- Cases Area Prison: Cases reported in prison on this date
- Hospitalized: Total currently in isolation in hospital or field hospital
- Hospitalized Field: Total currently in isolation in field hospitals
- Hospitalized Hospital: total current active cases - anyone confirmed is considered hospitalized currently
- Hospitalized Severe": Currently hospitalised in a severe condition. Unclear what kind of beds this entails.
- Hospitalized Respirator: Current number in severe condition requiring ICU and mechanical ventilator
- Recovered: Number released from hospital/field hospital on this date
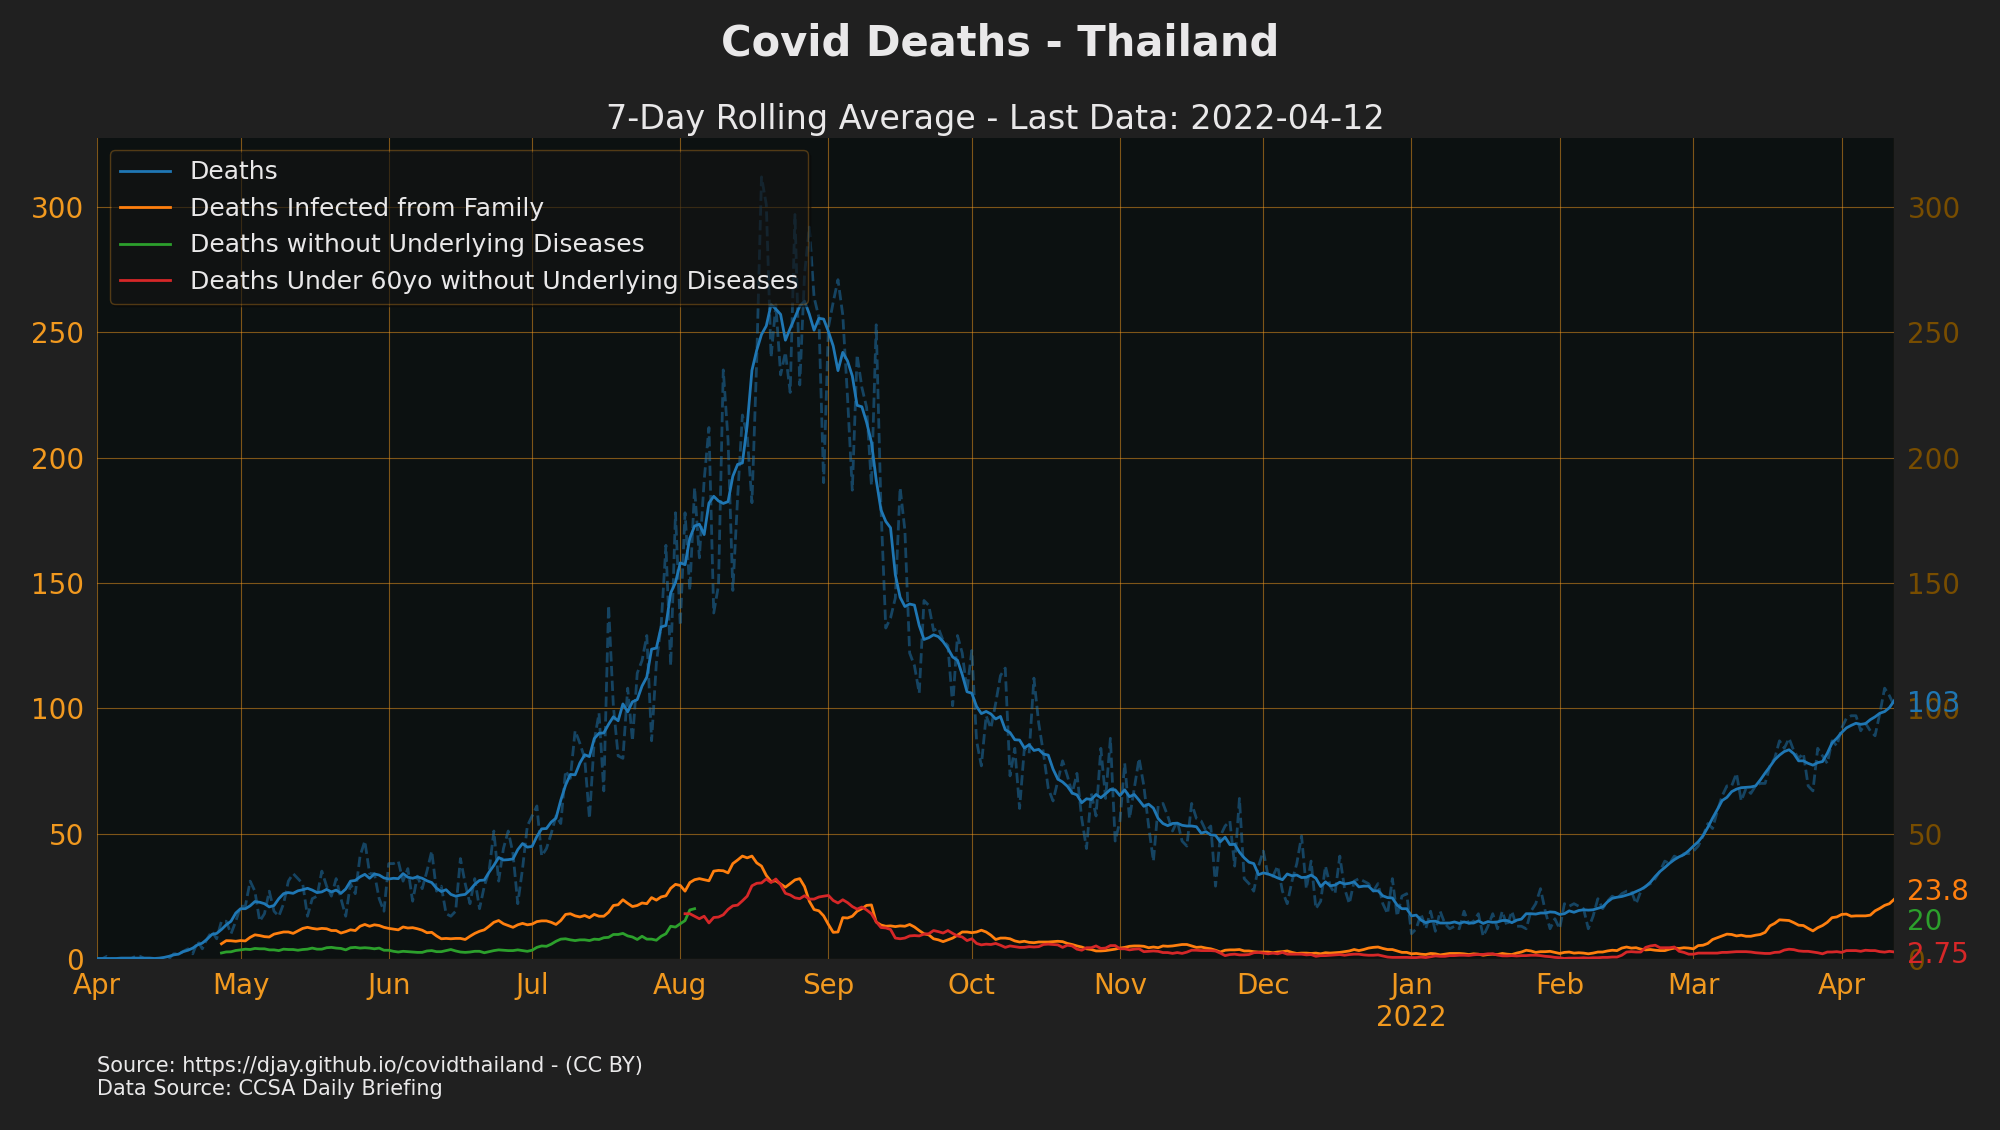
- Deaths: Number of deaths annouced that day
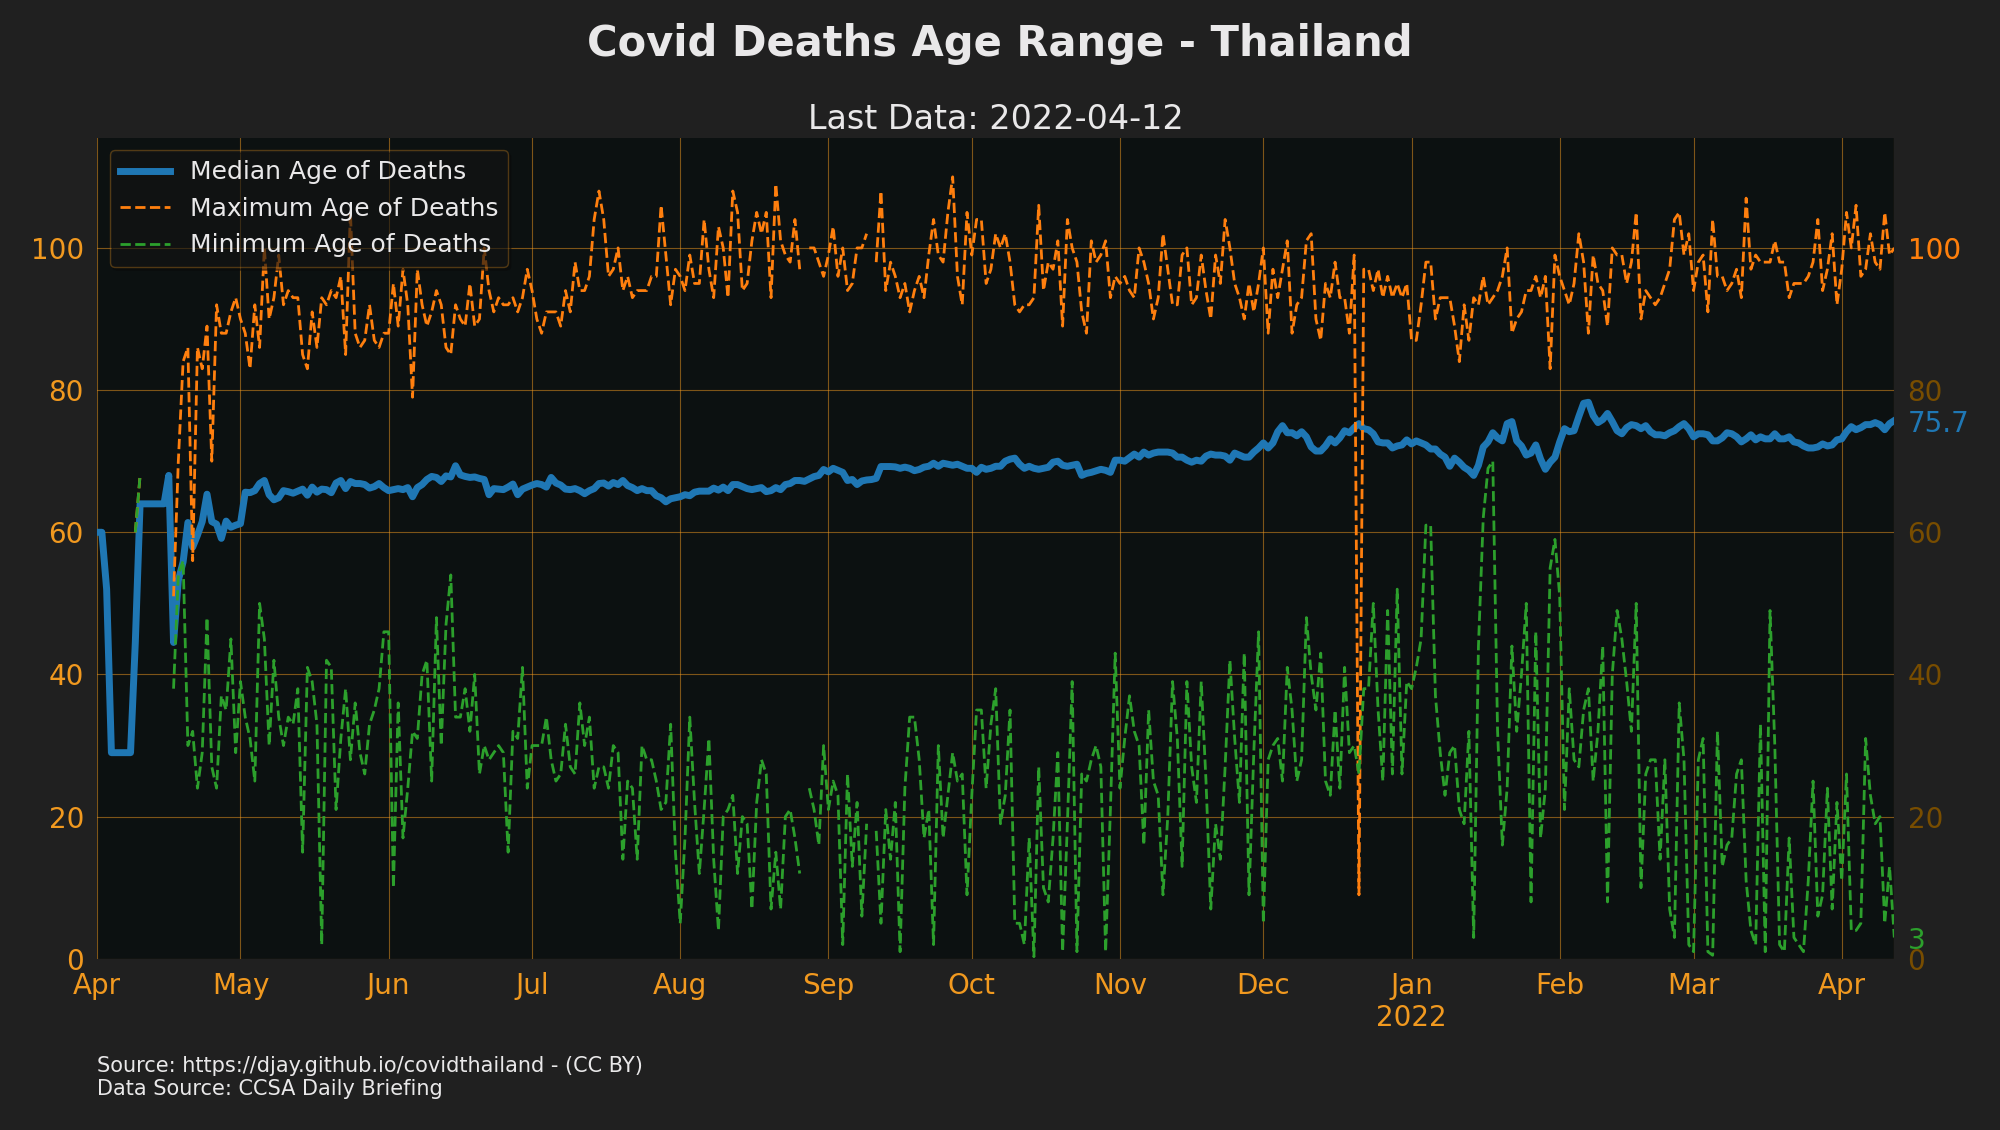
- Deaths Age (Min,Max): Range of ages of those who died
- Deaths Age Median": Median age of those who died
- Deaths Comorbidity None: Deaths where there wasn't a disease that increased risk
- Deaths {Female,Male}: Deaths for 2 of the genders
- Deaths Risk Family: Deaths who likely cause of transmission was via family member
- Source Cases: Tweet, api or briefing the primary information came from
- Fields no longer updated
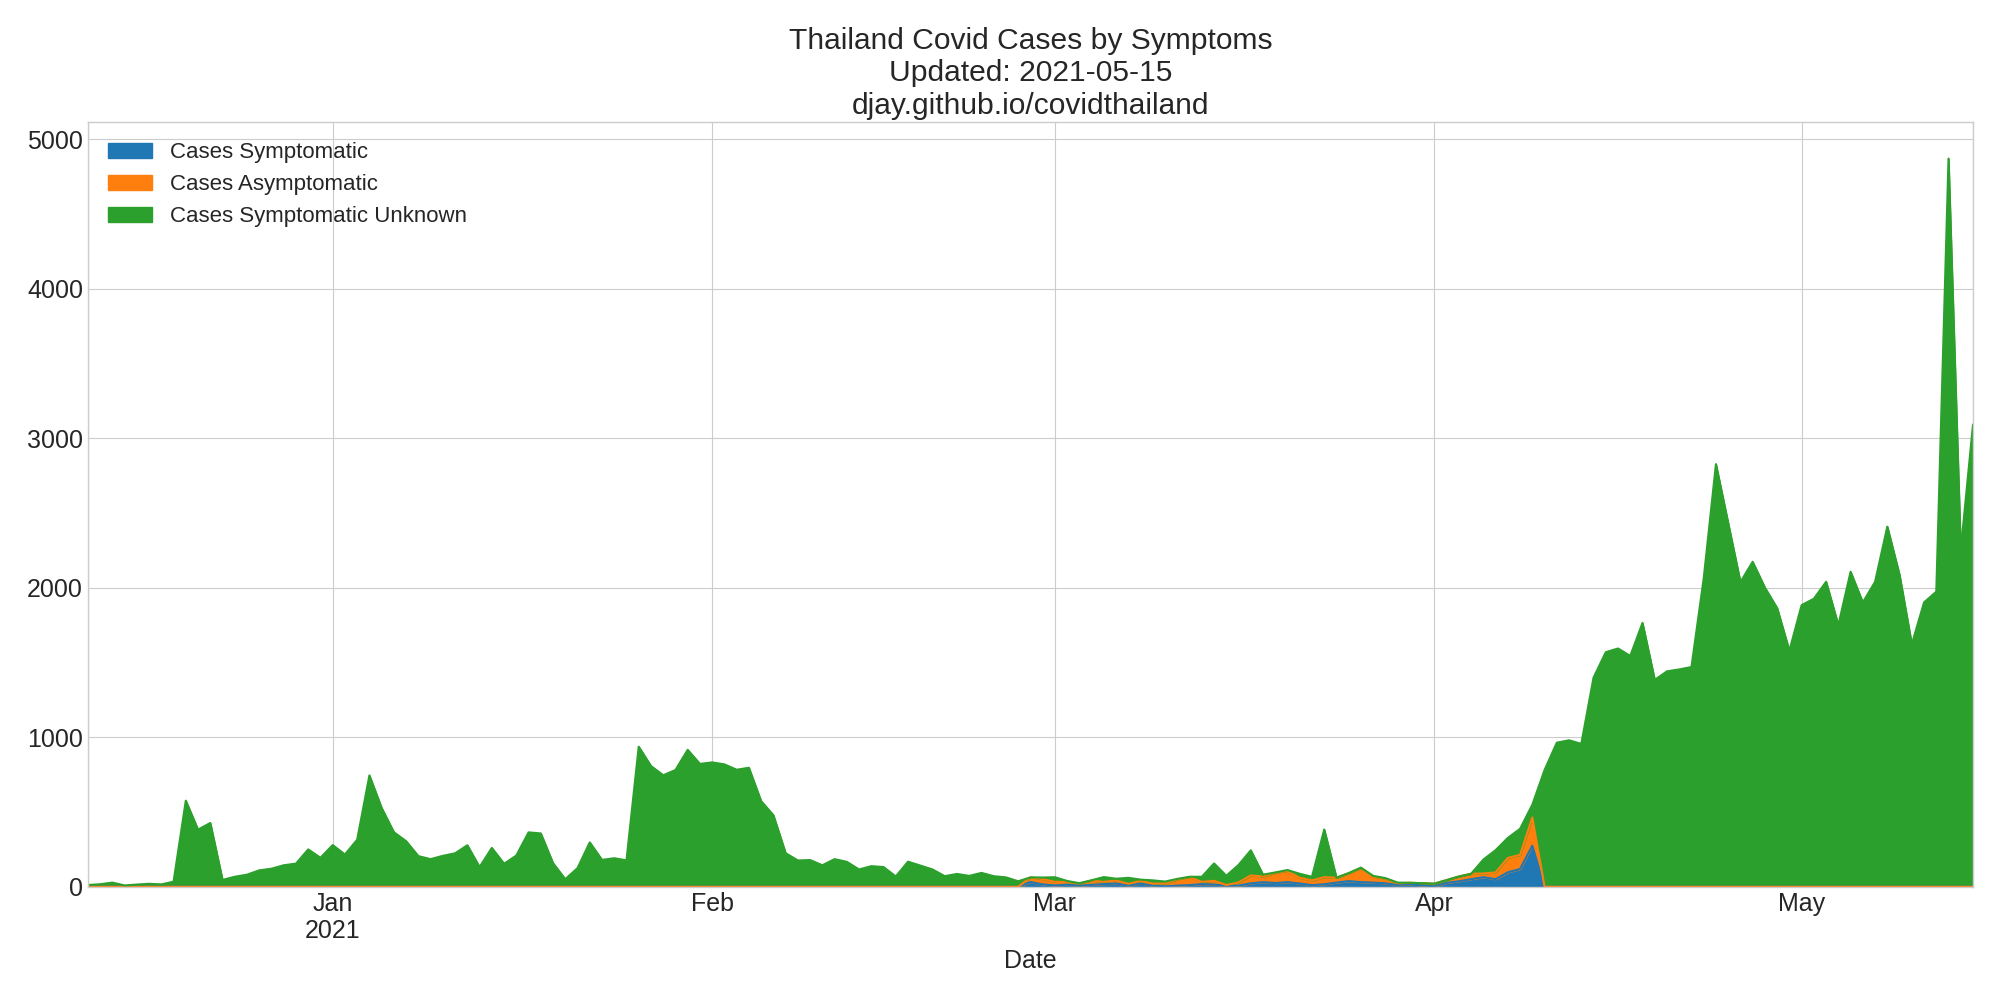
- Cases (Asymptomatic,Symptomatic): - No longer reported in briefing reports
- Schema cases_by_province:
- "Date": e.g "2021-04-06"
- "Province": e.g "Samut Sakhon"
- "Cases": Confirmed cases in this province
- "Health District Number": 1-13 - see Thailand Health Areas
- The following is no longer updated
- "Cases Walkin": Confirmed cases found those requesting tests or asked to from contact tracing or the media. Paid or having met the PUI criteria. No longer updated
- "Cases Proactive": Confirmed cases found government has gone to specific areas to mass test due to high risk of COVID-19. No longer updated
- "Deaths": 31.0
-
Schema cases_by_area:
- "Date": e.g "2021-04-06"
- "Cases Area {1-13}": Confirmed cases in a given Health Area
- "Deaths Area {1-13}": Deaths that day in the health district
- "Cases Risk: {Group} Area {1-13}": Categorisation of Risk field from the covid-19-daily dataset
- The following are no longer updated but have some historical data
- "Cases {Proactive,Walkin} Area {1-13}": Cases found by people where tested
-
Notes:
- Schema:
- e.g
- "Date":"2021-04-27"
- "death_num":149.0,
- "gender":"Male",
- "nationality":"ไทย",
- "age":47.0,
- "Province":"Bangkok"
- Following information is extracted by not properly parsed yet
- "congenital_disease":
- "case_history":
- "risk_factor_sickness":
- "risk_factor_death":
- e.g
- Notes:
- Stopped being published 2021-04-28. Only summary data in cases_by_area is continuing
- Sources MOPH Covid-19 Dashboard
- Schema
- Date
- ATK
- Cases
- Cases Area Prison
- Cases Imported
- Cases Proactive
- Cases Walkin
- Deaths
- Hospitalized
- Hospitalized Field
- Hospitalized Field HICI
- Hospitalized Field Hospitel
- Hospitalized Field Other
- Hospitalized Hospital
- Hospitalized Respirator
- Hospitalized Severe
- Recovered
- Source Cases
- Tests
- Vac Given {1-3} Cum
- Schema
- Date
- ATK
- Cases
- Cases Area Prison
- Cases Imported
- Cases Proactive
- Cases Walkin
- Deaths
- Tests
- Vac Given {1-3} Cum
- Schema
- Date
- Cases Age {'0-9', '10-19', '20-29', '30-39', '40-49', '50-59', '60-69', '70+'}
- Deaths Age {'0-9', '10-19', '20-29', '30-39', '40-49', '50-59', '60-69', '70+'}
- Hospitalized Severe Age {'0-9', '10-19', '20-29', '30-39', '40-49', '50-59', '60-69', '70+'}
Case Types and PUI counts
- Sources:
- MOPH daily situation report PDFs (Updated daily in the evening)
- MOPH daily situation report PDFs (english translations) (Updated a few days later)
- DDC Website - Today's PUI count
-
Schema
- Date: e.g "2021-04-06"
- Cases: Total cases that day. Cases Imported + Cases Local Transmission
- Cases In Quarantine: "Cases found in quarantine facilities/centers"
- Cases Imported: Cases In Quarantine + Cases outside quarantine
- Cases Proactive: Local transmissions that aren't walk-ins
- Cases Local Transmission: "Cases infected in Thailand". Cases Walkins + Cases Proactive
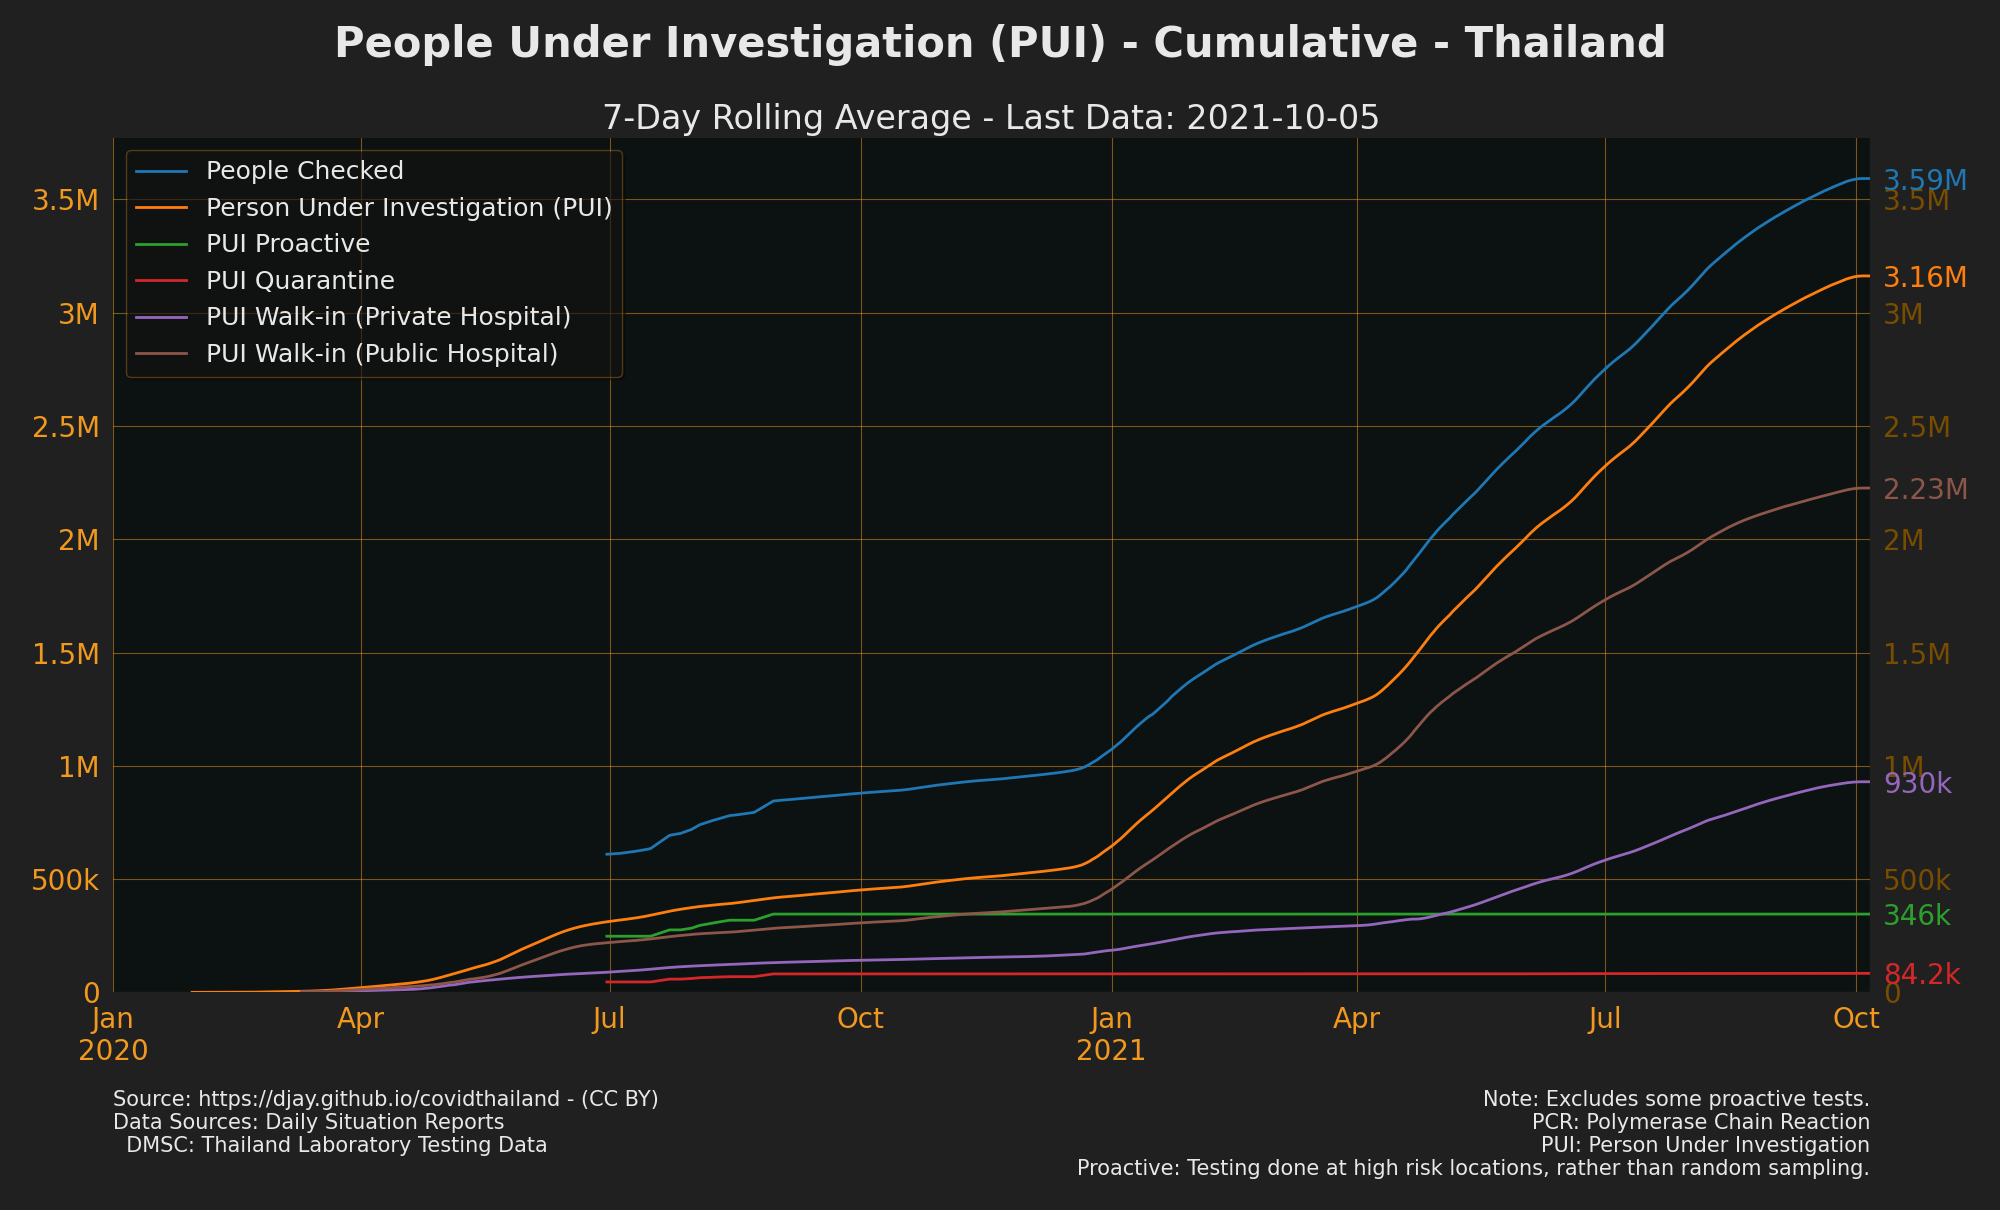
- Tested PUI: People Classified as Person Under Investigation.
- Tested PUI Walkin Public: "Sought medical services on their own at hospitals"/Public
- Tested PUI Walkin Private: "Sought medical services on their own at hospitals"/Private
-
The following are included but are not useful data since 2020-08.
- Tested: Not different from PUI since 2020-08 says "Total number of laboratory tests" but is mislabeled.
- Tested Quarantine: Not changed since 2020-08. "Returnees in quarantine facilities/centers".
- Tested Proactive: Not changed since 2020-08.Tested from "active case finding".
- Tested Not PUI: Not changed since 2020-08. "People who did not meet the PUI criteria".
-
The following aren't yet included
- Screened Ports: "Type of Screened People and PUI / Ports of entry (Airports, ground ports, and seaports)"
- Screened Immigration "Type of Screened People and PUI / People renewing their passports at the Immigration Bureau, Chaeng Watthana"
-
Notes:
- The only useful Tested number is "Tested PUI".
- All the daily numbers have cumulative raw data columns (ending in "Cum") from which the daily numbers are calculated
- except for all the Cases numbers from 2020-11-02 where daily numbers are taken from the reports
- to calculate daily numbers missing data is interpolated
- There are some figures in these reports not included
- Screened Ports: Screened at "Ports of entry"
- Screened Immigration: "People renewing their passports at the Immigration Bureau, Chaeng Watthana"
- Data found in other places e.g.
- Deaths
- Recovered
- Hospitalized
- Source:
- DMSC: Thailand Laboratory testing data - latest report (link at bottom) (updated weekly but sporadic)
- DMSC: Thailand Laboratory testing data - weekly summary reports
- also available via data.go.th testing data
- This datasource is incomplete as not all tests go via this DMSc’co-lab database. In particular times with large amounts of proactive testing sometimes result in more cases reported than positive results.

- Schema:
- Date: e.g "2021-04-06"
- Tests: PCR tests
- Tests Private: PCR tests from private labs
- Pos: Positive result
- Pos Private: Positive result from private labs
- Pos XLS: Tests positive results (includes corrected date-less data)
- Tests XLS: Tests conducted (includes corrected date-less data)
- Notes:
- Uses case history graphs from the latest PPTX
- data seems to exclude some non-PCR tests (likely used in some proactive testing)
- The Test XLS data includes a number of tests and results for which the date is unknown. This has been redistributed into the Pos XLS and Tests XLS numbers. Other than this it
should be the same numbers as
PosandTests.
- Schema:
- Start: e.g "2021-04-06"
- End: e.g "2021-04-13"
- Pos Area {1-13} - Positive test results
- Tests Area {1-13} - Total tests (PCR)
- Notes:
- not all periods are a week
- data seems to exclude non-PCR tests (likely used in some proactive testing)
- There are missing files, so some weeks' data are not shown
- The example graphs shown have been extrapolated using daily totals from the test daily data
- Source:
- Schema e.g.
      "Date":"2021-04-25",
      "Vac Allocated Sinovac {1,2}":3840.0,
      "Vac Allocated AstraZeneca {1,2}":0.0,
      "Vac Delivered": 200.00
      "Vac Given {1,2} Cum":3189.0,
      "Vac Given {1,2} %":83.0,
      "Vac Group Medical Staff {1,2} Cum":1939.0,
      "Vac Group Other Frontline Staff {1,2} Cum":1081.0,
      "Vac Group Over 60 {1,2} Cum":0.0,
      "Vac Group Risk: Disease {1,2} Cum":54.0,
      "Vac Group Risk: Location {1,2} Cum":115.0,
- Note
- The previous data per province is no longer updated in the reports so this download has been removed.
- "Vaccinations Given 1/2 %" refers to the % of allocation, not against population.
- 1/2 refers to shot 1 or shot 2.
- Some days some tables are images so there is missing data.
- Summary vaccination data included in the combine download
- Delivered Vaccines comes from [Track and Traceability Platform]((https://datastudio.google.com/u/0/reporting/731713b6-a3c4-4766-ab9d-a6502a4e7dd6/page/SpZGC)
- #TODO: put in thai group explanations.
-
Source:
-
Schema:
      "Date":"2021-04-25",
      "Province": "Bangkok",
      "Vac Given Cum":3189.0,
      "Vac Given ":83.0,
      "Vac Given {vaccine} Cum":3189.0,
      "Vac Given {vaccine}":83.0,
      "Vac Allocated {vaccine} {1-2}:
      "Vac Group {group} {1-2} Cum: Cumulative vaccines given to particular risk group (dose 1 and 2)
- Source:
- Schema:
- Year: 2012-2021
- Month: 1-12
- Province:
- Gender: Male|Female
- Age: 0-101
- Deaths:
- Source:
- All the above daily sources combined
- plus COVID-19 report, periodic summary
- Schema:
- See all the above for data definitions
Made with python/pandas/matplotlib. Dylan Jay gave a talk on how easy it is to extract data from PDFs and powerpoints and plot data at Bangkok's Monthly ThaiPy Event Video: "How I scraped Thailand's covid data" (1h mark)
Why do this? Originally to answer the question "Was Thailand doing enough testing?" for myself and because 
This work is licensed under a Creative Commons Attribution 4.0 International License.

- Our World in Data: Thailand Profile - the best way to compare against other countries
- Pete Scully: COVID-19 Thailand Public Data for added visualisations and comparisons
- The Researcher Covid Tracker
- Stefano Starita - more excellent analysis and visualisations
- Richard Barrow - maybe the fastest way to get COVID-19 updates in English
- Thai Gov news feeds
- Thai Gov Covid Information: FB - has daily briefing infographics and broadcast (eng and thai) updated quickly
- Thai Gov Spokesman: FB,
- Thai Government PR: FB,
- Ministry of Health: Twitter,
- DMSC PR: FB
- MOPH ArcGIS - PUI + worldwide covid stats
- MOPH OPS Dashboard: ArcGIS - current usage of hospital resource but seems no longer updated (since mid last year?)
- 2021-08-15 - Dashboard parsing for provinces and ages with downloads
- 2021-08-02 - Add ATK cases parsing from dashboard and put in case_types plot
- 2021-07-30 - Add plots for excess deaths
- 2021-07-18 - Add data on vaccines by manufacturer from vaccine slides
- 2021-07-17 - Add estimate of death ages
- 2021-07-13 - Remove import vaccines due to coldchain data being restricted
- 2021-07-10 - Switch province plots to per 100,000
- 2021-07-10 - Put actuals on main case plots
- 2021-06-29 - Use coldchain data to plot deliveries and province vac data
- 2021-06-22 - Add trending provinces for contact cases
- 2021-06-12 - Add vacination daily and improve cumulative vaccinations
- 2021-06-05 - update vaccination reports to parse summary timeline data only (missing source)
- 2021-06-30 - death reasons and hospitalisation critical plots
- 2021-05-21 - Estimate of Infections from Deaths
- 2021-05-18 - Include prisons as seperate province/health district (because briefings do)
- 2021-05-15 - improve highest positive rate plot to show top 5 only.
- 2021-05-10 - parse unofficial RB tweet to get cases and deaths earlier
- 2021-05-07 - add trending up and down provinces for cases
- 2021-05-06 - add top 5 fully vaccinated provinces
- 2021-05-05 - added recovered to active cases
- 2021-05-04 - plots of deaths and vaccinations
- 2021-04-28 - rolling averages on area graphs to make them easier to read
- 2021-04-25 - Add graph of cases by risk and active cases (inc severe)
- 2021-04-25 - Scrape hospitalisation stats from briefing reports
- 2021-04-23 - Fixed mistake in testing data where private tests was added again
- 2021-04-22 - data for sym/asymptomatic and pui private vs pui public
- 2021-04-20 - Added case age plot
- 2021-04-18 - Added clearer positive rate by district plot and made overall positive rate clearer
- 2021-04-15 - Quicker province case type breakdowns from daily briefing reports
- 2021-04-13 - get quicker PUI count from https://ddc.moph.go.th/viralpneumonia/index.php
- 2021-04-12 - Put in "unknown area" for tests and cases by district so totals are correct
- 2021-04-05 - add tweets with province/type break down to get more up to date stats
<style>.github-corner:hover .octo-arm{animation:octocat-wave 560ms ease-in-out}@keyframes octocat-wave{0%,100%{transform:rotate(0)}20%,60%{transform:rotate(-25deg)}40%,80%{transform:rotate(10deg)}}@media (max-width:500px){.github-corner:hover .octo-arm{animation:none}.github-corner .octo-arm{animation:octocat-wave 560ms ease-in-out}}</style>