creating service monitor can only scrape service in monitoring namespace? #2557
Comments
|
I found some references to this in #1921. but still not sure what I should do... |
|
The I saw you used the kube-prometheus stack, which we just a few minutes ago moved to it's own repository: coreos/kube-prometheus. It also has instructions on how to use jsonnet to add extra namespaces to watch, then the RBAC permissions get generated automatically. |
|
@brancz Thank you for response For me, Prometheus cannot detect When I add the same What is wrong? |
|
@aslimacc sorry we don't maintain or use the helm charts, we can't help you with that. |
|
@brancz , I'm also trying to make the Prometheus scrap additional namespaces... Following the README instructions I added additional namespaces to my jsonnet config, like this: But, the generated manifests only create additional Roles and RoleBinds. Should it generate ServiceMonitor objects for each additional namespaces? If not, should I explicitly config my jsonnet to generate ServiceMonitor? How can I do this? I could not find any example... |
|
Typically we let the owners of the namespace decide how they provision the ServiceMonitor within that namespace. If you want to though, you can add another one for example with: ... + {
prometheus+:: {
serviceMonitorKubeScheduler:
{
apiVersion: 'monitoring.coreos.com/v1',
kind: 'ServiceMonitor',
metadata: {
name: 'my-servicemonitor',
namespace: 'my-namespace',
},
spec: {
jobLabel: 'app',
endpoints: [
{
port: 'http-metrics',
},
],
selector: {
matchLabels: {
'app': 'myapp',
},
},
},
},
},
};Would you like to add a PR to add this to the docs of kube-prometheus? 🙂 |
|
Awesome! Sure, I'll do a PR for the README. |
In the **Adding additional namespaces to monitor** section I appended a note showing the need for ServiceMonitor when adding additional namespaces...

see: prometheus-operator/prometheus-operator#2557 (comment)
In the **Adding additional namespaces to monitor** section I appended a note showing the need for ServiceMonitor when adding additional namespaces...

see: prometheus-operator/prometheus-operator#2557 (comment)
|
This issue has been automatically marked as stale because it has not had any activity in last 60d. Thank you for your contributions. |
In the **Adding additional namespaces to monitor** section I appended a note showing the need for ServiceMonitor when adding additional namespaces...

see: prometheus-operator/prometheus-operator#2557 (comment)
In the **Adding additional namespaces to monitor** section I appended a note showing the need for ServiceMonitor when adding additional namespaces...

see: prometheus-operator/prometheus-operator#2557 (comment)
Can you confirm where do you change to ad new namspace in servicemonitor yaml ? i am trying to get Prometheus in default NS to find service pod in other namespace. I can see my SM in prometheus but it still can not discover service under that NS. dev-hih-01/pol-hih-dev-bal-service/0 (0/0 up) |
HI @brancz can you please guide me here on what is needed for proemtheus in default NS to discover pods service in other NS . i can see my SM with NS but it still can not find nay service pods . it only discovers Labels in other NS . |
|
You should be able to use the |
Thanks i have serviceMonitorNamespaceSelector: {} in my Prometheus object , on RBAC roles do i need to define SA clusterrole and cluserrolebinding , but how do i tell Prometheus to use this new Role for Service monitor ? |
|
you need to bind it against the serviceaccount used by the Prometheus server. |
|
great thanks
On Tuesday, 10 September 2019, 13:50:20 WEST, Frederic Branczyk <notifications@github.com> wrote:
you need to bind it against the serviceaccount used by the Prometheus server.
—
You are receiving this because you commented.
Reply to this email directly, view it on GitHub, or mute the thread.
|
|
Thanks this now works
On Tuesday, 10 September 2019, 13:50:20 WEST, Frederic Branczyk <notifications@github.com> wrote:
you need to bind it against the serviceaccount used by the Prometheus server.
—
You are receiving this because you commented.
Reply to this email directly, view it on GitHub, or mute the thread.
|
@brancz , i am trying to monitor our external sies with blackboxexporter, i have added servicemonitor for it but Prometheus is scraping blackboxexporter service podso nly and not the real targets . am i missing anything , the prometheus shows blackbox as UP though |
|
blackbox showing up is correct, the blackbox exporter is up, and reporting blackbox metrics about what you're probing |
|
This issue has been automatically marked as stale because it has not had any activity in last 60d. Thank you for your contributions. |
|
Regarding this guidance:
I'm confused by something: If the |
|
The namespaceSelector in the ServiceMonitor is an artifact of when ServiceMonitors had to be created in the same namespace as the Prometheus object. I recommend to not use it, as in new versions of the API we would probably not include it anymore. |
Firstly, thanks for all the hard work putting this together @brancz . Just wanted to say that the namespaceSelector is very useful in cases where we create many similar services across multiple namespaces (e.g. each customer gets it's own namespace). This let's us deploy just one serviceMonitor, instead of 100s, unless I'm misunderstanding here. |
Yes. If you define your service monitor to have namespaceSelector like this it will look in all namespaces: Or you can define a list like this: |
|
This issue has been automatically marked as stale because it has not had any activity in last 60d. Thank you for your contributions. |
|
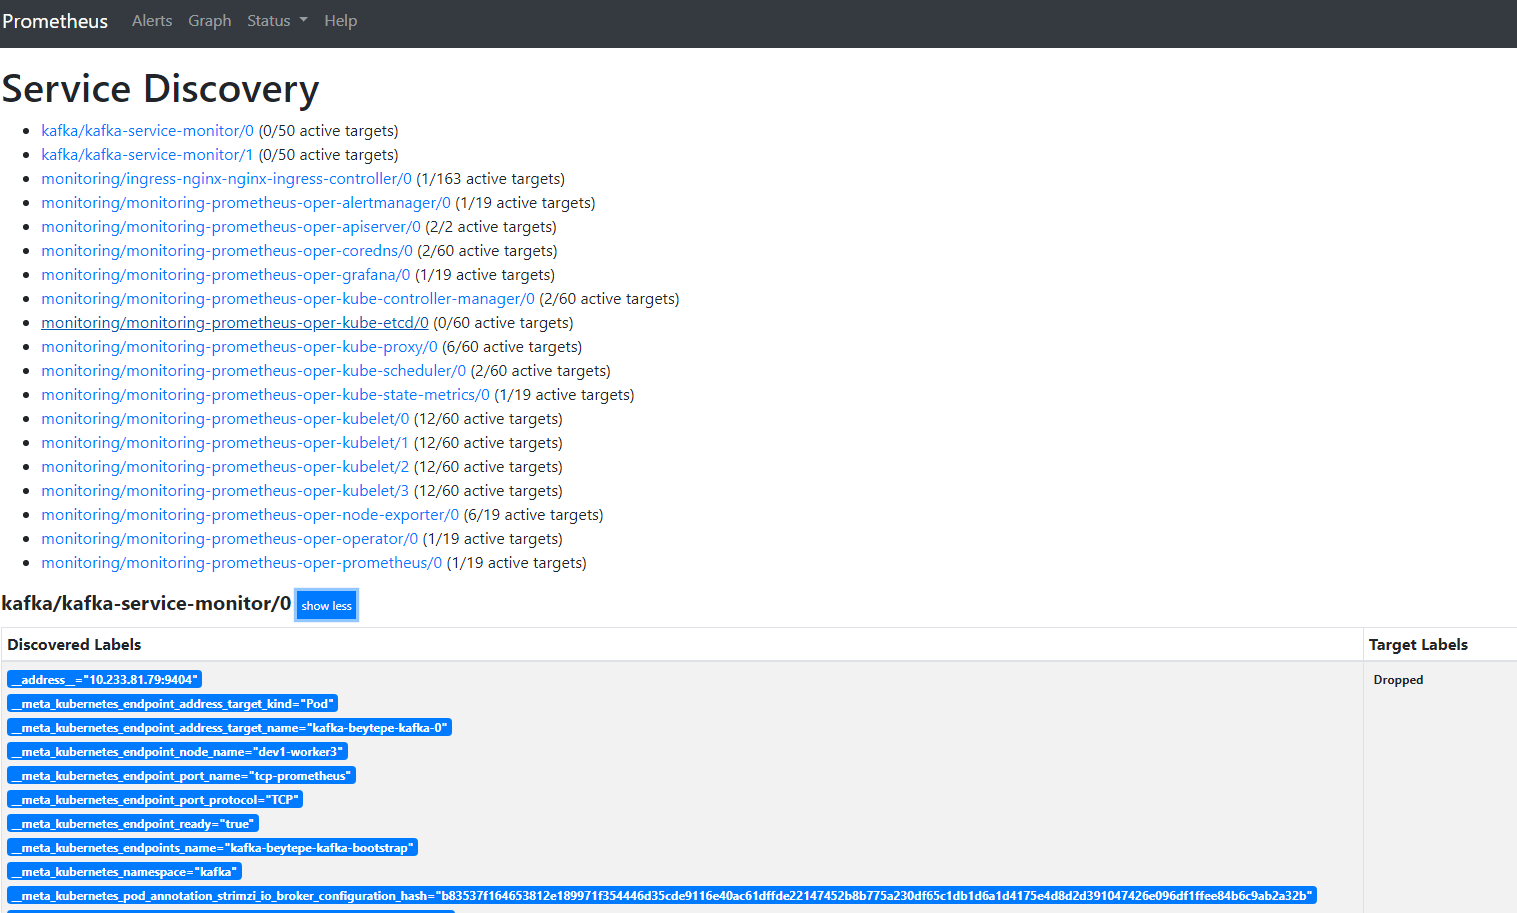
@afirth @aceeric I have the same/similar problem. I've a Prometheus and prometheus-operator under namespace=monitoring and another prometheus instance under namespace=kafka . I used manifests provided by Strimzi. My Kafka is installed by Strimzi and I would like to monitor strimzi-kafka resources in namespace=kafka from namespace=monitoring. ...but prometheus in namespace=monitoring cannot scrape servicemonitor in namespace=kafka. I deleted servicemonitor in namespace=kafka and installed servicemonitor namespace=monitoring, nothing changed. I deleted namespaceselector, nothing changed. I set namespaceselector as following... ...nothing changed. prometheus-operator logs don't say anything. All I see the same screens:
Were you able to monitor Strimzi kafka resources from outside of namespace=kafka ? Could you please advise how can I accomplish this task? Thanks & Regards |

|
The original question was answered by @brancz some time ago (along with lots of other related ones, thanks!), and could probably be closed. |
I created a test project on github here.
When I create deployment and service in the monitoring namespace, then created the service monitor as following
Operator picked up the service monitor and I saw the following configuration in Prometheus dashboard.
Everything seems to be fine, Prometheus scrapes my metrics endpoints and I can then see the data in the dashboard. So it appears that my deployment and service configuration are wired up correctly.
However, if I create deployment and service in my own project namespace, and then create the same service monitor, my pod does not receive any scraping requests. I checked the configuration, it's the same as before:
Is the above configuration correct? Is this a bug in the Operator?
Also, I found that if I create the service monitor in my own project namespace, Operator does not detect it and no changes are made to Prometheus configuration. Is this the intended behavior?
The text was updated successfully, but these errors were encountered: