Skip to content
New issue

Have a question about this project? Sign up for a free GitHub account to open an issue and contact its maintainers and the community.

By clicking “Sign up for GitHub”, you agree to our terms of service and privacy statement. We’ll occasionally send you account related emails.

Already on GitHub? Sign in to your account

labels.Labels: reduce memory by storing as a single string #10991

Merged
merged 3 commits into from Feb 22, 2023

Conversation

bboreham
Copy link
Member

@bboreham bboreham commented Jul 6, 2022

This commit adds an alternate implementation for labels.Labels, behind a build tag stringlabels.

Doc with background info: link.

This builds on #11717, which created abstractions to let code access labels.Labels without knowing the internals.

The new data structure is held as a single string, containing all label/values like this:

    [len][name0][len][value0][len][name1][len][value1]...

The lengths are varint encoded so usually a single byte.

The previous structure using []Label had 24 bytes of overhead for the slice and 16 for each label name and value; this one has 16 bytes overhead plus 1 for each name and value.

(I previously published this idea on prometheus-developers. ).

In Labels.Overwrite() and Labels.Hash() we use an unsafe conversion from string to byte slice. Overwrite is explicitly unsafe, while in Hash this is purely to change the type so we can use the faster implementation.

As expected, benchmarks show some speedups and some slowdowns. We are trading more CPU in a few cases for less in most cases and smaller overall heap size. I think I can squeeze a bit more out of this design though.

Some notable improvements:

Labels_Hash/typical_labels_under_1KB-8                                                                          
128ns ± 0%         61ns ± 0%   -52.24%  (p=1.000 n=1+1)
RangeQuery/expr=rate(a_ten[1m])_+_rate(b_ten[1m]),steps=1000-8                                                 
4.56ms ± 0%       3.23ms ± 0%   -29.15%  (p=1.000 n=1+1)
LoadWAL/batches=100,seriesPerBatch=1000,samplesPerSeries=480,exemplarsPerSeries=24,mmappedChunkT=3800-8         
481MB ± 0%        388MB ± 0%   -19.51%  (p=1.000 n=1+1)

Full set (only run once before/after since they take 40 minutes): https://gist.github.com/bboreham/53626dde3a5f7cf732a23c1a745435fd

@bboreham bboreham changed the title Labels as string labels.Labels: reduce memory by storing as a single string Jul 6, 2022
@codesome
Copy link
Member

codesome commented Jul 6, 2022

hooray-letsgo

@codesome
Copy link
Member

codesome commented Jul 6, 2022

/prombench main

@prombot
Copy link
Contributor

prombot commented Jul 6, 2022

⏱️ Welcome to Prometheus Benchmarking Tool. ⏱️

Compared versions: PR-10991 and main

After successful deployment, the benchmarking metrics can be viewed at:

Other Commands:
To stop benchmark: /prombench cancel
To restart benchmark: /prombench restart main

@prymitive
Copy link
Contributor

prymitive commented Jul 6, 2022

I tried to test this patch to see what kind of memory savings it could give me but soon after startup I got this panic:
(possibly due to a query filtering by a non-existient label?)

runtime error: slice bounds out of range [-11:]" stacktrace="goroutine 666554 [running]:
github.com/prometheus/prometheus/promql.(*evaluator).recover(0xc82cd2c120, 0xc66bf0e3b8, 0xc66bf0e3a8)
/src/promql/engine.go:950 +0x28f
panic({0x2d985e0, 0xccfa92f8c0})
/usr/local/go/src/runtime/panic.go:838 +0x207
github.com/prometheus/prometheus/model/labels.marshalLabelToSizedBuffer(0xc4b4a26420?, {0xcc69cd8500?, 0x39884f0?, 0x128?})
/src/model/labels/labels.go:720 +0x1b1
github.com/prometheus/prometheus/model/labels.marshalLabelsToSizedBuffer({0xc4b4a26400, 0x214b9?, 0x1f975?}, {0xcc69cd8500, 0x100, 0x128})
/src/model/labels/labels.go:711 +0x57
github.com/prometheus/prometheus/model/labels.(*SimpleBuilder).Overwrite(0xc00236f068, 0xc8250db528)
/src/model/labels/labels.go:847 +0xb3
github.com/prometheus/prometheus/tsdb/index.(*Decoder).Series(0xc00236f060, {0x7ec8a4b33841?, 0x37b1f840?, 0x10?}, 0xc000401c00?, 0xc8250db510)
/src/tsdb/index/index.go:1877 +0x2be
github.com/prometheus/prometheus/tsdb/index.(*Reader).Series(0xc00065ee40, 0x37b1f84, 0x0?, 0x2?)
/src/tsdb/index/index.go:1620 +0x127
github.com/prometheus/prometheus/tsdb.blockIndexReader.Series({{0x39a50b8?, 0xc00065ee40?}, 0xc002f38780?}, 0xc66bf0bff8?, 0x40d9a7?, 0x405000000000010?)
/src/tsdb/block.go:476 +0x55
github.com/prometheus/prometheus/tsdb.(*blockBaseSeriesSet).Next(0xc8250db4a0)
/src/tsdb/querier.go:445 +0x90
github.com/prometheus/prometheus/storage.(*genericMergeSeriesSet).Next(0xc82cd2c180)
/src/storage/merge.go:335 +0x288
github.com/prometheus/prometheus/storage.(*lazyGenericSeriesSet).Next(0x0?)
/src/storage/lazy.go:25 +0x68
github.com/prometheus/prometheus/storage.(*genericMergeSeriesSet).Next(0xc82cd2c1e0)
/src/storage/merge.go:335 +0x288
github.com/prometheus/prometheus/storage.(*lazyGenericSeriesSet).Next(0xcd5e0e40f0?)
/src/storage/lazy.go:25 +0x68
github.com/prometheus/prometheus/promql.expandSeriesSet({0x3997058, 0xc66aea9e30}, {0x3997bb8, 0xc79ce53260})
/src/promql/engine.go:893 +0x82
github.com/prometheus/prometheus/promql.checkAndExpandSeriesSet({0x3997058?, 0xc66aea9e30?}, {0x3997838?, 0xc756af7200})
/src/promql/engine.go:885 +0x78
github.com/prometheus/prometheus/promql.(*evaluator).eval(0xc82cd2c120, {0x3997838?, 0xc756af7200?})
/src/promql/engine.go:1542 +0x405
github.com/prometheus/prometheus/promql.(*evaluator).rangeEval(0xc82cd2c120, 0xc66bf0e300, 0xc66bf0e2d0, {0xc66bf0e190, 0x2, 0x0?})
/src/promql/engine.go:1034 +0x18f7
github.com/prometheus/prometheus/promql.(*evaluator).eval(0xc82cd2c120, {0x3997608?, 0xc82cd2c000?})
/src/promql/engine.go:1255 +0x4f6f
github.com/prometheus/prometheus/promql.(*evaluator).Eval(0x181b030d800?, {0x3997608?, 0xc82cd2c000?})
/src/promql/engine.go:965 +0xa7
github.com/prometheus/prometheus/promql.(*Engine).execEvalStmt(0xc001c06380, {0x3997058, 0xc66aea9a40}, 0xc64ef038f0, 0xc63cf429b0)
/src/promql/engine.go:696 +0xc97
github.com/prometheus/prometheus/promql.(*Engine).exec(0xc001c06380, {0x3997058, 0xc66aea9a40}, 0xc64ef038f0)
/src/promql/engine.go:595 +0x58a
github.com/prometheus/prometheus/promql.(*query).Exec(0xc64ef038f0, {0x3997058, 0xc66aea9920})
/src/promql/engine.go:197 +0x1f5
github.com/prometheus/prometheus/web/api/v1.(*API).queryRange(0xc002249cc0, 0xc9556ce200)
/src/web/api/v1/api.go:494 +0xe11
github.com/prometheus/prometheus/web/api/v1.(*API).Register.func2.1(0x398aa60?)
/src/web/api/v1/api.go:313 +0x14d
github.com/prometheus/prometheus/web/api/v1.(*API).Register.func1.1({0x398aa60, 0xc6636608c0}, 0x7f0780081590?)
/src/web/api/v1/api.go:288 +0x85
net/http.HandlerFunc.ServeHTTP(0x7f0780081590?, {0x398aa60?, 0xc6636608c0?}, 0xc63cf42960?)
/usr/local/go/src/net/http/server.go:2084 +0x2f
github.com/prometheus/prometheus/util/httputil.CompressionHandler.ServeHTTP({{0x3980820?, 0xc001738810?}}, {0x7f0780081590?, 0xc63cf42960?}, 0x397f600?)
/src/util/httputil/compression.go:91 +0x69
github.com/prometheus/prometheus/web.(*Handler).testReady.func1({0x7f0780081590?, 0xc63cf42960?}, 0x7f0780081500?)
/src/web/web.go:533 +0x39
net/http.HandlerFunc.ServeHTTP(0x7f0780081590?, {0x7f0780081590?, 0xc63cf42960?}, 0x66b36f?)
/usr/local/go/src/net/http/server.go:2084 +0x2f
github.com/prometheus/client_golang/prometheus/promhttp.InstrumentHandlerResponseSize.func1({0x7f0780081590?, 0xc63cf42910?}, 0xc9556ce200)
/home/builder/go/pkg/mod/github.com/prometheus/client_golang@v1.12.2/prometheus/promhttp/instrument_server.go:239 +0xc5
net/http.HandlerFunc.ServeHTTP(0x14e1090?, {0x7f0780081590?, 0xc63cf42910?}, 0xc66aea9710?)
/usr/local/go/src/net/http/server.go:2084 +0x2f
github.com/prometheus/client_golang/prometheus/promhttp.InstrumentHandlerDuration.func2({0x7f0780081590, 0xc63cf42910}, 0xc9556ce200)
/home/builder/go/pkg/mod/github.com/prometheus/client_golang@v1.12.2/prometheus/promhttp/instrument_server.go:84 +0xbf
net/http.HandlerFunc.ServeHTTP(0x3996ca0?, {0x7f0780081590?, 0xc63cf42910?}, 0x7f07a7951fe8?)
/usr/local/go/src/net/http/server.go:2084 +0x2f
github.com/prometheus/client_golang/prometheus/promhttp.InstrumentHandlerCounter.func1({0x3996ca0?, 0xcbc2eeff80?}, 0xc9556ce200)
/home/builder/go/pkg/mod/github.com/prometheus/client_golang@v1.12.2/prometheus/promhttp/instrument_server.go:117 +0xaa
github.com/prometheus/prometheus/web.setPathWithPrefix.func1.1({0x3996ca0, 0xcbc2eeff80}, 0xccd5c7ff00)
/src/web/web.go:792 +0x290
github.com/prometheus/common/route.(*Router).handle.func1({0x3996ca0, 0xcbc2eeff80}, 0xccd5c7fd00, {0x0, 0x0, 0xc8b7c672f5?})
/home/builder/go/pkg/mod/github.com/prometheus/common@v0.35.0/route/route.go:83 +0x2ae
github.com/julienschmidt/httprouter.(*Router).ServeHTTP(0xc000618180, {0x3996ca0, 0xcbc2eeff80}, 0xccd5c7fd00)
/home/builder/go/pkg/mod/github.com/julienschmidt/httprouter@v1.3.0/router.go:387 +0x82b
github.com/prometheus/common/route.(*Router).ServeHTTP(0x3996fb0?, {0x3996ca0?, 0xcbc2eeff80?}, 0x2031af?)
/home/builder/go/pkg/mod/github.com/prometheus/common@v0.35.0/route/route.go:126 +0x26
net/http.StripPrefix.func1({0x3996ca0, 0xcbc2eeff80}, 0xccd5c7fb00)
/usr/local/go/src/net/http/server.go:2127 +0x330
net/http.HandlerFunc.ServeHTTP(0xc6bc376c60?, {0x3996ca0?, 0xcbc2eeff80?}, 0xc5de5236c8?)
/usr/local/go/src/net/http/server.go:2084 +0x2f
net/http.(*ServeMux).ServeHTTP(0x3997058?, {0x3996ca0, 0xcbc2eeff80}, 0xccd5c7fb00)
/usr/local/go/src/net/http/server.go:2462 +0x149
go.opentelemetry.io/contrib/instrumentation/net/http/otelhttp.(*Handler).ServeHTTP(0xc00224e000, {0x3995560?, 0xcc55a8db20}, 0xccd5c7f500)
/home/builder/go/pkg/mod/go.opentelemetry.io/contrib/instrumentation/net/http/otelhttp@v0.32.0/handler.go:191 +0xd11
github.com/prometheus/prometheus/web.withStackTracer.func1({0x3995560?, 0xcc55a8db20?}, 0xc79ce52e80?)
/src/web/web.go:104 +0x97
net/http.HandlerFunc.ServeHTTP(0x0?, {0x3995560?, 0xcc55a8db20?}, 0x40d645?)
/usr/local/go/src/net/http/server.go:2084 +0x2f
net/http.serverHandler.ServeHTTP({0x3987870?}, {0x3995560, 0xcc55a8db20}, 0xccd5c7f500)
/usr/local/go/src/net/http/server.go:2916 +0x43b
net/http.(*conn).serve(0xc66aec0140, {0x3997058, 0xc000b965d0})
/usr/local/go/src/net/http/server.go:1966 +0x5d7
created by net/http.(*Server).Serve
/usr/local/go/src/net/http/server.go:3071 +0x4db

@bboreham
Copy link
Member Author

bboreham commented Jul 6, 2022

@prymitive thanks for that; somehow the buffer it's trying to use is too small.
Anything you can tell me about the query being executed when it crashed?

@prymitive
Copy link
Contributor

@prymitive thanks for that; somehow the buffer it's trying to use is too small. Anything you can tell me about the query being executed when it crashed?

Sadly no, all I got was panics in the logs with multiple different indexes in the slice bounds out of range error, no idea which queries caused it.

@roidelapluie
Copy link
Member

roidelapluie commented Jul 6, 2022 via email

@prymitive
Copy link
Contributor

The query executed is printed on the next startup when Prometheus reads the active query logging Le mer. 6 juil. 2022, 18:46, Łukasz Mierzwa @.> a écrit :

@prymitive https://github.com/prymitive thanks for that; somehow the buffer it's trying to use is too small. Anything you can tell me about the query being executed when it crashed? Sadly no, all I got was panics in the logs with multiple different indexes in the slice bounds out of range error, no idea which queries caused it. — Reply to this email directly, view it on GitHub <#10991 (comment)>, or unsubscribe https://github.com/notifications/unsubscribe-auth/AACHHJUJDFKEDEDPTNEGL7LVSWZ65ANCNFSM52ZXDLTQ . You are receiving this because you are subscribed to this thread.Message ID: @.
>

Prometheus never crashed, panic was recovered.
I will try to debug it more tomorrow.

@bboreham
Copy link
Member Author

bboreham commented Jul 6, 2022

Prometheus never crashed, panic was recovered.

That seems like a good opportunity for improvement. If a panic reaches the http handler then log the query.

Separately, can you say if this was the first panic? If not can you post the stack trace for that one?

@codesome
Copy link
Member

codesome commented Jul 7, 2022

Prombench results: There seems to be roughly 10% savings in RSS. Querying is similar, but a little more expensive in the prepare_time (which is where we get the samples from TSDB). The inner_eval, where most of the operations happen, is pretty much same. The different doesn't look concerning at the moment.

/prombench cancel

@codesome
Copy link
Member

codesome commented Jul 7, 2022

/prombench cancel

@prombot
Copy link
Contributor

prombot commented Jul 7, 2022

Benchmark cancel is in progress.

@prymitive
Copy link
Contributor

I've added patch from #10995 and I see a few panics in logs.
They all seem to have range queries.
Here's an example:

component="query engine"
msg="runtime panic in parser"
expr="round(sum by(colo_name, interface) (increase(traffic_manager_local_interface_reactor_action_successful[30d]))) > 3"
err="runtime error: slice bounds out of range [-27:]"
stacktrace="goroutine 18108 [running]:
github.com/prometheus/prometheus/promql.(*evaluator).recover(0xc74ac63f80, {0x3997620, 0xc67660fac0}, 0xc3a33f0800, 0xc3a33f07f0)
	/src/promql/engine.go:950 +0x2a6
panic({0x2d985e0, 0xc2cc8bb818})
	/usr/local/go/src/runtime/panic.go:838 +0x207
github.com/prometheus/prometheus/model/labels.marshalLabelToSizedBuffer(0xc3c6cd5e20?, {0xc7007cdd10?, 0x44faf2?, 0xe3?})
	/src/model/labels/labels.go:720 +0x1b1
github.com/prometheus/prometheus/model/labels.marshalLabelsToSizedBuffer({0xc3c6cd5e00, 0x20ec2?, 0xc300020c58?}, {0xc7007cdd10, 0xe3, 0xe3})
	/src/model/labels/labels.go:711 +0x57
github.com/prometheus/prometheus/model/labels.(*SimpleBuilder).Overwrite(0xc007480a88, 0xc3a551b5d8)
	/src/model/labels/labels.go:847 +0xb3
github.com/prometheus/prometheus/tsdb/index.(*Decoder).Series(0xc007480a80, {0x7ed35b445cd1?, 0x6da28cd0?, 0x7e419d46efff?}, 0x7e419d374f00?, 0xc3a551b5c0)
	/src/tsdb/index/index.go:1877 +0x2be
github.com/prometheus/prometheus/tsdb/index.(*Reader).Series(0xc006d8acc0, 0x6da28cd, 0x7e41b0180c70?, 0x2?)
	/src/tsdb/index/index.go:1620 +0x127
github.com/prometheus/prometheus/tsdb.blockIndexReader.Series({{0x39a5098?, 0xc006d8acc0?}, 0xc004423680?}, 0x2343d6f?, 0x40d9a7?, 0x6040000002031b8?)
	/src/tsdb/block.go:476 +0x55
github.com/prometheus/prometheus/tsdb.(*blockBaseSeriesSet).Next(0xc3a551b550)
	/src/tsdb/querier.go:445 +0x90
github.com/prometheus/prometheus/storage.(*genericMergeSeriesSet).Next(0xc760f32120)
	/src/storage/merge.go:335 +0x288
github.com/prometheus/prometheus/storage.(*lazyGenericSeriesSet).Next(0x0?)
	/src/storage/lazy.go:25 +0x68
github.com/prometheus/prometheus/storage.(*genericMergeSeriesSet).Next(0xc760f32300)
	/src/storage/merge.go:335 +0x288
github.com/prometheus/prometheus/storage.(*lazyGenericSeriesSet).Next(0xc3a33ec1c8?)
	/src/storage/lazy.go:25 +0x68
github.com/prometheus/prometheus/promql.expandSeriesSet({0x3997038, 0xc183a9dda0}, {0x3997b98, 0xc1d75d4260})
	/src/promql/engine.go:893 +0x82
github.com/prometheus/prometheus/promql.checkAndExpandSeriesSet({0x3997038?, 0xc183a9dda0?}, {0x3997818?, 0xc6bd6c8a00})
	/src/promql/engine.go:885 +0x78
github.com/prometheus/prometheus/promql.checkAndExpandSeriesSet({0x3997038?, 0xc183a9dda0?}, {0x3997690?, 0xc156da4080?})
	/src/promql/engine.go:880 +0xf6
github.com/prometheus/prometheus/promql.(*evaluator).eval(0xc74ac63f80, {0x3997658?, 0xc3b574edb0?})
	/src/promql/engine.go:1344 +0x247b
github.com/prometheus/prometheus/promql.(*evaluator).rangeEval(0xc74ac63f80, 0xc3a33ee198, 0xc3a33ee168, {0xc3a33ee028, 0x2, 0x0?})
	/src/promql/engine.go:1034 +0x18f7
github.com/prometheus/prometheus/promql.(*evaluator).eval(0xc74ac63f80, {0x39975e8?, 0xc74ac63aa0?})
	/src/promql/engine.go:1255 +0x4f6f
github.com/prometheus/prometheus/promql.(*evaluator).rangeEval(0xc74ac63f80, 0x0, 0xc3a33ef2e0, {0xc392a49d40, 0x1, 0x0?})
	/src/promql/engine.go:1034 +0x18f7
github.com/prometheus/prometheus/promql.(*evaluator).eval(0xc74ac63f80, {0x3997658?, 0xc3b574ede0?})
	/src/promql/engine.go:1319 +0x2289
github.com/prometheus/prometheus/promql.(*evaluator).rangeEval(0xc74ac63f80, 0x0, 0xc3a33f0430, {0xc3a33f04f8, 0x2, 0x0?})
	/src/promql/engine.go:1034 +0x18f7
github.com/prometheus/prometheus/promql.(*evaluator).eval(0xc74ac63f80, {0x3997620?, 0xc67660fac0?})
	/src/promql/engine.go:1523 +0x14f2
github.com/prometheus/prometheus/promql.(*evaluator).Eval(0x181d85aa4d0?, {0x3997620?, 0xc67660fac0?})
	/src/promql/engine.go:965 +0xc5
github.com/prometheus/prometheus/promql.(*Engine).execEvalStmt(0xc001cb6080, {0x3997038, 0xc3b574ef30}, 0xc151e1a310, 0xc156d9e1e0)
	/src/promql/engine.go:645 +0x4fe
github.com/prometheus/prometheus/promql.(*Engine).exec(0xc001cb6080, {0x3997038, 0xc3b574ef30}, 0xc151e1a310)
	/src/promql/engine.go:595 +0x58a
github.com/prometheus/prometheus/promql.(*query).Exec(0xc151e1a310, {0x3997038, 0xc3b574ed50})
	/src/promql/engine.go:197 +0x1f5
github.com/prometheus/prometheus/rules.EngineQueryFunc.func1({0x3997038, 0xc3b574ed50}, {0xc6f5e21980?, 0xc3a33f0e18?}, {0x2384738?, 0x0?, 0x0?})
	/src/rules/manager.go:193 +0x7c
github.com/prometheus/prometheus/rules.(*AlertingRule).Eval(0xc3ad39d1e0, {0x3997038, 0xc3b574ed50}, {0x396de62?, 0x181d8517e14?, 0x0?}, 0xc0021e23e0, 0xc000e3a120, 0x0)
	/src/rules/alerting.go:328 +0xfe
github.com/prometheus/prometheus/rules.(*Group).Eval.func1({0x3997038, 0xc1e29e1c20}, 0xc3aea702d0, {0xc0b024f600?, 0xc0b024f600?, 0x0?}, 0xc3a33f1c68, 0x6, {0x39a7ce0, 0xc3ad39d1e0})
	/src/rules/manager.go:625 +0x457
github.com/prometheus/prometheus/rules.(*Group).Eval(0xc3aea702d0, {0x3997038, 0xc1e29e1c20}, {0x396de62?, 0xc000101678?, 0x0?})
	/src/rules/manager.go:710 +0x20d
github.com/prometheus/prometheus/rules.(*Group).run.func1()
	/src/rules/manager.go:363 +0x11b
github.com/prometheus/prometheus/rules.(*Group).run(0xc3aea702d0, {0x3996fc8, 0xc000050070})
	/src/rules/manager.go:400 +0x455
github.com/prometheus/prometheus/rules.(*Manager).Update.func1(0xc3c2d59b00?)
	/src/rules/manager.go:1010 +0xaf
created by github.com/prometheus/prometheus/rules.(*Manager).Update
	/src/rules/manager.go:1000 +0x3ad
"

@prymitive
Copy link
Contributor

Running a range query for traffic_manager_local_interface_reactor_action_successful over past 30d returns a list of time series and they're not all present over that time, that's about it really.

@prymitive
Copy link
Contributor

prymitive commented Jul 7, 2022

Adding some debug logs with:

@@ -717,6 +719,9 @@ func marshalLabelsToSizedBuffer(lbls []Label, data []byte) int {
 func marshalLabelToSizedBuffer(m *Label, data []byte) int {
        i := len(data)
        i -= len(m.Value)
+       if i < 0 {
+               fmt.Printf("BUG! marshalLabelToSizedBuffer(m.name=%q m.value=%q, data=%q) i=%d\n", m.Name, m.Value, string(data), i)
+       }
        copy(data[i:], m.Value)
        i = encodeSize(data, i, len(m.Value))
        i -= len(m.Name)

I get this:

BUG! marshalLabelToSizedBuffer(m.name="probe" m.value="interface", data="\x00\x00") i=-7

@prymitive
Copy link
Contributor

prymitive commented Jul 7, 2022

@@ -708,6 +709,15 @@ func (b *Builder) Labels() Labels {
 func marshalLabelsToSizedBuffer(lbls []Label, data []byte) int {
        i := len(data)
        for index := len(lbls) - 1; index >= 0; index-- {
+               if len(lbls[index].Value) > len(data[:i]) {
+                       fmt.Printf(`*** BUG! ***
+  marshalLabelsToSizedBuffer(lbls=%v data=%q)
+  index=%d
+  lbls[%d].Name=%q lbls[%d].Value=%q
+  data[:%d]=%q
+*** END ***
+`, lbls, data, index, index, lbls[index].Name, index, lbls[index].Value, index, data[:i])
+               }
                size := marshalLabelToSizedBuffer(&lbls[index], data[:i])
                i -= size
        }

and captured some more debug data

 *** BUG! ***
   marshalLabelsToSizedBuffer(lbls=[{__name__ network_snmp_interface_utilisation_percent} {colo_id 28} {__name__ jobs_backup_resume_completed} {colo_id 28} {colo_name sea01} {colo_name sea01} {instance 28m295} {direction in} {instance sw07.sea02} {job netwatcher} {job cockroachdb} {name port-channel103} {node_status v} {probe interface} {region wnam} {snmp_oid ifHCInOctets} {snmpid 369098854}] data="\x00\x00\x00\x00\x00\x00\x00\x00\x00\x00\x00\x00\x00\x00\x00\x00\x00\x00\x00\x00\x00\x00\x00\x00\x00\x00\x00\x00\x00\x00\x00\x00\x00\x00\x00\acolo_id\x0228\b__name__\x1cjobs_backup_resume_completed\acolo_id\x0228\tcolo_name\x05sea01\tcolo_name\x05sea01\binstance\x0628m295\tdirection\x02in\binstance\nsw07.sea02\x03job\nnetwatcher\x03job\vcockroachdb\x04name\x0fport-channel103\vnode_status\x01v\x05probe\tinterface\x06region\x04wnam\bsnmp_oid\fifHCInOctets\x06snmpid\t369098854")
   index=0
   lbls[0].Name="__name__" lbls[0].Value="network_snmp_interface_utilisation_percent"
   data[:0]="\x00\x00\x00\x00\x00\x00\x00\x00\x00\x00\x00\x00\x00\x00\x00\x00\x00\x00\x00\x00\x00\x00\x00\x00\x00\x00\x00\x00\x00\x00\x00\x00\x00\x00\x00"
 *** END ***
*** BUG! ***
  marshalLabelsToSizedBuffer(lbls=[{__name__ node_disk_written_bytes_total} {colo_id 28} {colo_name sea01} {device nvme0n1} {instance 28dm6} {__name__ logfwdr_stream_builder_dropped_total} {job node_exporter} {alert_level none} {node_type dm} {colo_id 28} {region wnam} {colo_name sea01} {instance 28m542}] data="\x00\x00\x00\x00\x00\x00\x00\acolo_id\x0228\tcolo_name\x05sea01\x06device\anvme0n1\binstance\x0528dm6\b__name__$logfwdr_stream_builder_dropped_total\x03job\rnode_exporter\valert_level\x04none\tnode_type\x02dm\acolo_id\x0228\x06region\x04wnam\tcolo_name\x05sea01\binstance\x0628m542")
  index=0
  lbls[0].Name="__name__" lbls[0].Value="node_disk_written_bytes_total"
  data[:0]="\x00\x00\x00\x00\x00\x00\x00"
*** END ***

@bboreham
Copy link
Member Author

bboreham commented Jul 9, 2022

I see a few panics in logs.

New theory: the problem is concurrent use of this SimpleBuilder. The size of the buffer is calculated with one set of labels, then the labels change on another goroutine, and now the buffer is not big enough.

[side-note: I don't think there is a unit test of concurrent queries]

The Decoder is embedded in an index.Reader which I am reasonably sure is shared across multiple concurrent queries.

First thought is to move the stateful SimpleBuilder into the iterator-like structure which in the case of your panic is blockBaseSeriesSet. However this implies changing the signature of the Series method to pass the SimpleBuilder.

Taking a more lateral approach, I can change Labels from a string to a []byte, then use that as the "building" state as Series did before with the []Labels slice. This is disappointing because it makes all Labels 8 bytes bigger for just this one case.

Maybe I'll try both.

@bboreham
Copy link
Member Author

I managed to recreate the race I theorised in previous message in a unit test, and moved the state into blockBaseSeriesSet which makes the report go away.

Unfortunately the new test seems to run out of memory at CircleCI. I tried reducing the concurrency from 10 to 4 but it still gets "signal: killed". Maybe I can experiment with smaller data sets.

@prymitive if you can re-test that'd be great.

@prymitive
Copy link
Contributor

prymitive commented Jul 11, 2022

I did deploy it to the same test server and, so far, I don't see any panics, so it does look like the issue is resolved.

I've also captured heap pprof on 2.36.0 (+ #10782 & #10709 patches) vs main+this patch.

v2.36.0

Showing nodes accounting for 36.67GB, 70.86% of 51.75GB total
Dropped 643 nodes (cum <= 0.26GB)
Showing top 10 nodes out of 90
      flat  flat%   sum%        cum   cum%
    6.80GB 13.14% 13.14%     6.80GB 13.14%  github.com/prometheus/prometheus/model/labels.(*Builder).Labels
    6.22GB 12.02% 25.16%    10.12GB 19.56%  github.com/prometheus/prometheus/tsdb/record.(*Decoder).Series
    5.27GB 10.19% 35.35%     5.27GB 10.19%  github.com/prometheus/prometheus/tsdb/chunkenc.NewXORChunk
    4.53GB  8.76% 44.11%     6.06GB 11.72%  github.com/prometheus/prometheus/tsdb.newMemSeries
    3.96GB  7.66% 51.76%     3.96GB  7.66%  github.com/prometheus/prometheus/tsdb/encoding.(*Decbuf).UvarintStr (inline)
    2.79GB  5.39% 57.15%     2.79GB  5.39%  github.com/prometheus/prometheus/model/textparse.(*PromParser).Metric
    1.94GB  3.74% 60.89%     1.94GB  3.74%  github.com/prometheus/prometheus/model/labels.NewBuilder
    1.74GB  3.36% 64.25%     1.74GB  3.36%  github.com/prometheus/prometheus/scrape.(*scrapeCache).addRef
    1.72GB  3.32% 67.57%     1.72GB  3.32%  github.com/prometheus/prometheus/tsdb/index.(*MemPostings).Delete
    1.70GB  3.29% 70.86%     1.70GB  3.29%  github.com/klauspost/compress/flate.(*dictDecoder).init

this patch:

Showing nodes accounting for 26.65GB, 65.24% of 40.85GB total
Dropped 658 nodes (cum <= 0.20GB)
Showing top 10 nodes out of 89
      flat  flat%   sum%        cum   cum%
    4.30GB 10.52% 10.52%     5.82GB 14.24%  github.com/prometheus/prometheus/tsdb.newMemSeries
    3.77GB  9.23% 19.75%     3.77GB  9.23%  github.com/prometheus/prometheus/model/labels.(*SimpleBuilder).Labels
    3.23GB  7.91% 27.65%     3.23GB  7.91%  github.com/prometheus/prometheus/model/labels.appendLabelTo
    3.07GB  7.52% 35.17%     3.07GB  7.52%  github.com/prometheus/prometheus/model/textparse.(*PromParser).Metric
    2.94GB  7.19% 42.36%     2.94GB  7.19%  github.com/prometheus/prometheus/tsdb/chunkenc.NewXORChunk
    2.33GB  5.70% 48.06%     5.57GB 13.63%  github.com/prometheus/prometheus/model/labels.(*Builder).Labels
    1.86GB  4.55% 52.61%     1.86GB  4.55%  github.com/prometheus/prometheus/scrape.(*scrapeCache).addRef
    1.81GB  4.44% 57.05%     1.81GB  4.44%  compress/flate.(*dictDecoder).init
    1.71GB  4.19% 61.24%     1.71GB  4.19%  github.com/prometheus/prometheus/tsdb/index.(*MemPostings).Delete
    1.63GB  4.00% 65.24%     1.63GB  4.00%  github.com/prometheus/prometheus/scrape.(*scrapeCache).trackStaleness

Please do note that this was just a quick test, both instances didn't have much uptime, so memory usage might be different over longer time. But overall total memory usage did seem to drop.
I'll try to deploy this patch on top of our 2.36.0 build to track long(er) term usage and stability.

@prymitive
Copy link
Contributor

Somehow external_labels are missing from /api/v1/status/config response, as if marshaling to JSON didn't work properly.

@prymitive
Copy link
Contributor

This is go alloc size (avg_over_time(go_memstats_alloc_bytes[30m])) on a test instance. We have:

image

Had to revert because problem with external_labels mentioned above breaks thanos - it tries to read external_labels from config via the API but gets nothing so it exits.

@bboreham
Copy link
Member Author

Somehow external_labels are missing from /api/v1/status/config response, as if marshaling to JSON didn't work properly.

I fixed a flaw with marshalling to YAML, which I think you meant.
Also added a test for JSON.

@prymitive
Copy link
Contributor

Thanks! I can confirm that it fixed external_labels issue

@prymitive
Copy link
Contributor

prymitive commented Jul 13, 2022

I've deployed this patch to two instances today, that's on top of v2.37.0-rc1 (+ #10782 & #10709 patches since we have those on top of current v2.36.0). It's working fine after a few hours so I'll keep those two instance running this patch.
Comparing go allocation bytes between these two shows a decent drop.

  • 94 -> 76GB (peak) for instance with 26.8M time series
  • 56 -> 46GB (peak) for instance with 16.4M time series

That's about 18-20% less, which is amazing.

image
image

@prymitive
Copy link
Contributor

FYI both instances are working perfectly fine and memory usage reduction is looking great.
26.8M time series instance:
image

Can't assume nil is a valid value.

Signed-off-by: Bryan Boreham <bjboreham@gmail.com>
bboreham and others added 2 commits February 22, 2023 15:34
This commit adds an alternate implementation for `labels.Labels`, behind
a build tag `stringlabels`.

Instead of storing label names and values as individual strings, they
are all concatenated into one string in this format:

    [len][name0][len][value0][len][name1][len][value1]...

The lengths are varint encoded so usually a single byte.

The previous `[]string` had 24 bytes of overhead for the slice and 16
for each label name and value; this one has 16 bytes overhead plus 1
for each name and value.

In `ScratchBuilder.Overwrite` and `Labels.Hash` we use an unsafe
conversion from string to byte slice. `Overwrite` is explicitly unsafe,
but for `Hash` this is a pure performance hack.

Signed-off-by: Bryan Boreham <bjboreham@gmail.com>
This checks that no code is assuming things about `labels.Labels` which
don't work with the alternate implementation.

Co-authored-by: Julien Pivotto <roidelapluie@o11y.eu>
Signed-off-by: Bryan Boreham <bjboreham@gmail.com>
@bboreham bboreham marked this pull request as ready for review February 22, 2023 15:35
@bboreham
Copy link
Member Author

With @roidelapluie assistance I have made the suggested change, so the new code is available with a build tag stringlabels, and CI runs tests with that tag to check nothing breaks.

I broke out #12014 but the same commit is included in this PR.

@roidelapluie roidelapluie merged commit 666f61a into prometheus:main Feb 22, 2023
@roidelapluie
Copy link
Member

Thanks!

@codesome
Copy link
Member

Amazing! How do we plan to handle releases for this? Will the release binary have these new labels implementation used?

@roidelapluie
Copy link
Member

So, now we know that tests pass with this. I propose we keep CI running with this for this release cycle. In the meantime, it would be great to see if we can find users to use a prometheus release (or mimir or thanos) built with this version and this tag (it would be easier if we first release this).

In the release after the next release, if it is positive for the testers, we replace the original implementation with the new one.

@bboreham
Copy link
Member Author

I looked through the release instructions and Makefile, but I didn't see a way to set Go tags.

promu will apply tags listed in its config; would we create an alternate copy of that to do the alternate build?

@bboreham
Copy link
Member Author

bboreham commented Mar 2, 2023

Update: I built a Docker image under my own account, and have been running it in a dev environment for the past 3 days.
This suggested some further optimisation - #12048, #12084

Updated image including the optimisations: docker pull bboreham/prometheus:a74d803f9-amd64-stringlabels

@djluck
Copy link

djluck commented Mar 20, 2023

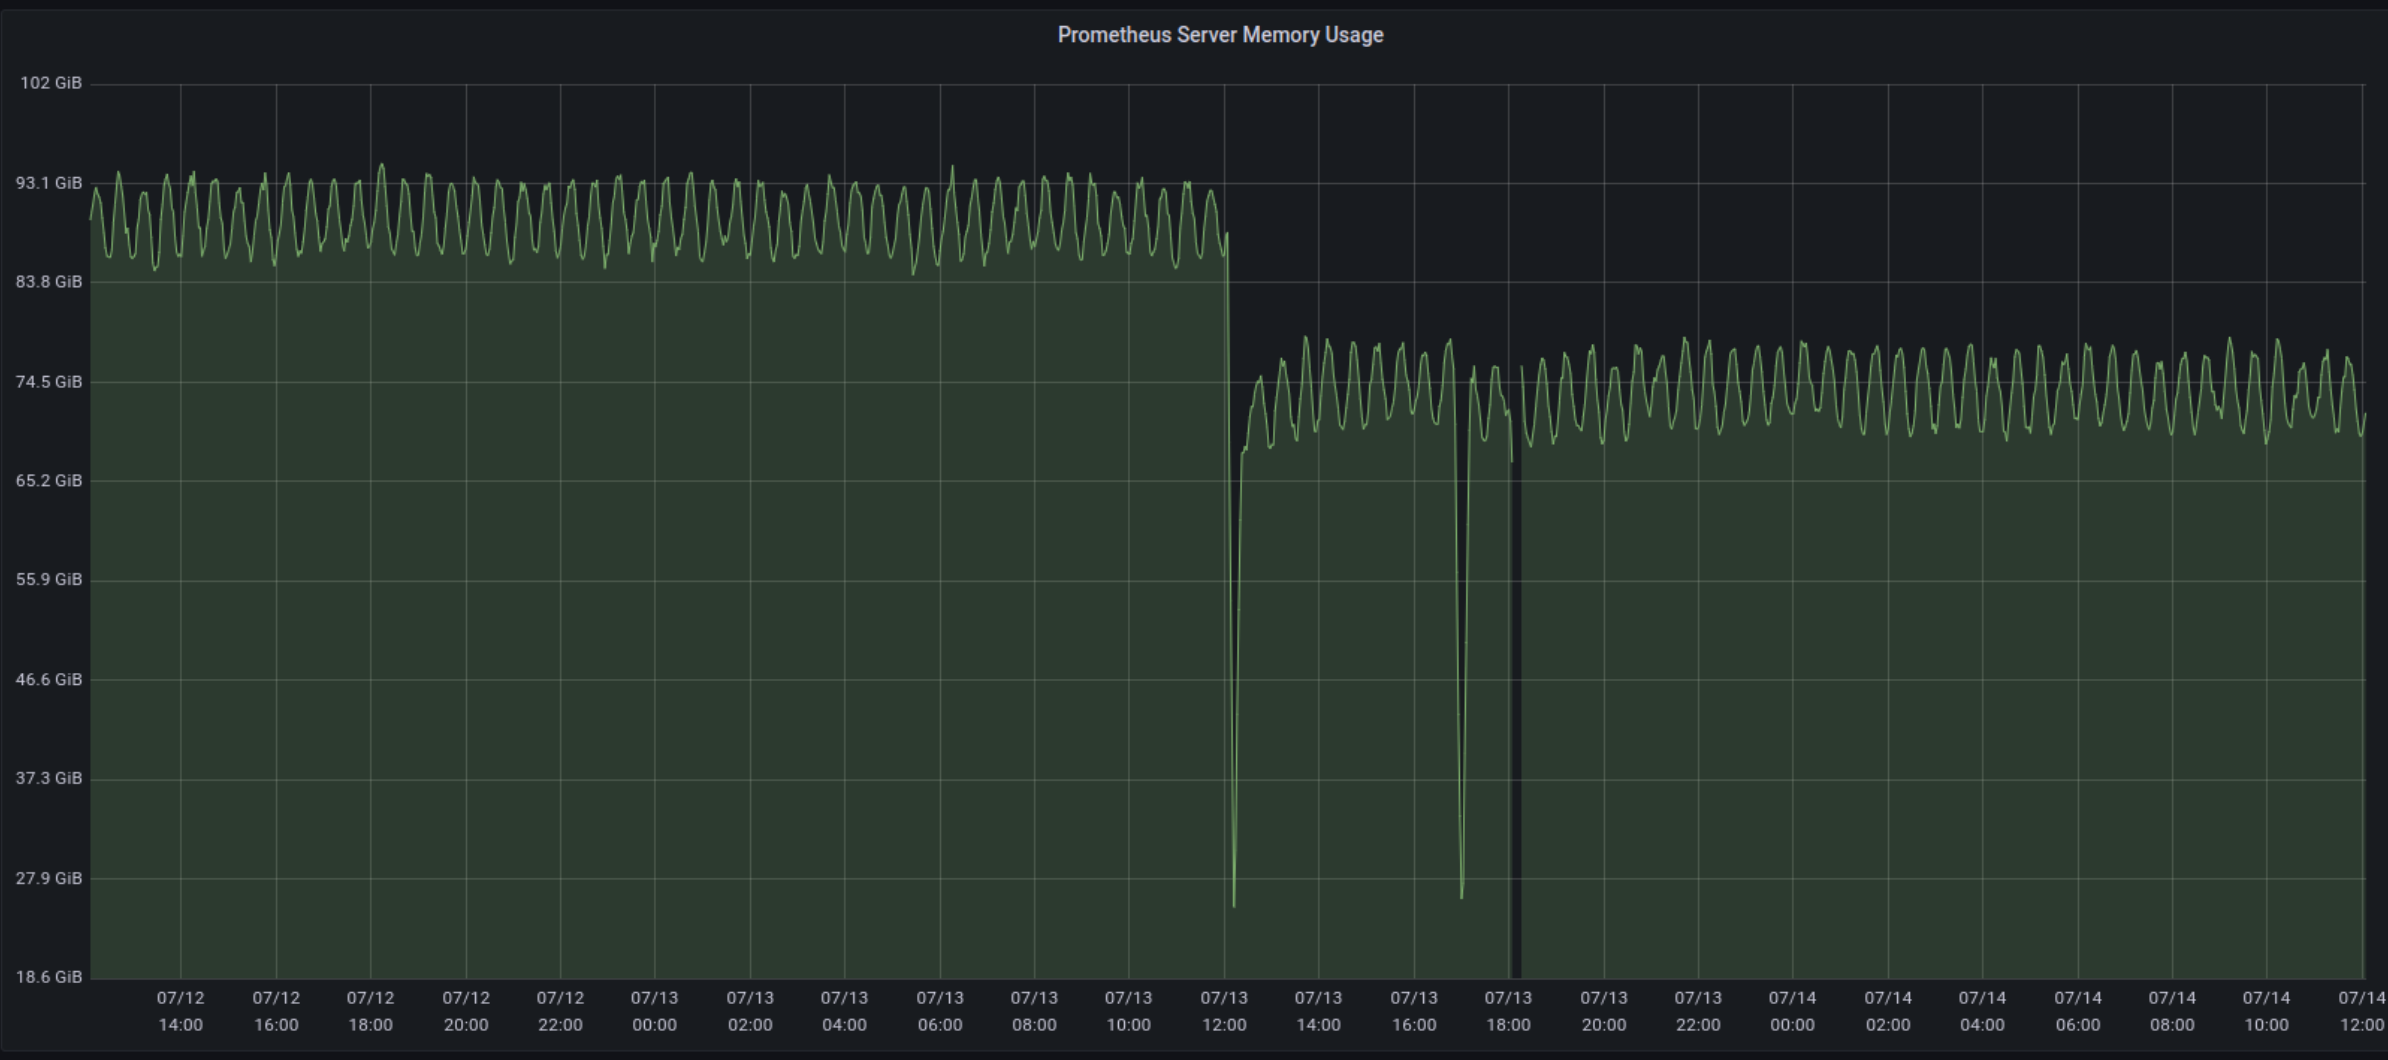
Our observation with our own cluster (normal memory consumption ~55GB):
image

This graph shows the absolute amount of memory consumed by two nodes in our cluster, one running the patch version and one running v2.29.1 (lol we are behind on our upgrades). We can see that memory consumption can be as much as 10GB less (although some peaks are almost the same). The period at the start of the graph shows where the two nodes were running the same version (identical mem. consumption).

image
This graph shows the % of memory saved by running this patch version, ranging around 5-25%.

@bboreham
Copy link
Member Author

Thanks for posting your findings.
There is now an image published from Prometheus CI: prom/prometheus:v2.43.0-rc.1_stringlabels

@jiacai2050
Copy link

SCR-20230322-kjys

By upgrade from v2.12.0 to v2.43.0-stringlabels tag, 30% drop in my prod env, (43-30)/43 = 30%

@der-eismann
Copy link

Unfortunately for us there don't seem to be any memory savings compared to the instance running v2.42.0 before, however CPU consumption seems to have calmed down a bit.

screenshot-20230323-105851

@bboreham
Copy link
Member Author

Thanks for the data, @der-eismann.

A saying of mine: "there is no single metric for memory which shows what is going on".
The fact that yours hits the red limit suggests you are experiencing some paging. It might even have got worse.
Suggest plotting that, and/or the Go heap size.

rate(container_memory_failures_total{..., failure_type="pgmajfault"}[5m]
go_memstats_heap_inuse_bytes (go_memstats_next_gc_bytes is more stable, but requires more understanding of Go internals to read)

@der-eismann
Copy link

Happy to help @bboreham! You're completely correct with your saying and thanks for suggesting some useful metrics - I'm pretty sure the memory allocation is not perfect, it's more of a "it's not dying, so let's keep it 🤷‍♂️".

The container_memory_failures_total{..., failure_type="pgmajfault"} seem much more stable, or at least not growing as much as before, though that is hard to see in the rate due to the spikes.
screenshot-20230323-141925
screenshot-20230323-141909

go_memstats_heap_inuse_bytes seems to be a bit lower while go_memstats_next_gc_bytes stayed the same, unfortunately we only keep those metrics for 48h.
screenshot-20230323-143023
screenshot-20230323-143018
screenshot-20230323-142945
screenshot-20230323-142940

Let me know if you need any other metrics!

@hamishforbes
Copy link

In my environment I'm seeing modest (possibly within margin of error tbh) memory improvements, but also a CPU usage reduction!

Screenshot 2023-03-23 at 20 00 41

Screenshot 2023-03-23 at 20 03 44

Compared to 2.43.0.
This instance has around 1m series, it's a kube-prometheus-stack deployment that remote writes to Mimir, so the usage pattern is probably a bit different from normal.
There's almost no querying, just recording rules and some 'local' querying (from autoscalers etc).
Mostly just scraping and forwarding.
Not sure if that makes a difference

@bboreham
Copy link
Member Author

@der-eismann I feel I need to explain your first chart: I suggested rate(5m), but when zoomed out to 2 weeks this window was too small to show all the data. Your screengrab is 1000 pixels wide and 2 weeks / 1000 is ~20 minutes, so with a 5-minute window the other 15 minutes of each pixel is not included in the calculation. If you try [20m] or [30m] it will likely be easier to see the pattern.

@hamishforbes indeed the specific pattern of usage can make a big difference - I recently realised that dropped targets hold on to huge Labels just in case you want to view them to diagnose why they were dropped. Thanks for sharing your data.

@npordash
Copy link

npordash commented Apr 6, 2023

We've got an internal system I've got to successfully build with stringlabels and in at least one use-case so far that I've tested we're seeing a ~20% reduction in cpu (read+write workloads) and a ~15% reduction in memory.

AFAICT the cpu reduction is largely coming from the reduced cost to construct labels on both the read and write side. The write side is translating from protobuf into a shared labels.Labels and labels.ScatchBuilder before working with the appender while the read side appears to be mostly from https://github.com/prometheus/prometheus/blob/v2.43.0/tsdb/querier.go#L531.

I did run into a few hiccups in trying to get our code working with both stringlabels and !stringlabels builds which I've filed a separate issue for: #12230.

Thanks for all of the hard work! So far this is looking very promising :)

@Stono
Copy link

Stono commented Apr 27, 2023

Hello
I'm just here to give you a round of applause, two different prometheus instances here:

Screenshot 2023-04-27 at 12 55 21

👏

Goodbye

@djluck
Copy link

djluck commented May 23, 2023

An update after rolling this out to our infra that stores 70 million time series. We saw the following resource use reduction after rolling this out:

  • 190 -> 145 cpu cores
  • 1.3TB -> 1TB memory

I just want to thank everyone involved in this change, it's made a remarkable improvement.

Sign up for free to join this conversation on GitHub. Already have an account? Sign in to comment
Projects
None yet
Development

Successfully merging this pull request may close these issues.

None yet