Run demo project
- Run the uglab_demo.py script within the root of the project
For demonstration purposes we include a subset of the Pan -European datasets needed to run the project.
This is a demo project for city of Munich, Germany.
Related data sources are placed within _uglab_source_demo_data folder.
All generated files will be placed within _uglab_demo_project folder.
Also notice the existence of MUNICH_MBR.shp within _uglab_demo_project folder, this is the study area for our demo (munich).
The whole procedure to complete will take from 15 minutes to 1 hour depending on the machine running it. Consider, that you should have internet access during the runtime to download OSM data for your study area.
After script completion your _uglab_demo_project folder should be fulfilled with the intermediate produced data.
There should also be a new folder ml_data containing the final data, including:
- 1 plot for the feature impact using the Linear Regression method
- 1 plot for the feature impact using the Random Forest method
| Feature Impact - Linear Regression | Feature Impact - Random Forest |
|---|---|
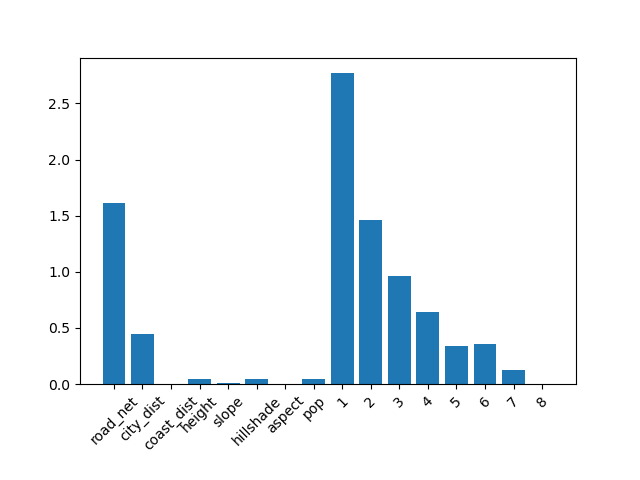 |
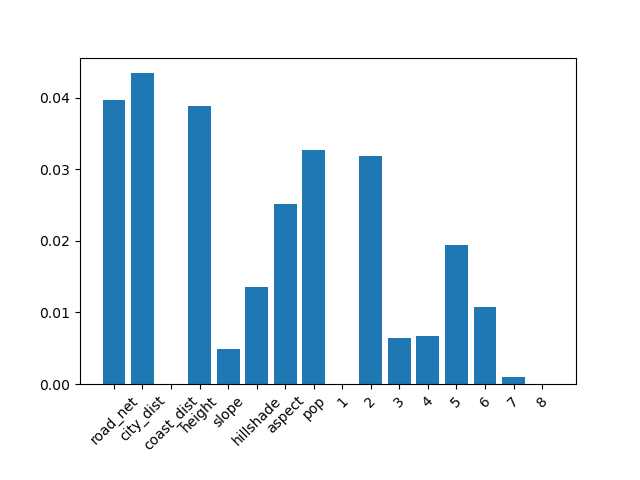 |
- 1 plot for Accuracy learning curves
- 1 plot for Loss learning curves
| Loss learning curves | Accuracy learning curves |
|---|---|
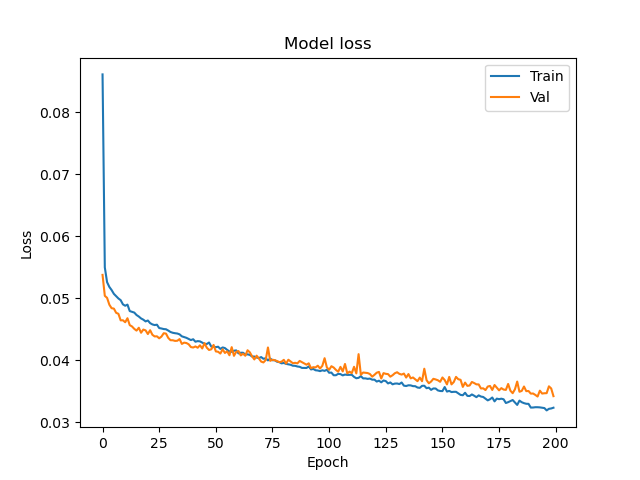 |
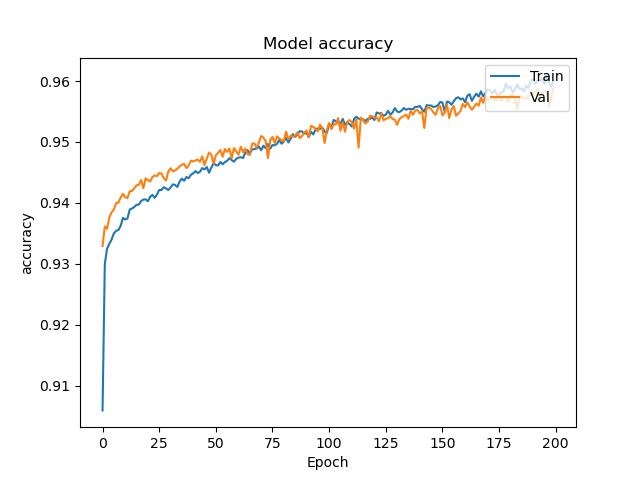 |
- 1 csv file containing x_coord, y_coord, urban/nonurban 2006, urban/nonurban 2018, urban/nonurban 2018 - predicted eg.
| x_coord | y_coord | 2006 real | 2018 real | 2018 predicted | 2030 predicted |
|---|---|---|---|---|---|
| 2414480.54 | 4622802.23 | 0.00 | 0.00 | 0.00 | 0.00 |
| 2414628.43 | 4622802.23 | 0.00 | 1.00 | 1.00 | 1.00 |
| 2414776.31 | 4622802.23 | 0.00 | 0.00 | 0.00 | 0.00 |
| 2414924.19 | 4622802.23 | 1.00 | 1.00 | 1.00 | 1.00 |
................................................
- 1 geotiff for the period 2006-2018 holding real changes
- 1 geotiff for the period 2006-2018 holding predicted changes
- 1 geotiff for the period 2018-2030 holding predicted changes
| 2018 REAL | 2018 PREDICTED | 2030 PREDICTED |
|---|---|---|
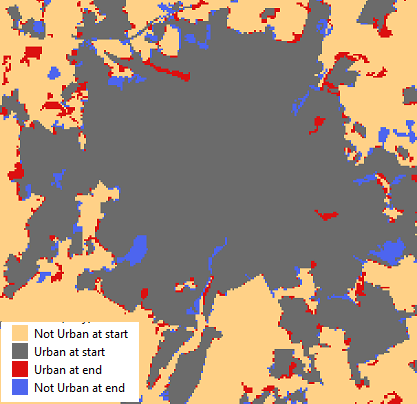 |
 |
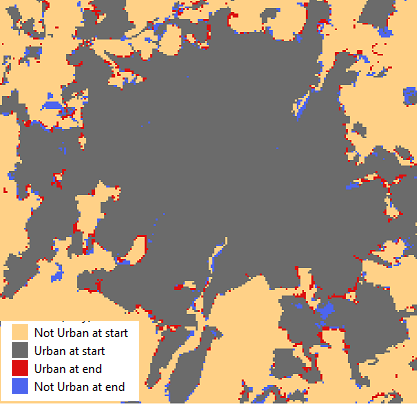 |