Skip to content
New issue

Have a question about this project? Sign up for a free GitHub account to open an issue and contact its maintainers and the community.

By clicking “Sign up for GitHub”, you agree to our terms of service and privacy statement. We鈥檒l occasionally send you account related emails.

Already on GitHub? Sign in to your account

display association rules plots in streamlit #901

Merged
merged 24 commits into from Jan 7, 2021

Conversation

batmanscode
Copy link
Contributor

@batmanscode batmanscode commented Dec 1, 2020

issue #884

Changes

Added display_format

def plot_model(model, plot="2d", scale=1, display_format=None):
.
.
.
    if display_format=='streamlit'
        st.write(fig)
    else:
        fig.show()

Notes

  • Didn't include import streamlit as st since this will only work inside streamlit anyway
  • Didn't use st.plotly_chart since st.write can plot many types of charts and won't have to be changed if plotly is dropped later

Update

  • Added display_format to anywhere plot_model can be called 馃槂
  • Error handling

Additional:

In nlp.py where fig.iplot() is used, I had to change asFigure = save_param to asFigure = True because streamlit needs a plotly object to interpret (https://discuss.streamlit.io/t/cufflinks-in-streamlit/2232/2)

.
.
.
if display_format=='streamlit':
    fig = df.iplot(asFigure=True) # plotly obj needs to be returned for streamlit to interpret
    st.write(fig)
else:
    df.iplot()

@batmanscode batmanscode marked this pull request as ready for review December 1, 2020 09:06
@Yard1
Copy link
Member

Yard1 commented Dec 2, 2020

Hey @batmanscode, thanks for your contribution! I am not familiar with streamlit, but can it be applied to other plots too - for example, in regression or clustering?

@batmanscode
Copy link
Contributor Author

Hi @Yard1, yes absolutely! Adding a conditional st.write(fig) anywhere there is a fig.show() will work.

I would like to add display_format='streamlit' to the plots in other modules as well but it seems for some the change will have to be in ..internal/tabular and that will take a little more time for me to go through.

And as a side note, I do recommend checking out streamlit when you have the time 馃槂

@batmanscode
Copy link
Contributor Author

batmanscode commented Dec 3, 2020

Okay so maybe ..internal/tabular doesn't really need it since there is an option to save the plot in plot_model() so a streamlit app can just display the saved image.

@Yard1
Copy link
Member

Yard1 commented Dec 3, 2020

I think it would be a good idea to have a unified API. Do you think you could add that? If you have trouble with modifying internal/tabular, I am happy to help.

@batmanscode
Copy link
Contributor Author

Yeah I think you're right. Makes more sense to have it uniform.

Yes, I should be able to! Thank you, I will let you know if I run into any problems 馃槂

@batmanscode batmanscode marked this pull request as draft December 8, 2020 11:51
included in plot_model() so it can pass display_format to ..internal.tabular.plot_model
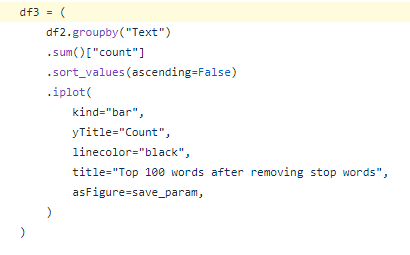
added `display_format == 'streamlit'`

for `fig.iplot()` had to change `asFigure = save_param` to `asFigure = True`
this is needed because streamlit needs a plotly object to interpret (https://discuss.streamlit.io/t/cufflinks-in-streamlit/2232/2)

for `fig.show()`, just added if `st.write(fig)`
@batmanscode
Copy link
Contributor Author

Hi @Yard1, my last commit is failing some tests but I'm not sure why. Can you please have a look when you have some time?

@batmanscode
Copy link
Contributor Author

batmanscode commented Dec 12, 2020

Btw, for plots like on this line:

image

Why is it df3 = df2.iplot()? Based on some tutorials I saw, I thought it should be df2.iplot() or iplot(df3). Or have I missed something? 馃槄

@batmanscode batmanscode marked this pull request as ready for review December 15, 2020 01:06
@batmanscode
Copy link
Contributor Author

Btw, for plots like on this line:

image

Why is it df3 = df2.iplot()? Based on some tutorials I saw, I thought it should be df2.iplot() or iplot(df3). Or have I missed something? 馃槄

I wonder if this could be related to #319

@Yard1
Copy link
Member

Yard1 commented Dec 20, 2020

@batmanscode Apologies, I must have missed this. I'll take a look as soon as I am able.

@batmanscode
Copy link
Contributor Author

batmanscode commented Dec 20, 2020

No problem at all @Yard1, I just figured you must have been busy.

Alright, thank you 馃槂

@Yard1
Copy link
Member

Yard1 commented Dec 22, 2020

@batmanscode Could you merge master into this branch, so the tests can pass? Thanks.

merge master into this branch so tests can pass
@Yard1
Copy link
Member

Yard1 commented Dec 22, 2020

@batmanscode So the issue was that evaluate_models needs to be updated any time there's a new parameter added to plot_models. One more thing before I merge this, though - could the default value for display_format be "matplotlib", and could you make it throw an exception if neither "matplotlib" nor "streamlit" is passed as the display_format parameter? It's easier to understand than just None. Thanks.

@batmanscode
Copy link
Contributor Author

Oh right, thank you for the fix and explanation 馃槂 will keep that in mind for any future changes.

Okay sure, that does sound clearer. I will go through and add this exception. And I think you mean "plotly" 馃槅

I do have a concern about naming the default plots:
Right now plot_model uses plotly for every module and in this case plotly being default for display_format makes sense but, if in a future release, some modules use something other than plotly, it might get a little weird.

Or do you think that it's unlikely and plot_model will always use one plotting library in every module?

For example:
If the nlp module uses some other library for plotting, then its plot_model would have display_format=newlib or streamlit while all the other modules would have display_format=plotly or streamlit which would mean all the display_format options won't work universally.

In this case, another option could be to change display_format to something like special_formatting=None or streamlit. This way each module can have its own default plotting library without causing any confusion.

@Yard1
Copy link
Member

Yard1 commented Dec 23, 2020

For example:
If the nlp module uses some other library for plotting, then its plot_model would have display_format=newlib or streamlit while all the other modules would have display_format=plotly or streamlit which would mean all the display_format options won't work universally.

In this case, another option could be to change display_format to something like special_formatting=None or streamlit. This way each module can have its own default plotting library without causing any confusion.

Fair point. Let's keep None for now, then. Just please make sure that a user cannot pass an invalid value.

@batmanscode
Copy link
Contributor Author

Alright will do. I think the if/else statements need to be changed as well. Right now things will work fine even if an invalid value is passed since it will just execute fig.show() if anything other than 'streamlit' is given.

Right now it's:

if display_format == 'streamlit':
    st.write(fig)
else:
    fig.show()

But something like this is probably better:

if display_format == 'streamlit':
    st.write(fig)
if disploy_format == None:
    fig.show()

@Yard1
Copy link
Member

Yard1 commented Dec 23, 2020

@batmanscode It's fine to leave it as is, considering we'll have value checks beforehand.

@batmanscode
Copy link
Contributor Author

Ah yes, thanks!

@batmanscode
Copy link
Contributor Author

All done @Yard1. Sorry, forgot to comment that I was finished.

Copy link
Member

@Yard1 Yard1 left a comment

Choose a reason for hiding this comment

The reason will be displayed to describe this comment to others. Learn more.

Just one thing, please change this in all strings

pycaret/internal/tabular.py Outdated Show resolved Hide resolved
@batmanscode batmanscode requested a review from Yard1 January 2, 2021 09:01
Copy link
Member

@Yard1 Yard1 left a comment

Choose a reason for hiding this comment

The reason will be displayed to describe this comment to others. Learn more.

One last thing - can you run black on all modified files? Thanks.

pycaret/arules.py Outdated Show resolved Hide resolved
@batmanscode
Copy link
Contributor Author

One last thing - can you run black on all modified files? Thanks.

Done 馃憤馃徎

@batmanscode batmanscode requested a review from Yard1 January 3, 2021 13:01
@Yard1 Yard1 merged commit 6738acd into pycaret:master Jan 7, 2021
@Yard1
Copy link
Member

Yard1 commented Jan 7, 2021

Thanks, looks great.

@Yard1
Copy link
Member

Yard1 commented Jan 7, 2021

@batmanscode Hey, are you on PyCaret slack? Could you join if you haven't already and DM me there? I have no experience with streamlit but would like to expand the support for it to yellowbrick visualizers and I could use your help. Thanks.

@batmanscode
Copy link
Contributor Author

Thank you @Yard1, I've learnt a lot doing this 馃槂

Sure, I can join and contact you there, happy to help. I actually haven't used slack in a few years lol.

@nataliaasaa
Copy link

Hey! Does anyone knows a way to show evaluate_model results on streamlit? Thanksss

@batmanscode
Copy link
Contributor Author

batmanscode commented Jul 24, 2021

Hey! Does anyone knows a way to show evaluate_model results on streamlit? Thanksss

Hi, evaluate_model() creates a little UI in a notebook using ipywidgets (I think) so this will not work in a streamlit app, at least right now

You can create your own evaluate_model() like function/script to work in streamlit using plot_model() (which is what evaluate_model() uses internally)

Something like this should work 馃槉:

"""
# Evaluate Model
"""

plots = st.selectbox('select plot', ("auc", "threshold")) # docs will have the other plots, not all are supported

plot_model(model, plot=plots, display_format="streamlit")

Sign up for free to join this conversation on GitHub. Already have an account? Sign in to comment
Labels
None yet
Projects
None yet
Development

Successfully merging this pull request may close these issues.

None yet

3 participants