performance regression for ScatterPlot #1492
Comments
|
Hi @danielhrisca Thanks for reporting. We made significant changes in #1420 how Can you provide some dummy data or a script that we could use with your custom plot widget that we could replicate the drop in performance? |
|
You will need to install the development branch of my projects first (it remove a this monkey patched and then you can use this script from asammdf.gui.plot import plot
from asammdf import Signal
import numpy as np
v = np.arange(10000)
signals = [
Signal(v, v, name=f'S_{i}')
for i in range(400)
]
plot(signals)At first the curves will not use ScatterPlot so you need to enable that first and re-launch the script (the setting is saved using QSettings)
|
|
Assigned "high-priority" label as this is impacted from a recent change; so I'd like to try and zero-in on where things went wrong exactly, as #1420 was supported to have significant benefits. @danielhrisca which Qt bindings are you using? @lidstrom83 noticed that there was some very different performance behavior for PyQt5/Pyside2 and attempted to compensate for that by the use of |
|
I'm using pyqt5.15 and pyqt5.13 |
There is a lengthy blurb that may be relevant in your use-case: I'm not sure what your availability here is to experiment; but I would consider starting off with The other thing we noticed while developing this application was that the re-creation of |
|

|
Ok; so you do get significant speedups to using How does that compare with pyqtgraph 0.11.0 performance? |
|
|
clearly something else is up, because #1420 was supposed to be an across the board improvement; but if you can get back to almost where you were at with Anyway, next step is to re-evaluate when its appropriate to set that variable... |
|
I get ~2x performance improvement if I use this def _keys(self, styles):
        unique_styles = set(
            (symbol, size, id(pen), id(brush))
            for symbol, size, pen, brush in styles
        )
if len(unique_styles) == 1:
symbol, size, pen, brush = styles[0]
return [
(
symbol if isinstance(symbol, (str, int)) else f"{symbol.boundingRect()} + {symbol.elementCount()} elements",
size,
(pen.style(), pen.capStyle(), pen.joinStyle()),
(brush.color().rgba(), brush.style())
)
] * len(styles)
else:
return [
(
symbol if isinstance(symbol, (str, int)) else f"{symbol.boundingRect()} + {symbol.elementCount()} elements",
size,
(pen.style(), pen.capStyle(), pen.joinStyle()),
(brush.color().rgba(), brush.style())
) for symbol, size, pen, brush in styles
] |
|
Wow, 2x is nothing to sneeze at! If you don't mind me asking, for your use of the ScatterPlotItem symbols, were you providing a custom I need to read through that implementation a bit more, I know I just patched it up, but I'm keying on the Thanks for doing the experimentation here on this. |
|
This is where the PlotDataItem is created: https://github.com/danielhrisca/asammdf/blob/master/asammdf/gui/widgets/plot.py#L2417 I think another optimization that could be made is for the case where all the styles are identical. This would totally eliminate the
|
Actually I think many optimizations can be made for the case where all the scatter dots have the same style |
Yeah, that's what it's looking like to me as well; but I'm reluctant to make many changes until I can collaborate w/ lidstrom83 (not tagging him as I've already tagging him in a bunch of places and I know he's unavailable right now). I need to spend some time reading over this code more to better understand the functionality; I do appreciate you testing/profiling these changes, certainly makes it a bit easier for me to evaluate. also |
|
I also think it might be helpful to implement |
|
@danielhrisca if you want to hop onto our slack (or communicate off the issue tracker) to try and iterate through something that may work a bit faster let me know. |
|
So, I'm going to kick the can down the road a bit on the
I think you're right ... We have a
Edit: modifying @staticmethod
def _keys(styles):
return {
(
symbol if isinstance(symbol, (str, int)) else f"{id(symbol)}+{symbol.elementCount()}",
size,
(pen.style(), pen.capStyle(), pen.joinStyle()),
(brush.color().rgba(), brush.style())
) : (symbol, size, pen, brush) for symbol, size, pen, brush in styles
}specifically w/ these lines in dataSet['sourceRect'][mask] = self.fragmentAtlas[
list(zip(*self._style(['symbol', 'size', 'pen', 'brush'], data=dataSet, idx=mask)))
] |
|
Going back to your suggested optimization, unfortunately I can't do it quite that way: unique_styles = set(
(symbol, size, id(pen), id(brush))
for symbol, size, pen, brush in styles
)since |
|
I think this is the reason that the lists are used in the code since most of the Q objects are not hashable (qpen, qbrush,...) |
I'm going to try and do some benchmarking on the |
|
@danielhrisca can you try the following method for @staticmethod
def _keys(styles):
hashable = {
(id(symbol), size, id(pen), id(brush)):(symbol, size, pen, brush) for symbol, size, pen, brush in styles
}
persistent = {
key:(
symbol if isinstance(symbol, (str, int)) else f"id:{id(symbol)} pts:{symbol.elementCount}",
size,
(pen.style(), pen.capStyle(), pen.joinStyle()),
(brush.color().rgba(), brush.style())
) for key, (symbol, size, pen, brush) in hashable.items()
}
returnedList = [
persistent[(id(symbol), size, id(pen), id(brush))] for symbol, size, pen, brush in styles
]
return returnedList |
|
|
|
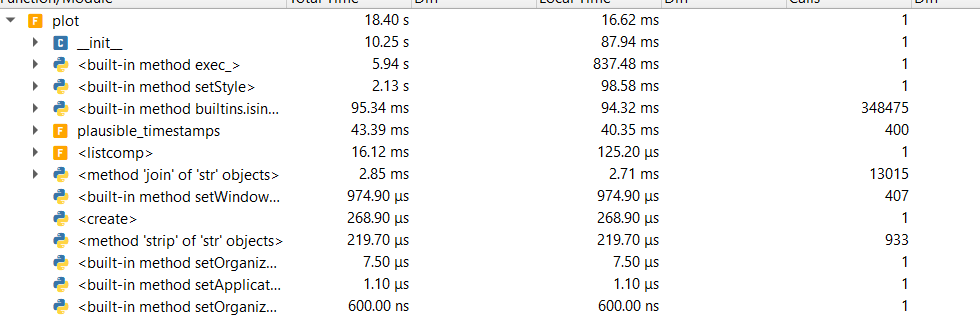
from 16.40 seconds to 18.40 seconds; that's not helpful.... |
still better than the default |
Oh is that with |
I've left out my _keys implementation since it is not universally applicable |
|
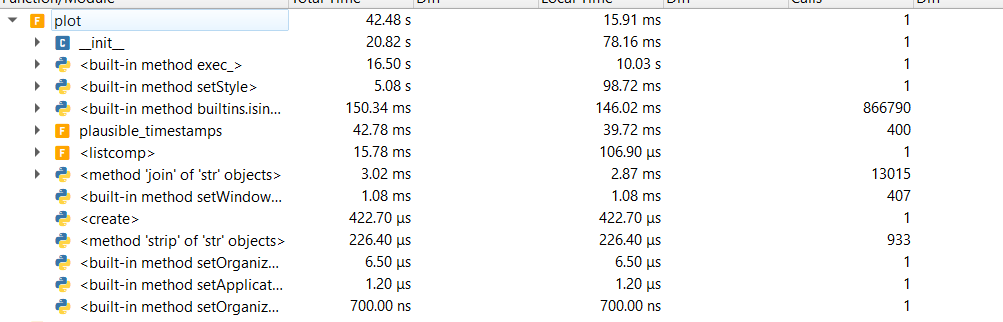
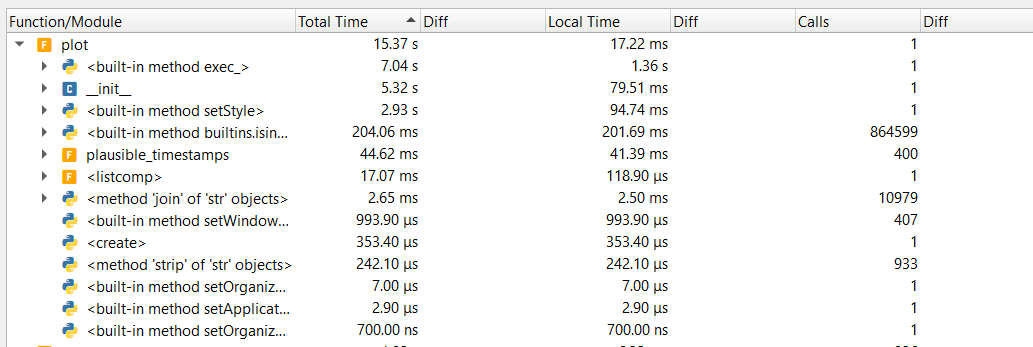
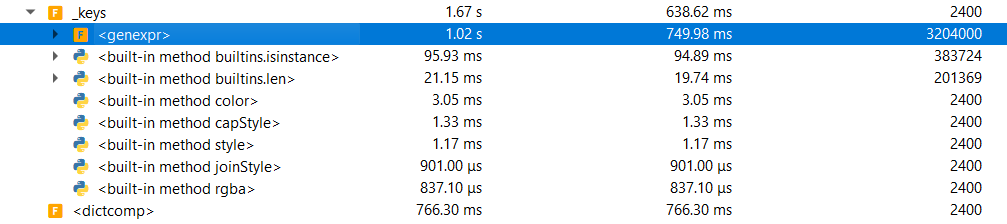
I realize that I was looking at the wrong function timing: the
|
|
so |
That would be perfect! I need to come up with some kind of modification to one of the examples (ideally) that collects timing information, that I can test against the various Qt bindings that tests both display/render and zoom/pan performance with pxMode on/off. |
|
|
@dgoeries |
|
We need a way to benchmark the key-press events to zoom in and pan... |
It's in the same range but I use a custom culling on the data so I don't know if it is relevant |
|
Hey @danielhrisca, would it be possible and easy enough to create a minimal working example of this performance regression? |
|
Just follow the steps from above #1492 (comment) |
|
thanks for the benchmark, that is also my observation that |
I find this too using this benchmark. My target benchmark when evaluating whether to keep this option in #1420 was panning and zooming. A quick and dirty way to profile this is to set |
|
FYI: I'm currently adding a panning and zooming benchmark to #1566 . |
|
I merged the PR, @lidstrom83 I know I've said this elsewhere, but this is an amazing tool! Is there a specific combination of parameters you'd like to see? |
|
I haven't been able to measure the regression yet using the tool. I think I'm working on a hovering benchmark as well, but I don't think it'll be relevant for this issue. |
|
Oh, never mind, I think I am able to measure it. Looking into it... |
|
Here is what the fps results look like, please keep in mind numbers were bouncing around:
To test 0.11.0; I modified the EDIT: Here is an updated chart with #1569 as merged:
|
|
Here we've been jumping on @lidstrom83 but looks like #1383 is actually the culprit |
|
thanks for the test. Sad that the transparent background gives a drop. However, it does not seem to be the only reason. |
If you can identify another place we're taking a performance hit on scatter plot items, let me know, and I'll take a look! |
That's correct. The first commit in #1569 fixed a regression I introduced in #1420 for the default parameter choice in the benchmark tool. That would have also degraded performance between 0.11.0 and 0.11.1. I'm not aware of any remaining performance issues, though I'd appreciate if people could post some numbers so I can be sure. |
I've updated the table to showcase how things are as they stand; this was for "Reuse Item" mode; I wouldn't mind doing more comparisons |
|
@danielhrisca Can you check how your tool behaves on master now? |
|
|
Hmm...So your benchmark is measuring something different from ours. I'm not sure what to do from here, if you can narrow down where you think pyqtgraph is behaving slower, I can certainly look into it more. Something I did notice in our testing was that Qt 5.15 definitely outperformed Qt 5.12 bindings. You mentioned using 5.13 earlier, if feasible, I would evaluate migrating to 5.15 (I haven't tested benchmark performance on Qt6 yet). |
|
@danielhrisca were you able to see a drop in performance with any of the parameter choices in the scatter plot benchmark tool? If there's anything I missed in that tool that you think might reveal the drop, let me know and I'll add it. Otherwise, are you certain that this is related to ScatterPlotItem? |
|
To rule out the other issues we've noticed recently, I wonder what happens if you set |
|
@danielhrisca you may have thought I forgot about this, but I did not! through the mail list, @ibrewster requested some input for trying to speed up a scatter plot with (what I consider to be) far too many points. After not having a fix, he noticed far better performance on 0.11.0. With some work on his behalf, we tracked down the commit causing the slow-down to be this guy. This commit aims to fix an upstream Qt issue; but, more importantly, we have a flag to disable it, which may be of reference. In your usage of |
Oh, it's DEFINITELY far too many points. I tell my users that they need to limit the geographical region they are looking at to get good performance, but at the end of the day, the user will do what the user will do - and of course it's on me to deliver the best possible performance regardless! :) |
If only we could do away with our users, then everything would be just peachy! @danielhrisca if ScatterPlotItem performance is important to you, I encourage you to chime in on this issue here on the pyside bug-tracker: https://bugreports.qt.io/browse/PYSIDE-1572 Right now, ScatterPlots generation is not vectorized, due to no ability to pass a block of data to Qt in such a way that Qt can iterate through on the C-level. If this feature is adopted, it should provide some significant performance boosts for scatter plots (on PySide6 bindings). |
|
Hello, I've tried setting |
Short description
As suggested in #1359 I open this issue.
In this custom plot widget each curve is added to a dedicated ViewBox, and all the ViewBoxes are X-linked. I usually check the performance of the ScatterPlot (with dots) with ~1000-2000 curves.
In the profile data shared in #1359 I've used ~1700 curves.
There is a big drop in performance when comparing 0.11.1 with 0.11.0
Code to reproduce
Tested environment(s)
Additional context
The text was updated successfully, but these errors were encountered: