Skip to content
New issue

Have a question about this project? Sign up for a free GitHub account to open an issue and contact its maintainers and the community.

By clicking “Sign up for GitHub”, you agree to our terms of service and privacy statement. We’ll occasionally send you account related emails.

Already on GitHub? Sign in to your account

Idea Collection: Functionality to support in splot #10

Open
12 of 23 tasks
slumnitz opened this issue Jun 7, 2018 · 1 comment
Open
12 of 23 tasks

Idea Collection: Functionality to support in splot #10

slumnitz opened this issue Jun 7, 2018 · 1 comment
Labels
discussion space for collecting ideas and discuss these wishlist Functionality that should be supported in future

Comments

@slumnitz
Copy link
Member

slumnitz commented Jun 7, 2018

Space to collect ideas which functionality to support for each sub package in splot

esda

  • Choropleth functionality for each algorithm in esda.mapclassify.
  • Spatial Autocorrelation:
    • Global Moran scatter plot (Moran_Scatterplot())
    • Global Moran Bivariate scatter plot (Moran_BV_Scatterplot())
    • Global Moran Bivariate scatter plot facetting matrix (Moran_BV_facet())
    • Global Moran Rate scatter plot (Moran_Rate_Scatterplot())
    • Local Moran map (Moran_Local_Map())
    • Local Moran Bivariate map (Moran_Local_BV_Map())
    • Local Moran Rate map (Moran_Local_Rate_Map())
    • Local Getis-Ord map (G_Local_Map())

giddy

  • dynamic LISA
    • dynamic LISA heatmap (dynamic_lisa_heatmap(rose))
    • dynamic LISA rose diagrams (dynamic_lisa_rose(rose))
    • dynamic LISA vectors (dynamic_lisa_vectors(rose))
    • dynamic LISA composite plot (dynamic_lisa_composite(rose, gdf))
    • dynamic LISA interactive composite plot (dynamic_lisa_composite_explore(rose, gdf))
  • LIMA

spreg

splot.vba

core splot

  • BV and TriV choropleths
  • BV LISA matrix
  • Triangles for BiVAriate choropleths
  • conditional map
  • facets (prototype example)
@slumnitz
Copy link
Member Author

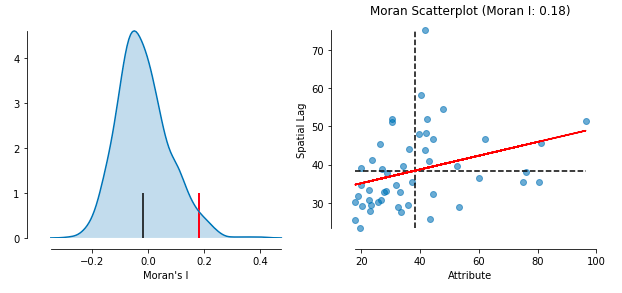
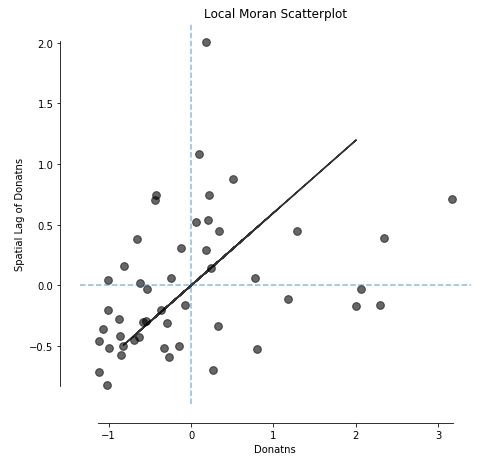
I am playing with different visualisations for all esda.moran objects at the moment. The moran_loc_scatterplot() so far displays standardised attribute values and corresponding spatial lag values (Moran_loc.z). I was wondering if it would make sense to also give an option ((standardized=False,...)) for non-standardised values in the scatterplot, displaying the actual attribute values and their spatial lag. I am not sure if this would be of use?

I would like to try and implement this scatterplot blueprint (+ additional visualizations) for all esda.moran objects (Moran_Local, Moran, Moran_BV,...) in the next two weeks. If I implement standardised values for all scatterplots, does Moran_BV also have an .z argument or something similar?

What do you think @sjsrey @TaylorOshan @darribas @ljwolf

Scatterplot with real-attribute values
image

scatterplot with (z-) standardised values:
image

@slumnitz slumnitz added the wishlist Functionality that should be supported in future label Sep 10, 2018
Sign up for free to join this conversation on GitHub. Already have an account? Sign in to comment
Labels
discussion space for collecting ideas and discuss these wishlist Functionality that should be supported in future
Projects
None yet
Development

No branches or pull requests

1 participant