[Bug] Possible memory leak in botorch.optim.optimize_acqf
#641
Comments
|
I have observed something similar in the past, but forgot to investigate further. Is it possible that the memory leak happens in calls to I had a base I have a feeling that |
|
I can't seem to reproduce the memory leak with your code, but replacing the last part with the following produces a memory leak: This leads to a memory leak as seen here: If I instead disable the GPyTorch's fast predictive variances: The leak seems to disappear (at least partially): By default BoTorch uses |


|
I can repro this issue, looking into this further. Am a little hamstrung by running into this error frequently, seems to be a known issue with mprof :( pythonprofilers/memory_profiler#163 The suggestion to run in sudo doesn't fix this either |
|
|
|
The fact that Sait's example shows significant growth means that there must be some tensors / graph components of significant size that are not being garbage collected... |
|
They seem to be different issues though -- disabling fast predictive variances doesn't fix my issue. Turning off all fast computations ( |
|
hmm |
|
OK just tested this on an old linux machine, no memory leak there:
Here is the exact same code run on MacOS X 11.1 with the same config (python 3.8.5, torch 1.7.1, botorch 0.3.3, gpytorch 1.3.0):
Note that the Mac run is super slow (10X slower) compared to ubuntu - and this is on a modern 8-core Core i9 compared to a super old Dual-Core Core i3 on the linux machine. Also the memory allocation is much smaller (unclear from these profiles whether the ubuntu one is moving around, this might just not be visible on this scale. Something is definitely fishy here. |

|
Hmm turns out that running this with
|

|
Ok, there seem to be two separate issues:
|
|
@mshvartsman Any updates on this? On my end it's still reproducible on OSX but works fine on ubuntu. |
|
Short version: no news. Long version: linux issue still comes up when I run on very very many threads (~20+) and may be some weird edge case or bad interaction between threads and python multiprocessing. I'd say unlikely to come up in normal usage. No news on the mac side. Sorry for letting this drop. |
|
Fair enough. This one seems nasty enough that I'm not very tempted to go real deep here. I'll leave the issue open for tracking though. |
This is a PyTorch issueHere’s what I see on OSX when running the original example (yep, it’s still happening):
Here is some pure PyTorch code that produces the same pattern (the first ~2s are setup time): import torch
import time
def do_tensor_stuff(samps: int) -> None:
"""Similar to the content of qUpperConfidenceBound.forward."""
samples = torch.rand((512, samps, 1, 1))
obj = samples[:, :, :, 0]
mean = obj.mean(dim=0)
ucb_samples = mean + 3.98 * (obj - mean).abs()
ucb_samples.max(dim=-1)[0].mean(dim=0)
if __name__ == "__main__":
ntrials = 2000
samps = 1000
start = time.monotonic()
for i in range(ntrials):
do_tensor_stuff(samps)
print(time.monotonic() - start)
I don’t think this would cause an OOM; tensors are getting appropriately deallocatedmprof measures the amount of memory reserved by the process and not available to the rest of the system; it doesn’t measure the amount of memory occupied by live Python objects or by C objects such as tensors. I checked what Python objects remain at the end of the loop pretty thoroughly using Also, I tried to get it to OOM by increasing the size of the tensors and running many iterations, and wasn’t able to cause an OOM. And I see that total time is very close to linear in the number of iterations. But if this is causing practical problems for anyone, of course it would be great to know that. I think this has to do with too much memory being reserved for torch tensors, especially when a lot of small ones are created and destroyed. For related issues see here. |

|
Thanks for the thorough investigation! Given the result, should we close out the issue as it doesn't seem to be a botorch or gpytorch issue and also doesn't seem to cause any concrete problems? |
|
Yeah, I would consider this closed unless there is an example where this is causing a practical issue like an OOM or slowdown when memory gets high. I have a couple follow-ups in mind that would reduce memory usage, but those should be in separate issues/PRs:
|
We'll have to be careful about doing that when on a path that should be differentiable - autograd doesn't play well with in-place tensor operations. |
|
Hi! I just noticed the same behavior in my code and found this conversation (and also followed up on some of the other memory-related issues linked here). The problem was reported to me by someone using my code and they actually told me that their process was killed after some time due to OOM errors. I will try to reproduce their settings and see if pytorch's memory allocation was really the cause but, in the meantime, I wanted to ask if you have also noticed something similar lately? I mean, this thread was closed because it seemed like it's not a leak but rather controlled by the pytorch's memory scheduler – but how can we be certain? My question: is there a way to explicitly trigger a release of the allocated (but unused) memory? On the GPU, this seems to be possible via |
|
Hi @AdrianSosic. We're not aware of any memory leaks with BoTorch at this time. Note that memory usage will increase super-linearly in number of train & test points when using GPs, so it is not hard to OOM with BoTorch.
Python's |
|
Hi @saitcakmak, thanks for your answer! Just to avoid potential misunderstandings here: I'm well aware of the fact that there is a super-linear memory increase with GPs (i.e. the typical O(N^3) consumption in case of exact inference). But this is not my point. Instead, I was referring to @esantorella's post, which shows that memory allocation still increases even when all objects of a finished operation have been properly disallocated. As far as I understood, the current hypothesis is that this is caused by pytorch's memory management and it would not cause any OOM errors, i.e. the memory would be released before one runs into OOM. @esantorella tried to verify this empirically:
However, since not finding a positive example is no guarantee that this will never happen, this is just speculative. What I tried to explain in my previous post is that it seems some colleagues of mine now actually ran exactly into such a situation. Since the problem did neither occur on my system nor with my own code, I haven't been able to reproduce it so far, but I will try to do so with their help. So in case anyone of you has any new insights into the mechanics of the scheduler that have not been mentioned so far, I'd be happy to hear them =) |
|
To distinguish a true memory leak from the Python process reserving more memory than it needs, I would look at the contents of If you wanted the number and sizes of tensors that are currently tracked, you could do the following: import gc
from collections import Counter
print(Counter((t.shape for t in gc.get_objects() if isinstance(t, torch.Tensor))))If you wrap all of your code in a function and there are still tensors in |
🐛 Bug
As far as I can tell
botorch.optim.optimize_acqfleaves a tiny bit of memory behind somewhere. It seems worse for q-batched acquisition functions (at least, for qUCB and qEI) than analytic ones, and worse on ubuntu than OSX. Calls tofit_gpytorch_modeland the acqf itself seem fine.To reproduce
Sorry this is a bit long.
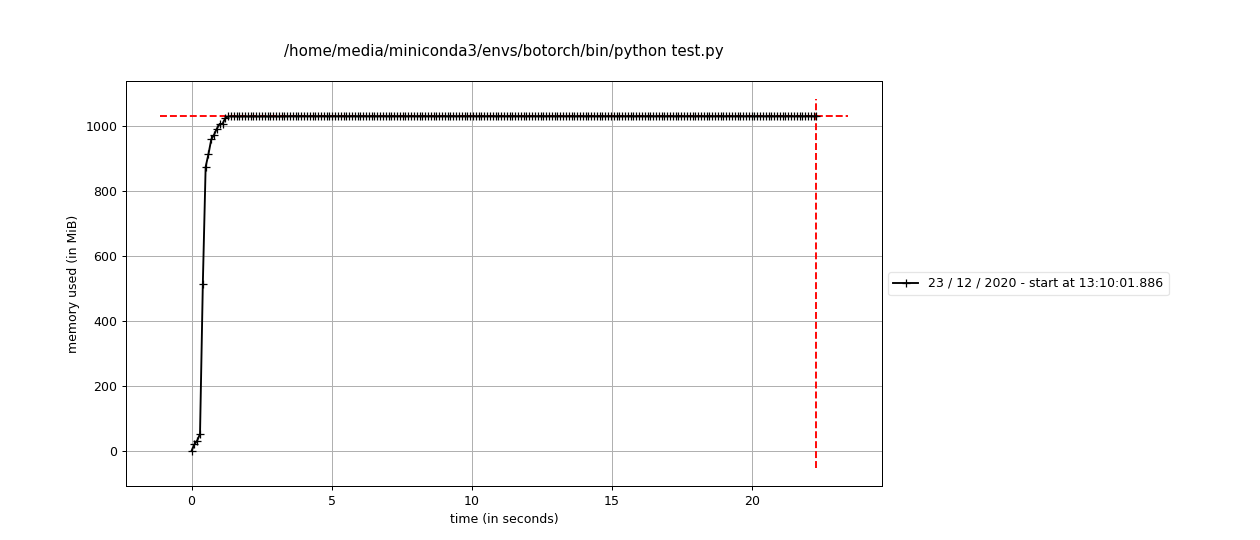
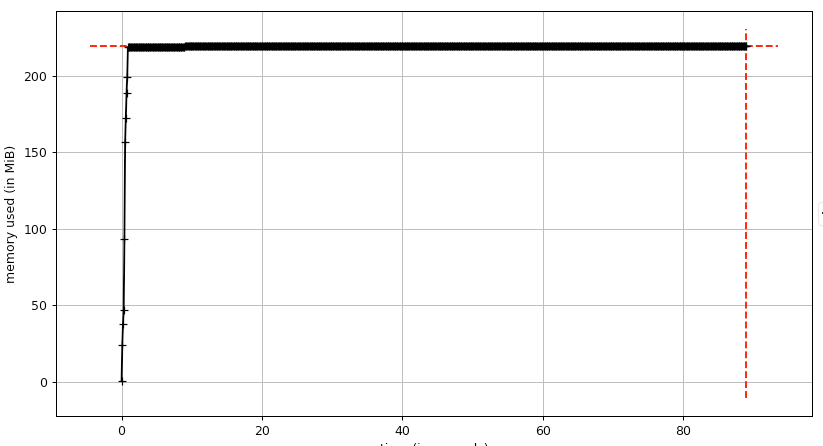
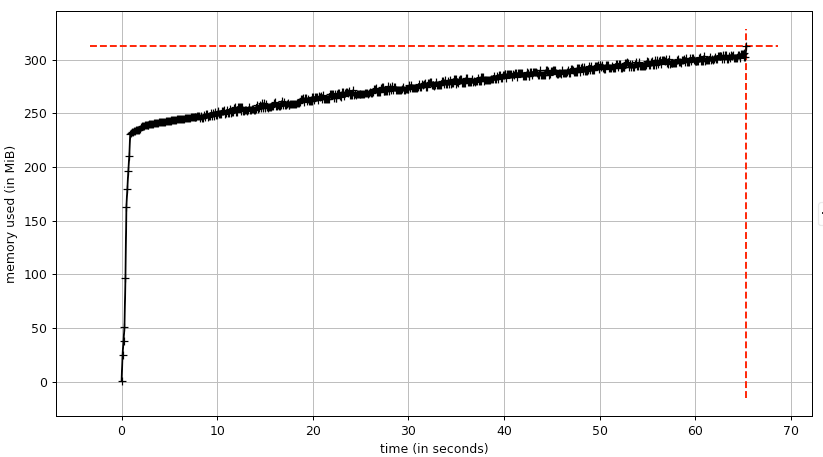
Running the above with mprof, here's what no leak looks like:
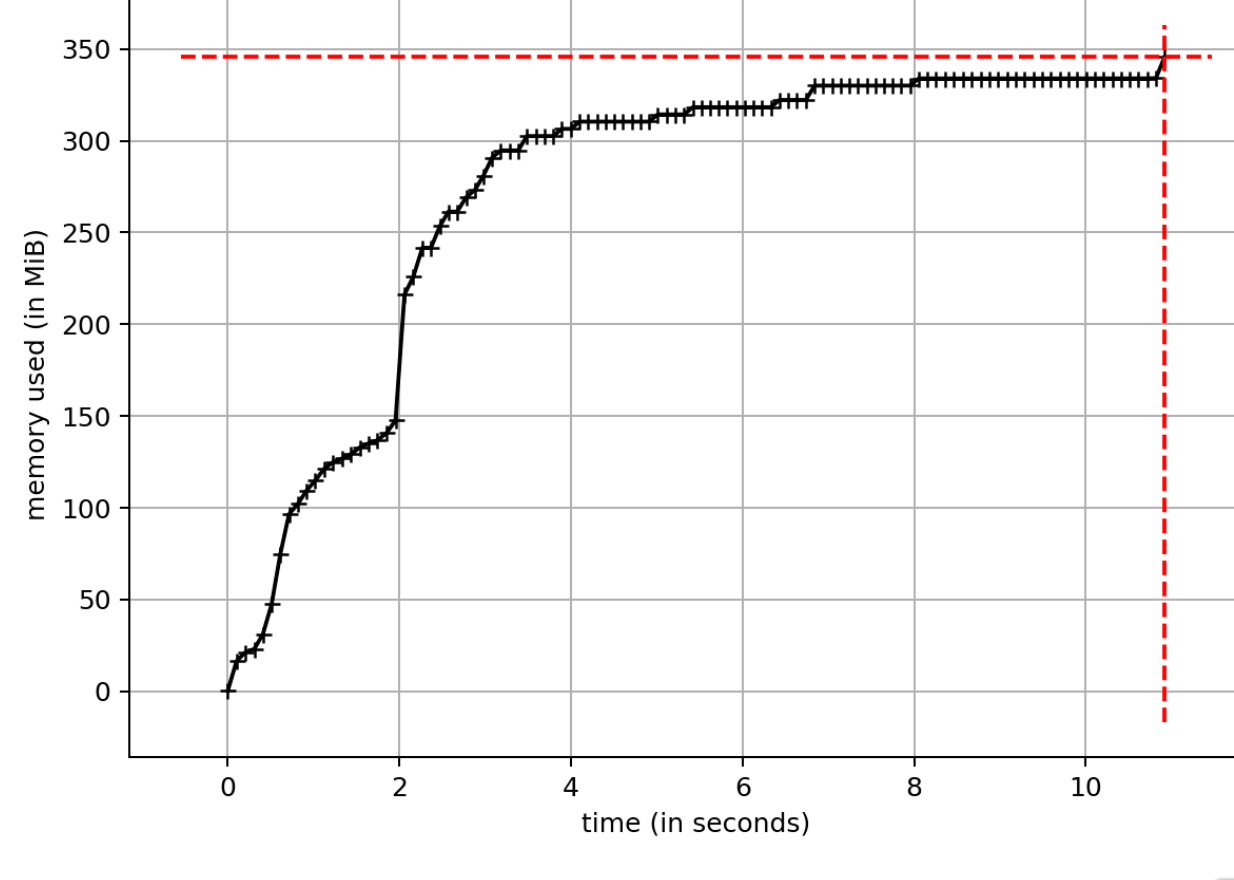
Here's what a leak on OSX looks like:
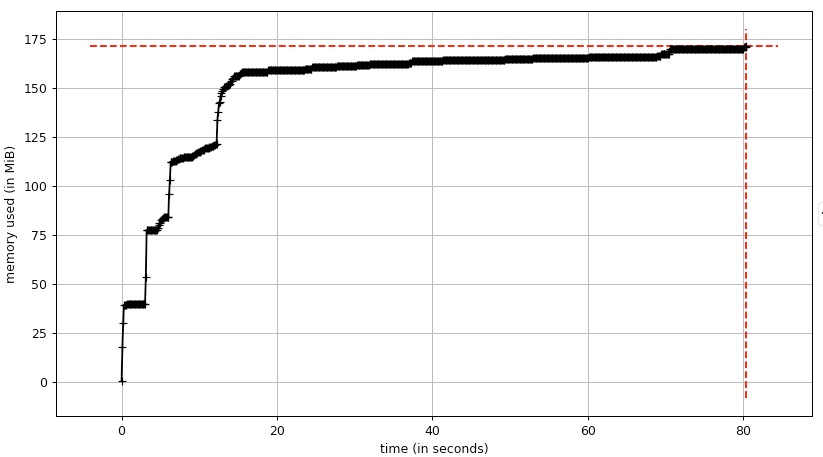
Here's what a leak on ubuntu looks like:
Expected Behavior
Expecting no memory leak here -- I'm trying to run some benchmarks, which means that I run many synthetic opt runs and anything long-running gets killed.
System information
The text was updated successfully, but these errors were encountered: