Memory usage and epoch iteration time increases indefinitely on M1 pro MPS #77753
Comments
|
I tested by changing the batch size from |
|
Changing batch size from Also, unlike nvidia gpus, why should there be any data overhead since they all reside in the same memory? I am not an expert but wasn't that the main point of apple chips? I also tried moving all the data to MPS before starting the loop, and it is still the same with 256 batch size. |
|
As far as I understand, even apple M1 that use unified memory still need to convert data between GPU, and CPU space, which still has some overhead, but it does not require data to be transfer (because it is already there) I tested with TL;DR
Code import time
import torch
import torchvision
import numpy as np
import torch.nn as nn
from tqdm.auto import tqdm
import torch.optim as optim
import matplotlib.pyplot as plt
from torchvision.models.resnet import ResNet, BasicBlock
BATCH_SZ = 512
MAX_EPOCHS = 10
PRINT_ITER = 5
# str_device = "mps" if torch.backends.mps.is_available() else "cpu"
loss_hist = {}
interval_hist = {}
for str_device in ["cpu", "mps"]:
loss_hist[str_device] = []
interval_hist[str_device] = []
device = torch.device(str_device)
print(device)
train_transforms = torchvision.transforms.Compose([
torchvision.transforms.Resize(64),
torchvision.transforms.RandomHorizontalFlip(),
torchvision.transforms.ToTensor(),
torchvision.transforms.Normalize(
mean=[0.485, 0.456, 0.406],
std=[0.229, 0.224, 0.225]
)
])
train_ds = torchvision.datasets.CIFAR10("./data", train=True, download=True, transform=train_transforms)
train_loader = torch.utils.data.DataLoader(train_ds, batch_size=BATCH_SZ, shuffle=True, num_workers=0, pin_memory=True)
model = ResNet(BasicBlock, [1, 1, 1, 1], num_classes=10).to(device)
model.train()
optimizer = optim.Adam([*model.parameters()])
criterion = nn.CrossEntropyLoss()
time_intervals = []
step_index = []
step_count = 0
for epoch in range(MAX_EPOCHS): # loop over the dataset multiple times
running_loss = 0.0
avg_loss = []
start = time.time()
prev_time = time.time()
with tqdm(total=len(train_loader), leave=False) as pbar:
for i, data in enumerate(train_loader, 0):
pbar.update()
inputs, labels = data
inputs = inputs.to(device)
labels = labels.to(device)
optimizer.zero_grad()
outputs = model(inputs)
loss = criterion(outputs, labels)
loss.backward()
optimizer.step()
running_loss += loss.item()
avg_loss.append(loss.item())
loss_hist[str_device].append(loss.item())
del inputs, labels
step_count += 1
if i % PRINT_ITER == PRINT_ITER - 1:
pbar.set_description(f"[{epoch + 1}/{MAX_EPOCHS}]: loss {running_loss/PRINT_ITER:.5f}")
pbar.refresh()
curr_time = time.time()
time_intervals.append((curr_time - prev_time)/PRINT_ITER)
step_index.append(step_count)
interval_hist[str_device].append((step_index[-1], time_intervals[-1]))
prev_time = time.time()
running_loss = 0.0
end = time.time()
print(f"epoch={epoch + 1}, loss={np.mean(avg_loss):.5f}, time={end - start:.3f}s")
plt.style.use('ggplot')
plt.figure(figsize=(10, 10))
ax1 = plt.subplot(2, 1, 1)
for str_device in ["cpu", "mps"]:
x_ticks = [x[0] for x in interval_hist[str_device]]
y_ticks = [x[1] for x in interval_hist[str_device]]
ax1.plot(x_ticks, y_ticks, label=str_device)
ax1.legend(loc="best")
ax1.set_title("Average step time interval (s)")
ax2 = plt.subplot(2, 1, 2)
for str_device in ["cpu", "mps"]:
ax2.plot(loss_hist[str_device], label=str_device)
ax2.legend(loc="best")
ax2.set_title("Loss curve")
plt.tight_layout()
plt.show()output
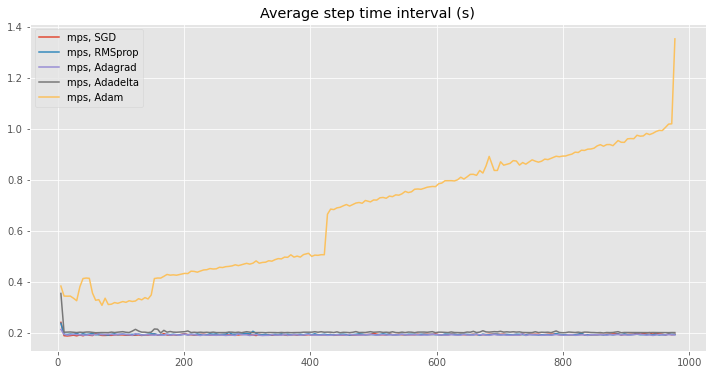
Update 1Interestingly, the increase in time interval seems to only happen to
I have tested the loss calculation difference between |

|
Update: The loop is around 2.4secs if I disable the backward computation and surround the forward loop with |
|
Shameless plug: |
|
This appears to be a memory leak, where PyTorch isn't releasing the references to the Alteratively, you could be continuously retaining a reference to the Python tensor object without releasing that reference. I didn't reading through this thread and the code samples thoroughly, so I probably don't know what I'm talking about regarding this hypothesis. Could you narrow down your code sample to a reproducer that demonstrates this bug, but using way less lines of Python code? |
|
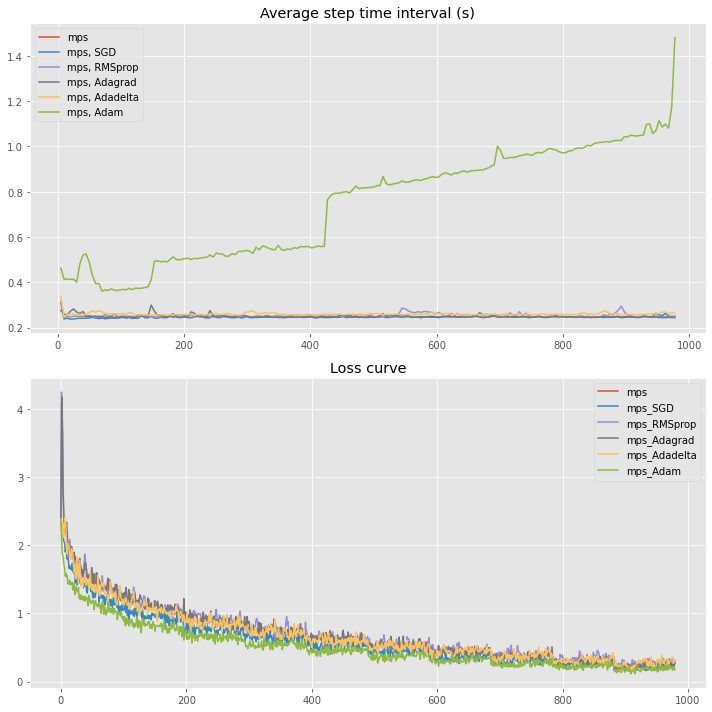
The loss of multiple optimizers are now decreasing the loss value, and the time interval of most tested optimizers remain constant except for pytorch-nightly build
|
|
I think this change will be online in 20220522, the commit is merged 15 hours ago but 20220521 is uploaded 19 hours ago. |
|
Okay, now I updated pytorch-nightly build again ( these are the results |

…#78006) (#78006)

Summary:
Fixes #77753

Pull Request resolved: #78006
Approved by: https://github.com/albanD

Test Plan: contbuild & OSS CI, see https://hud.pytorch.org/commit/pytorch/pytorch/cbdb694f158b8471d71822873c3ac130203cc218

Reviewed By: seemethere

Differential Revision: D36603013

Pulled By: seemethere

fbshipit-source-id: 983df9b73575a0c752490097951932052a96425f
|
Thanks @thipokKub for detailed notes and a repro case. This looks great. |
…#78006)

Fixes #77753

Pull Request resolved: #78006
Approved by: https://github.com/albanD
|
I'm using PyTorch on M1 and the |
…pytorch#78006) (pytorch#78006)

Summary:
Fixes pytorch#77753

Pull Request resolved: pytorch#78006
Approved by: https://github.com/albanD

Test Plan: contbuild & OSS CI, see https://hud.pytorch.org/commit/pytorch/pytorch/cbdb694f158b8471d71822873c3ac130203cc218

Reviewed By: seemethere

Differential Revision: D36603013

Pulled By: seemethere

fbshipit-source-id: 983df9b73575a0c752490097951932052a96425f
…#78006)

Fixes #77753

Pull Request resolved: #78006
Approved by: https://github.com/albanD

(cherry picked from commit cbdb694)
|
I'm experiencing the same behavior (e.g. - increased memory usage and iteration time) on OX X 12.4 with 'MPS' on an AMD GPU. Curiously, the GPU meter is not displaying any activity. Do I need to open a separate issue?
|
|
I reproduced the timing and memory issue with this simple 'utils.dataLoader' example. You can get a copy of the training data file here: https://github.com/SJ001/AI-Feynman/blob/master/example_data/example1.txt Running on the CPU my cProfile results are: Why does {built-in method torch.stack} take so long on the GPU? |
|
Does |
|
torch.stack is called in the default_collate() method with Automatic batching (default).
|

|
Hi, @dbl001 , we use the |
For tensors garbage collection, we follow the Tensor's life-cycle and release the memory back when it goes out of use. |
|
Any clues as to why the computation continues to slow, the process memory continues to grow, then stops. |
|
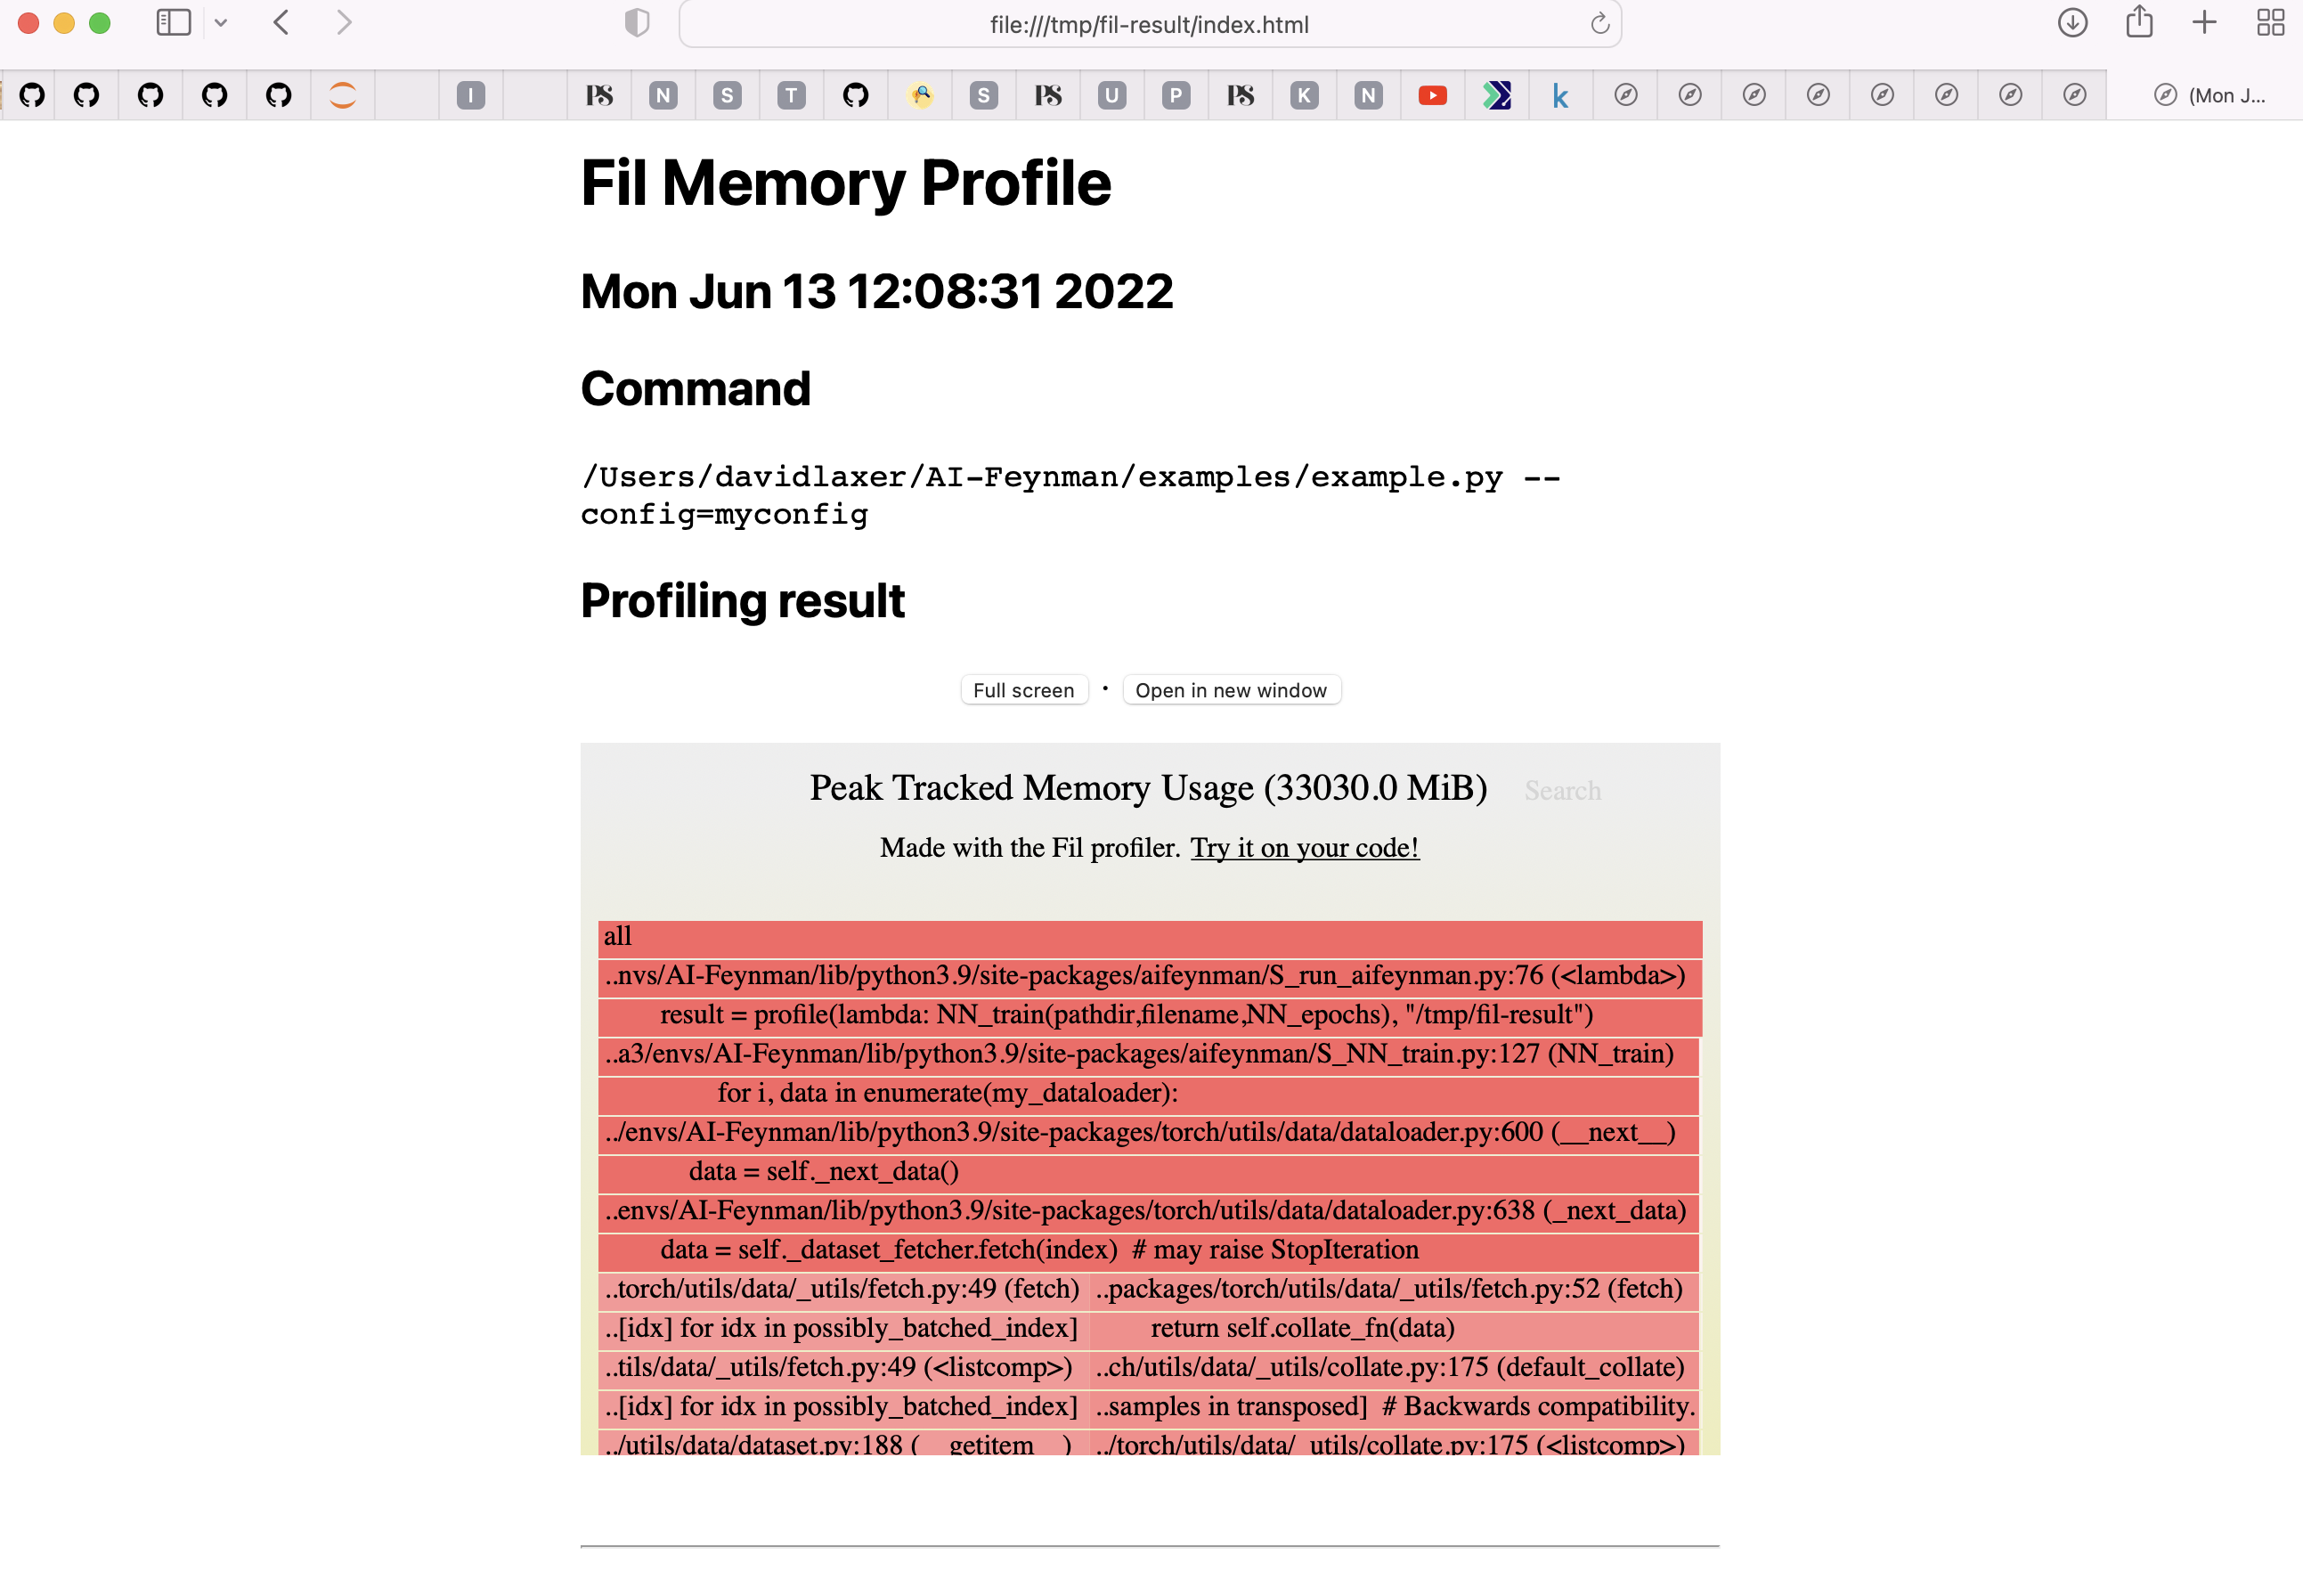
Please find attached the output from |
|
@dbl001 would you mind using a <details>
<summary>File contents</summary>
<!-- Leave a blank line here; delete this HTML comment -->
```
4 KB
4 KB
...
4 KB
```
</details>File contents |
|
Here's the output of Running only the dataLoader to 'mps', currently at process size 11gb. I'll run IOAccelMemory again when it gets to ~48gb. |
First of all, thank you for the MPS backend!
I was trying out some basic examples to see the speed. Below is my code sample (convolutional autoencoder on MNIST).
Output:
This process takes around 150mb memory (and ~19s loop time) when the device is set to cpu. However, when I set it to mps, the memory usage (as I see from the activity monitor) starts from 1gb, and increases up to 7.33 gb (around 8th epoch). Also, the loop time increases from 8.45 secs (1st epoch) to 45 secs (8th epoch). Is there any other practice that I should follow (other than moving tensors and models) if I want to use mps? Also, the same pipeline on tensorflow metal counterpart takes 1.9secs:
I am only posting this to understand the differences. Thanks again for the support 🚀🔥
Versions
PyTorch version: 1.12.0.dev20220518
Is debug build: False
CUDA used to build PyTorch: None
ROCM used to build PyTorch: N/A
OS: macOS 12.3.1 (arm64)
GCC version: Could not collect
Clang version: 13.1.6 (clang-1316.0.21.2.5)
CMake version: version 3.22.3
Libc version: N/A
Python version: 3.8.11 (default, Jul 29 2021, 14:57:32) [Clang 12.0.0 ] (64-bit runtime)
Python platform: macOS-12.3.1-arm64-arm-64bit
Is CUDA available: False
CUDA runtime version: No CUDA
GPU models and configuration: No CUDA
Nvidia driver version: No CUDA
cuDNN version: No CUDA
HIP runtime version: N/A
MIOpen runtime version: N/A
Is XNNPACK available: True
Versions of relevant libraries:
[pip3] numpy==1.22.3
[pip3] torch==1.12.0.dev20220518
[pip3] torchaudio==0.11.0
[pip3] torchvision==0.12.0
[conda] numpy 1.22.3 pypi_0 pypi
[conda] numpy-base 1.21.2 py38h6269429_0
[conda] torch 1.12.0.dev20220518 pypi_0 pypi
[conda] torchaudio 0.11.0 pypi_0 pypi
[conda] torchvision 0.12.0 pypi_0 pypi
The text was updated successfully, but these errors were encountered: