AHI HRIT reader has gotten slower #1384
Comments
|
The only difference I see in the |
|
No, no extra computations. I used a custom scheduler to check that, and both |
|
Are we sure the reader is slower? Maybe the compositing? What about dask versions? Same input storage device? Same timings after repeated executions? |
|
I'm starting to lean on compositing. With simple composites like The weird thing is that the compositing is slow only with With 0.19.1 the support library versions are whatever were current in early November last year. |
|
Maybe it's specific to the composite being used? |
|
I ran the "four Day/Night composites" case again with the custom scheduler. The old version calls For the new version So I'm now thinking it's something in Pyspectral. Fancy indexing or something like that? |
The GOES/ABI |
|
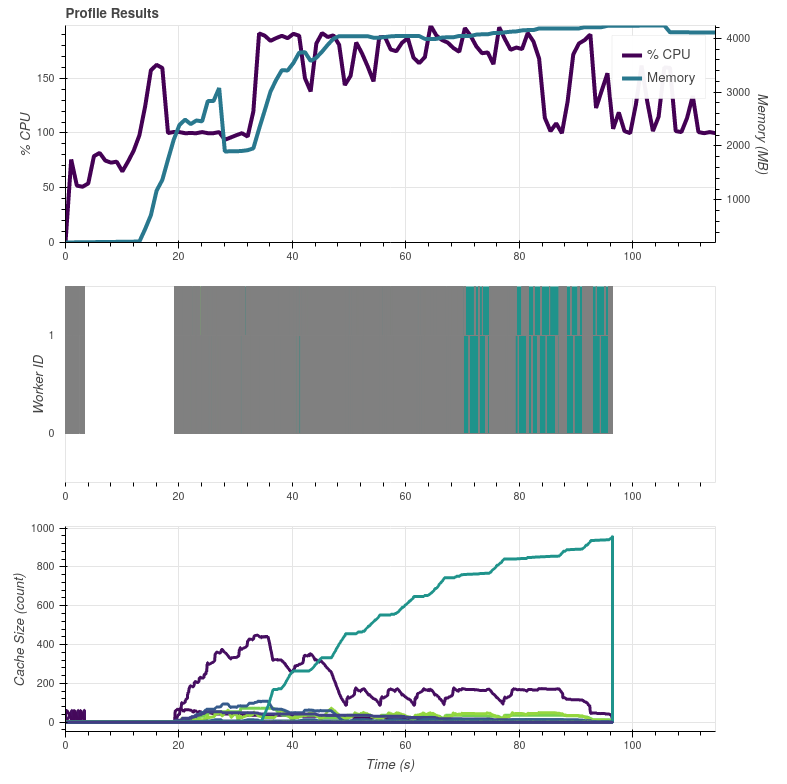
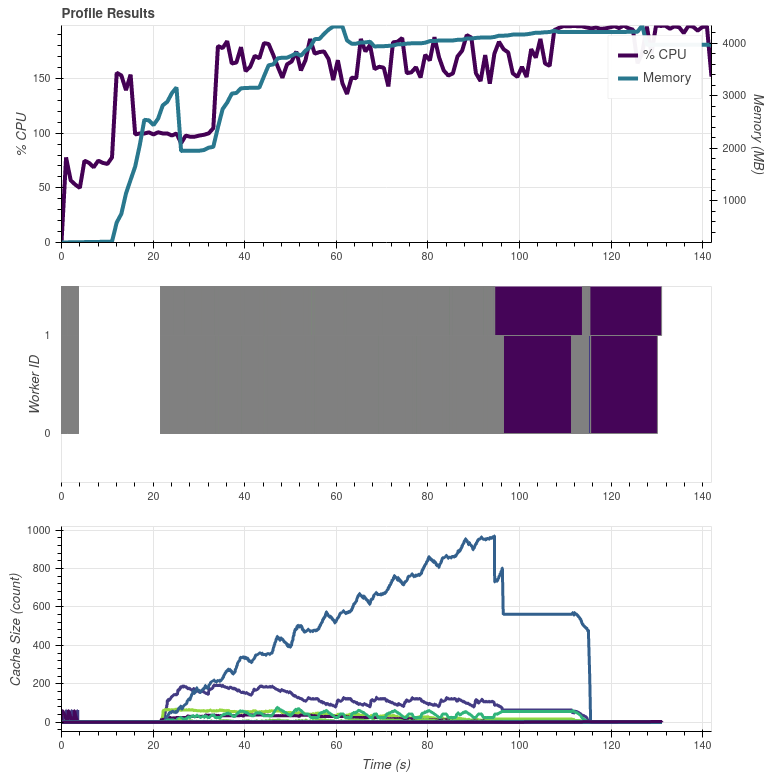
Here are the profiles Dask diagnostics give. With 0.19.1 (Pyspectral 0.9.2): With 0.23.0 (Pyspectral 0.10.0): Two things I notice are the 1 GB higher memory usage and the single CPU usage for much larger time with 0.23.0 after 80 s time has elapsed. |

|
In the above graphs the colorful bits in the end are calls to For both cases the input data are read from the same location (NAS via NFS) and the results are also saved to same location (local |
|
you mention gdal and rasterio, could you try taking them out of the loop by eg writing a png file instead? |
|
Also you show that the reflective part on B07 is used, that's not for true color, right? |
That is for the later case with four Day/Night composites which also have the slowness present. I'm now testing saving to PNG, results in a bit. |
|
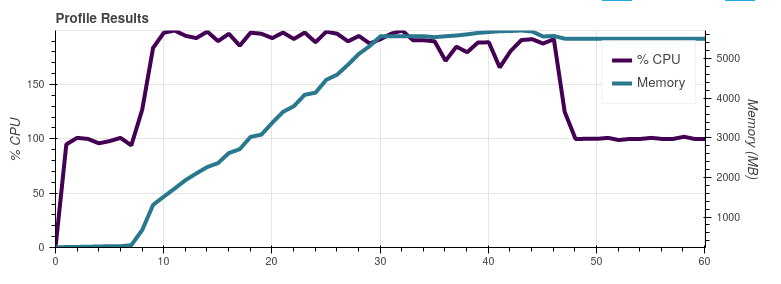
And the profile graphs when saving with Satpy 0.19.1 (142 seconds): |

|
So: |
|
Another thing I'm thinking about: the size of the resulting images is the same right? so it's not compression or something... |
|
There are some minor differences in the filesizes, but nothing really pronounced: The top one is with Satpy 0.19.2, the lower (with seconds in the filenames) is Satpy 0.23.0. |
|
Looking at the images, I think the file size differences are due to minute differences in the blending of Day/Night composites, and change in NIR reflectance (pytroll/pyspectral#112) cutting. |
|
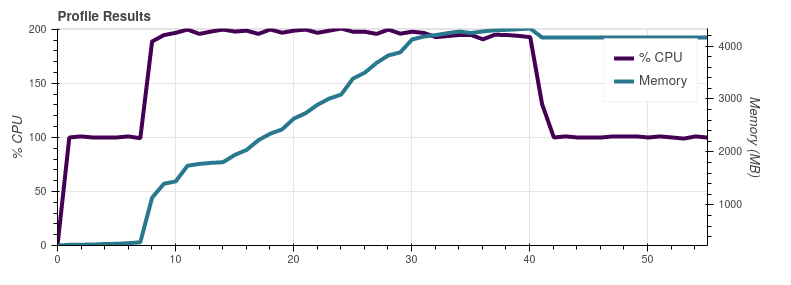
On Slack @mraspaud noticed that commenting out the I did another dask profiler test by commenting out only the Satpy 0.23.0: Satpy 0.23.0 with the So indeed, the These graphs were made on my work laptop with more memory than the server all the previous graphs were made, so apart from the peak memory use these results are not comparable with the earlier ones. |
|
I haven't been completely following this but are the start time and end time produced by the file handler single datetime objects or are they a single (scalar) array of type |
|
The |
|
Currently, with the With the older version where the nominal time is used, all of these had |
|
Couple more tests: Remove fractional seconds start_time = self.acq_time[0].astype(datetime)
return start_time - dt.timedelta(microseconds=start_time.microsecond)-> still slow and uses more memory Remove seconds and fractional seconds: start_time = self.acq_time[0].astype(datetime)
return start_time - dt.timedelta(seconds=start_time.second, microseconds=start_time.microsecond)-> faster and lower memory usage. This verifies that accessing the acquisition times isn't the culprit, but something else. I'll see what happens in |
|
Interesting. Doing (removing seconds and their fractions) start_time = min(x[0].start_time for x in self.file_handlers.values())
start_time = start_time - dt.timedelta(seconds=start_time.second, microseconds=start_time.microsecond)
return start_timein |
|
As far as I can see, all of this happens before the dependency tree is initialized. I'm running out of ideas to test. |
|
Next test: memory profiling |
|
Memory profiling Using Using The number fields are: code line number / memory usage / increase in memory usage for that line. |
|
Interestingly, using |
|
Some more testing. If I load only plain channels without any modifiers, there is practically no difference in processing time. So now I'm suspecting that the time-dependent modifiers ( |
|
Another test. Replacing @property
def start_time(self):
"""Get start time of the scan."""
return self.acq_time[0].astype(datetime)with a static, identical time to the Scene I'm testing, with: @property
def start_time(self):
"""Get start time of the scan."""
return datetime(2021, 12, 8, 6, 0, 20)reduces the memory usage. So it isn't the "extra" seconds compared to the Doing |
|
Ok. Next hypothesis: each of the channel has a very slightly varying |
|
Yes! Removing the composites where
|
|
Adjusting the cache key creation in key = (vis.attrs["start_time"], area_name)to key = (0, 1)should always re-use the cached |
|
How are you determining that things are being recomputed? |
|
Just by my debug prints in I'm getting too tired now for further work, but I'll continue tomorrow if there's nothing more urgent happening |
|
I wonder if the Either way, I asked about computing because there is a chance that if the |
|
Printing the size of |
|
That will likely happen when there are no more handles (reference counts) on the value returned by the dictionary. If we are only using the dask array (which it looks like we are) then maybe when the DataArray version of the cza result is garbage collected it is also removed from the WeakValueDictionary cache. |
|
Yep, the |
|
A simple workaround would be to add a reader kwarg |
|
I went the easy way and made a PR using the |
|
Rounding to the closest second would work here, right? We could even have a flag for the caching that say how long is acceptable |
|
I tried that, but evidently didn't find all the places where |
|
So making sure that the cossza is reused didn't effect performance? And we're still not sure where/how things are going wrong? |
|
No, it didn't affect. Only using the nominal time lowered the memory usage and made the whole processing go faster. |
Describe the bug
Compared to older versions of Satpy, the
ahi_hritreader seems to have gotten very much slower.To Reproduce
in
$PPP_CONFIG_DIR/composites/ahi.yamlin
$PPP_CONFIG_DIR/enhancements/ahi.yamlExpected behavior
Similar timings for the old and new versions. The other chains I've upgraded over the same versions have actually gotten faster. For the full set of composites I got processing times (via Trollflow) of around 10 minutes. With the new version(s) the process crashes around 28 minutes when the memory runs out.
Actual results
For Satpy 0.19.1:
49.9 sFor Satpy 0.23.0:
59.2 sEnvironment Info:
0.19.1and0.23.00.9.2and0.10.0The text was updated successfully, but these errors were encountered: