Certain composite images not plotting correctly using imshow - but they are fine using scene.show()
#2414
Comments
|
See https://github.com/pytroll/tutorial-satpy-half-day/blob/main/notebooks/05_composites.ipynb and the use of "get_enhanced_image". I'm on mobile right now so can't easily type all the details. If needed, I can write something longer tomorrow. |
|
Thanks a lot for the quick reply @djhoese - For completeness, the working code snippet is: # read data into scene object, load composites, resample
scn = Scene(filenames=filename,reader='modis_l1b')
scn.load(['dust'])
scn_r = scn.resample('northamerica', radius_of_influence=5000)
# get image data using `get_enhanced_image` method
img_r = get_enhanced_image(scn_r['dust'])
img_r_data = img_r.data
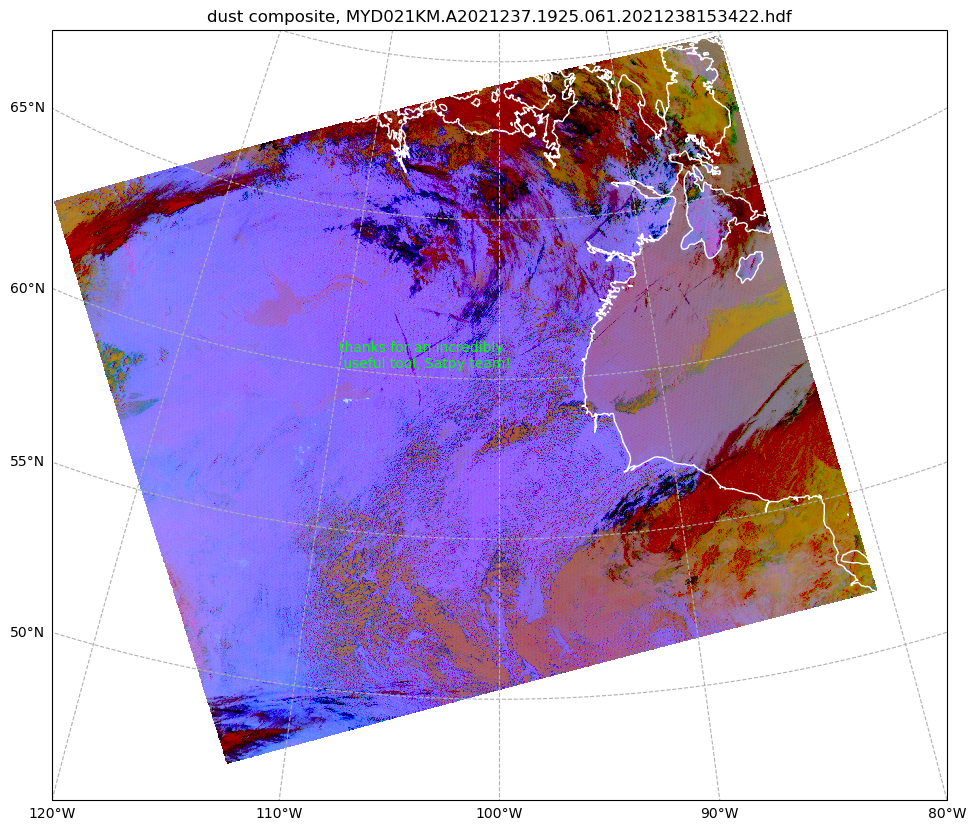
# plot using imshow method (the resulting image is shown below)
crs = scn_r['dust'].attrs['area'].to_cartopy_crs()
fig = plt.figure(figsize=(16, 10))
ax = fig.add_subplot(1, 1, 1, projection=crs)
ax.coastlines(resolution="10m", color="white")
ax.set_extent([-120, -80, 45, 70])
gl = ax.gridlines(draw_labels=True, linestyle='--', xlocs=range(-120,-70,10), ylocs=range(50,75,5))
gl.top_labels=False
gl.right_labels=False
gl.label_style={'sizeb':14}
img_r_data.plot.imshow(ax=ax, rgb='bands', vmin=0, vmax=1, transform=crs, extent=crs.bounds, origin="upper")
#to add text at a specified lon,lat:
ax.text(lon, lat, textstring, color='lime', transform=cartopy.crs.PlateCarree())
ax.set_title('dust composite, '+str(filename[0]))
plt.show()The resulting plot looks like this - exactly what I was hoping for!
Thanks again to you and the Satpy & Pytroll team for all your hard work with these tools. |
|
Glad it worked...but you reopened the issue? Is something else wrong? |
|
Sorry, my mistake - closing it now! |
Sign up for free
to join this conversation on GitHub.
Already have an account?
Sign in to comment
Describe the bug
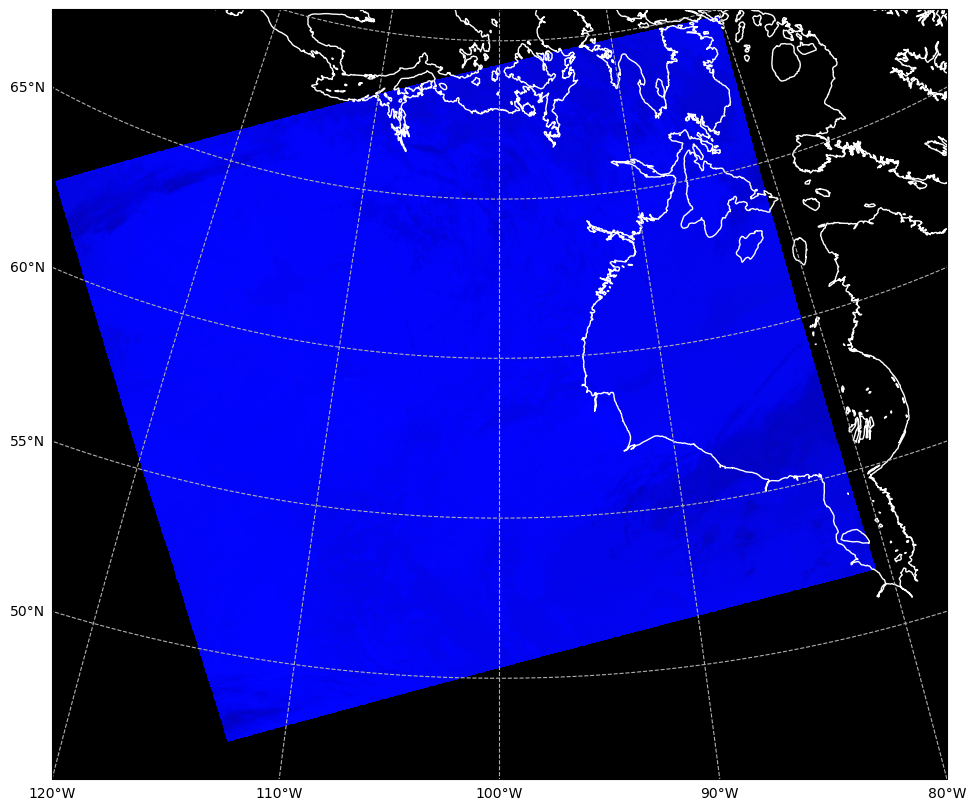
I am getting strange results when trying to plot the 'dust' composite using the
imshowmethod. The composite looks as I expect if usingscene.show('dust'), but when passed to imshow the colours are wrong. The same behaviour is also occurring with the 'airmass' composite. However, there is no such issue for the 'natural_color' composite (i.e. the plots generated usingscene.show('natural_color')andimshowlook the same).This issue is demonstrated in detail in the notebook here (only dust and natural_color composites are compared). I originally encountered this issue using MODIS L1B (MYD021KM) files, but have since reproduced it using MSG4 L1B HRIT files too.
Apologies if this is something that is arising due to user error - I am new to satpy!
To Reproduce
A file that I have been working with can be downloaded here, filename = 'MYD021KM.A2021237.1925.061.2021238153422.hdf'.
The full code I am encountering the issue with is detailed in the notebook linked above, but in brief my workflow is:
Expected behavior
I expect the images produced using the two methods to be broadly similar, however the colours are totally different.
Actual results
(shown in screenshots)
Screenshots

image 1. output from scene.show() method:
image 2. output from imshow method:
Environment Info:
from satpy.utils import check_satpy; check_satpy()] Relevant output below:Additional context
This issue occurs if I am working in a .ipynb Jupyter notebook file and also if I run the code as a .py file using the Spyder IDE.
The text was updated successfully, but these errors were encountered: