Transferring a renderer of a Plotter object to a renderer of a Plotter object with subplots (plotter.set_renderer) #2675
Comments
|
Hi and welcome! Thanks for posting your first issue in the PyVista project! Someone from |
|
This is a cool feature request! I'm not sure how much work would be involved to get this working 100% but it should be doable |
|
Here's a way I found to (mostly) achieve this using The following function will take multiple plots as input, create a new plotter with subplots, and copy each input plot's actors into a separate subplot. import pyvista as pv
def create_multiplot_from_plotters(*plots: pv.Plotter, shape=(1, 1), link_views=False) -> pv.Plotter:
# initialize plotter (also validates shape type/value)
multiplot = pv.Plotter(shape=shape)
# check that num plots is compatible with plotter shape
_render_idxs = multiplot.renderers._render_idxs
num_plots = len(plots)
num_subplots = _render_idxs.size
if num_plots != num_subplots:
raise ValueError(f"Number of plots ({num_plots}) must match the number of subplots from shape {shape}.")
# add actors to subplots
for idx in range(num_plots):
loc = multiplot.renderers.index_to_loc(idx)
multiplot.subplot(*loc)
# "copy" plot to multiplot by adding its actors
actors = list(plots[idx].actors.values())
[multiplot.add_actor(a) for a in actors]
multiplot.reset_camera()
if link_views:
multiplot.link_views()
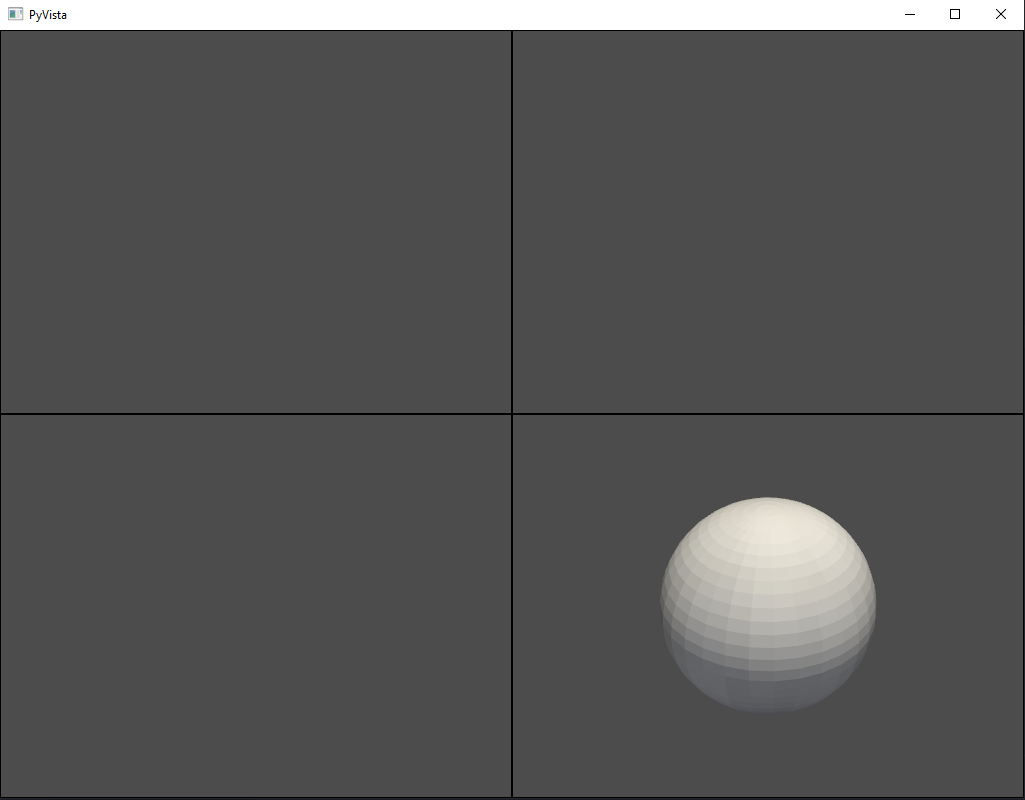
return multiplotTo do what OP is asking for (i.e. copy a plot to a second plot), simply pass the plot several times as inputs. To plot four copies of the same plot in a 2x2 grid: p = pv.Plotter()
p.add_mesh(pv.Sphere())
mp = create_multiplot_from_plotters(p, p, p, p, shape=(2,2))
mp.show()
We can make this a bit more interesting by creating a more general plotter-making function that takes multiple meshes as input and adds then to a plotter: def create_plotter(*meshes, colors=None, opacities=None, title=None):
# create plotter with multiple meshes in one scene
# initialize plotter
plot = pv.Plotter()
if title is not None:
plot.add_title(title)
if colors is None:
colors = [None] * len(meshes)
if opacities is None:
opacities = [None] * len(meshes)
# add meshes to plot
for i, mesh in enumerate(meshes):
plot.add_mesh(mesh, color=colors[i], opacity=opacities[i], show_edges=True)
return plot
p1 = create_plotter(pv.Sphere(radius=5), colors=("red",), title="1st")
p2 = create_plotter(pv.Sphere(), pv.Sphere(center=(1,0,1)), colors=("green","purple"), title="2nd")
p3 = create_plotter(pv.Cube(), colors=("blue",), title="3rd")
p4 = create_plotter(pv.Pyramid(), pv.Cone(center=(1,1,1)), colors=("yellow","orange"), title="4th")
mp = create_multiplot_from_plotters(p1, p2, p3, p4, shape=(2,2))
mp.show()
For a more realistic use case comparing two similar meshes (e.g. a before/after comparison, similar to the Linked Views in Subplots Example, you can run the following full code example: import pyvista as pv
from pyvista import examples
pv.set_plot_theme("document")
def create_multiplot_from_plotters(*plots: pv.Plotter, shape=(1, 1), link_views=False) -> pv.Plotter:
# initialize plotter (also validates shape type/value)
multiplot = pv.Plotter(shape=shape)
# check that num plots is compatible with plotter shape
_render_idxs = multiplot.renderers._render_idxs
num_plots = len(plots)
num_subplots = _render_idxs.size
if num_plots != num_subplots:
raise ValueError(f"Number of plots ({num_plots}) must match the number of subplots from shape {shape}.")
# add actors to subplots
for idx in range(num_plots):
loc = multiplot.renderers.index_to_loc(idx)
multiplot.subplot(*loc)
# "copy" plot to multiplot by adding its actors
actors = list(plots[idx].actors.values())
[multiplot.add_actor(a) for a in actors]
multiplot.reset_camera()
if link_views:
multiplot.link_views()
return multiplot
def create_plotter(*meshes, colors=None, opacities=None, title=None):
# create plotter with multiple meshes in one scene
# initialize plotter
plot = pv.Plotter()
if title is not None:
plot.add_title(title)
if colors is None:
colors = [None] * len(meshes)
if opacities is None:
opacities = [None] * len(meshes)
# add meshes to plot
for i, mesh in enumerate(meshes):
plot.add_mesh(mesh, color=colors[i], opacity=opacities[i], show_edges=True)
return plot
def plot_before_after(before, after):
p1 = create_plotter(before, colors=("blue",), title="Before")
p2 = create_plotter(before, after, colors=("blue", "yellow"), opacities=(1, 1), title="Comparison")
p3 = create_plotter(after, colors=("yellow",), title="After")
return create_multiplot_from_plotters(p1, p2, p3, shape=(1, 3), link_views=True)
mesh = examples.download_cow()
decimated = mesh.decimate_boundary(target_reduction=0.75)
mp = plot_before_after(mesh, decimated)
mp.camera_position = [(15, 5, 0), (0, 0, 0), (0, 1, 0)]
mp.show()
|


Describe the feature you would like to be added.
I have an idea for a new feature! I do not know if this is possible, but I have done something similar in matplotlib, if more details are needed.
Here is a simplified example of how it would work. In my real example, it would be a pain to regenerate the data for the second plotter.
Let us say you generate a plot in a Plotter instance:
import pyvista as pv
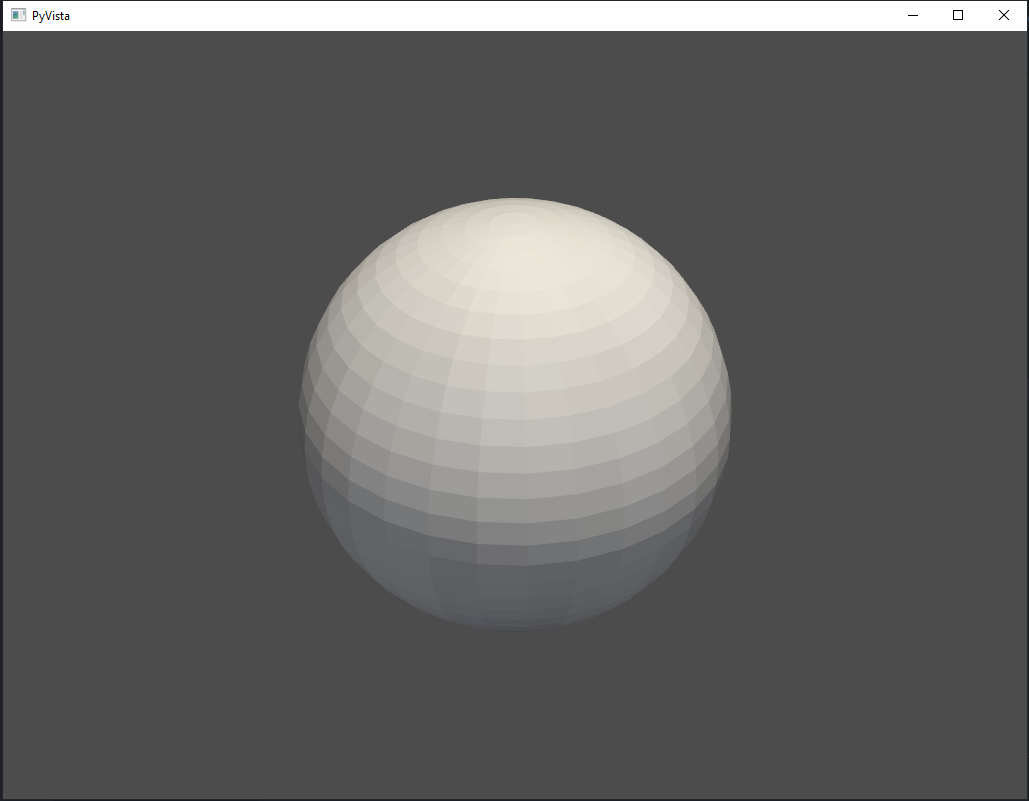
p1 = pv.Plotter()
p1.add_mesh(pv.Sphere())
p1.show()
Now, I want to transfer the information from plotter 1 to another Plotter instance with subplots.
p2 = pv.Plotter(shape=(2,2))
p2.subplot(1,1)
p2.set_renderer(p1.render)
p2.show()
Links to VTK Documentation, Examples, or Class Definitions.
No response
Pseudocode or Screenshots
Or drag your screenshot here!
Code of Conduct
The text was updated successfully, but these errors were encountered: