This repo contains the code needed to retrieve all the data from Transport API(Only working for United-Kingdom trainstation), display all the departures at a station, update an SVG template before pushing it to a Waveshare 5.83" E-ink display.
Note that the code has only been tested on the specific hardware mentioned and 3 customization is necessary to work with another E-Ink display.

A few weeks ago, I was really interested in the E-Ink display after I saw this post.

I was totally in love with the flat design, the extremely low power consumption (26.4mW at refresh for the Waveshare screen) and this paper effect.
And in the same time, I was also curious in Python so... let's go ? I took the first API I could find on DuckDuckGo, bought an E-ink screen and during the time it took to arrive, I had time to think and design how I wanted to display the data.
So, first time I made my own project with a Raspberry Pi (instead of following some tutorial for a mediacenter, etc..), first time with Python and first time with an API.
- Raspberry Pi Zero WH - Header pins are needed to connect to the E-Ink display
- 5.83inch E-Paper E-Ink, Black / White
Python: 3.7.3
Application needed: Inkscape 1.01
Librairies needed: gpiozero, Pillow, numpy, requests, RPi.GPIO, spidev
For the moment, the script needs to be launched manually, but I think you can easily set it to launch at boot.
This is how the script is executed:
- Agenda Update: To avoid requesting a large number of requests (limited to 1000 by the API), I implemented a schedule that is configurable in "config.json" to set the times and the screen refresh interval and data.
- Data requests: Request all the departures at the station and associated timetable and keep a simplified version of both of them.
- Node Tree: Create or update the map of train stations with the geolocation of the train station.
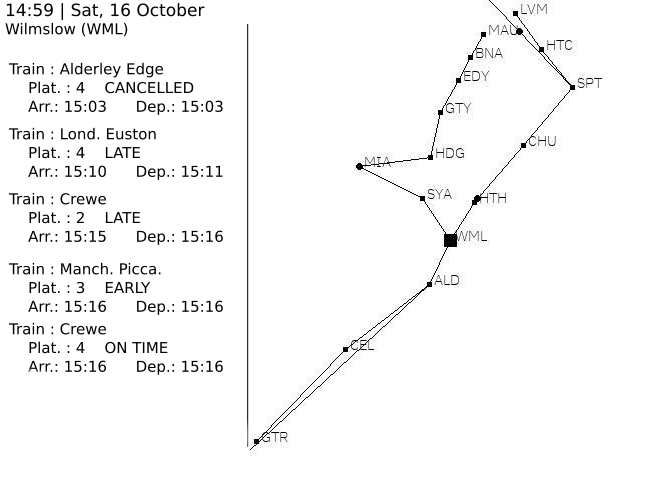
- Image creation: Update the SVG template, create a map of the train station (represented with ■ ) and the approximate train position ( ● ) and merge the two result
- Final behaviour: Display the result on the e-ink screen and sleep until the next update, the screen refresh, the agenda update or the data request.
I'm happy with the current state, I'll continue this project in a month or two (or if someone hires me in England, I say that, I say nothing ☻).I let it run for 48 hours, without any crashes and on 2 different stations (Wilmslow and Manchester Piccadilly).
However, there are just 2 minor problems at the moment, the name of some stations with a name that is far too long and the node tree who can't see if a station is on the same line between 2 stations but for this case, I think I'm limited with the API but I should check more precisely.

"I'm freeee"
And one non-problem I would like to change, is to retrieve an anchor in the SVG template, with the parameters of the box size, to allow a full customization with Inkscape, to easily change of screen and to only change the Waveshare EPD librairie.