@YaleClimateCommconduct research on public climate change knowledge, attitudes, policy support& behavior
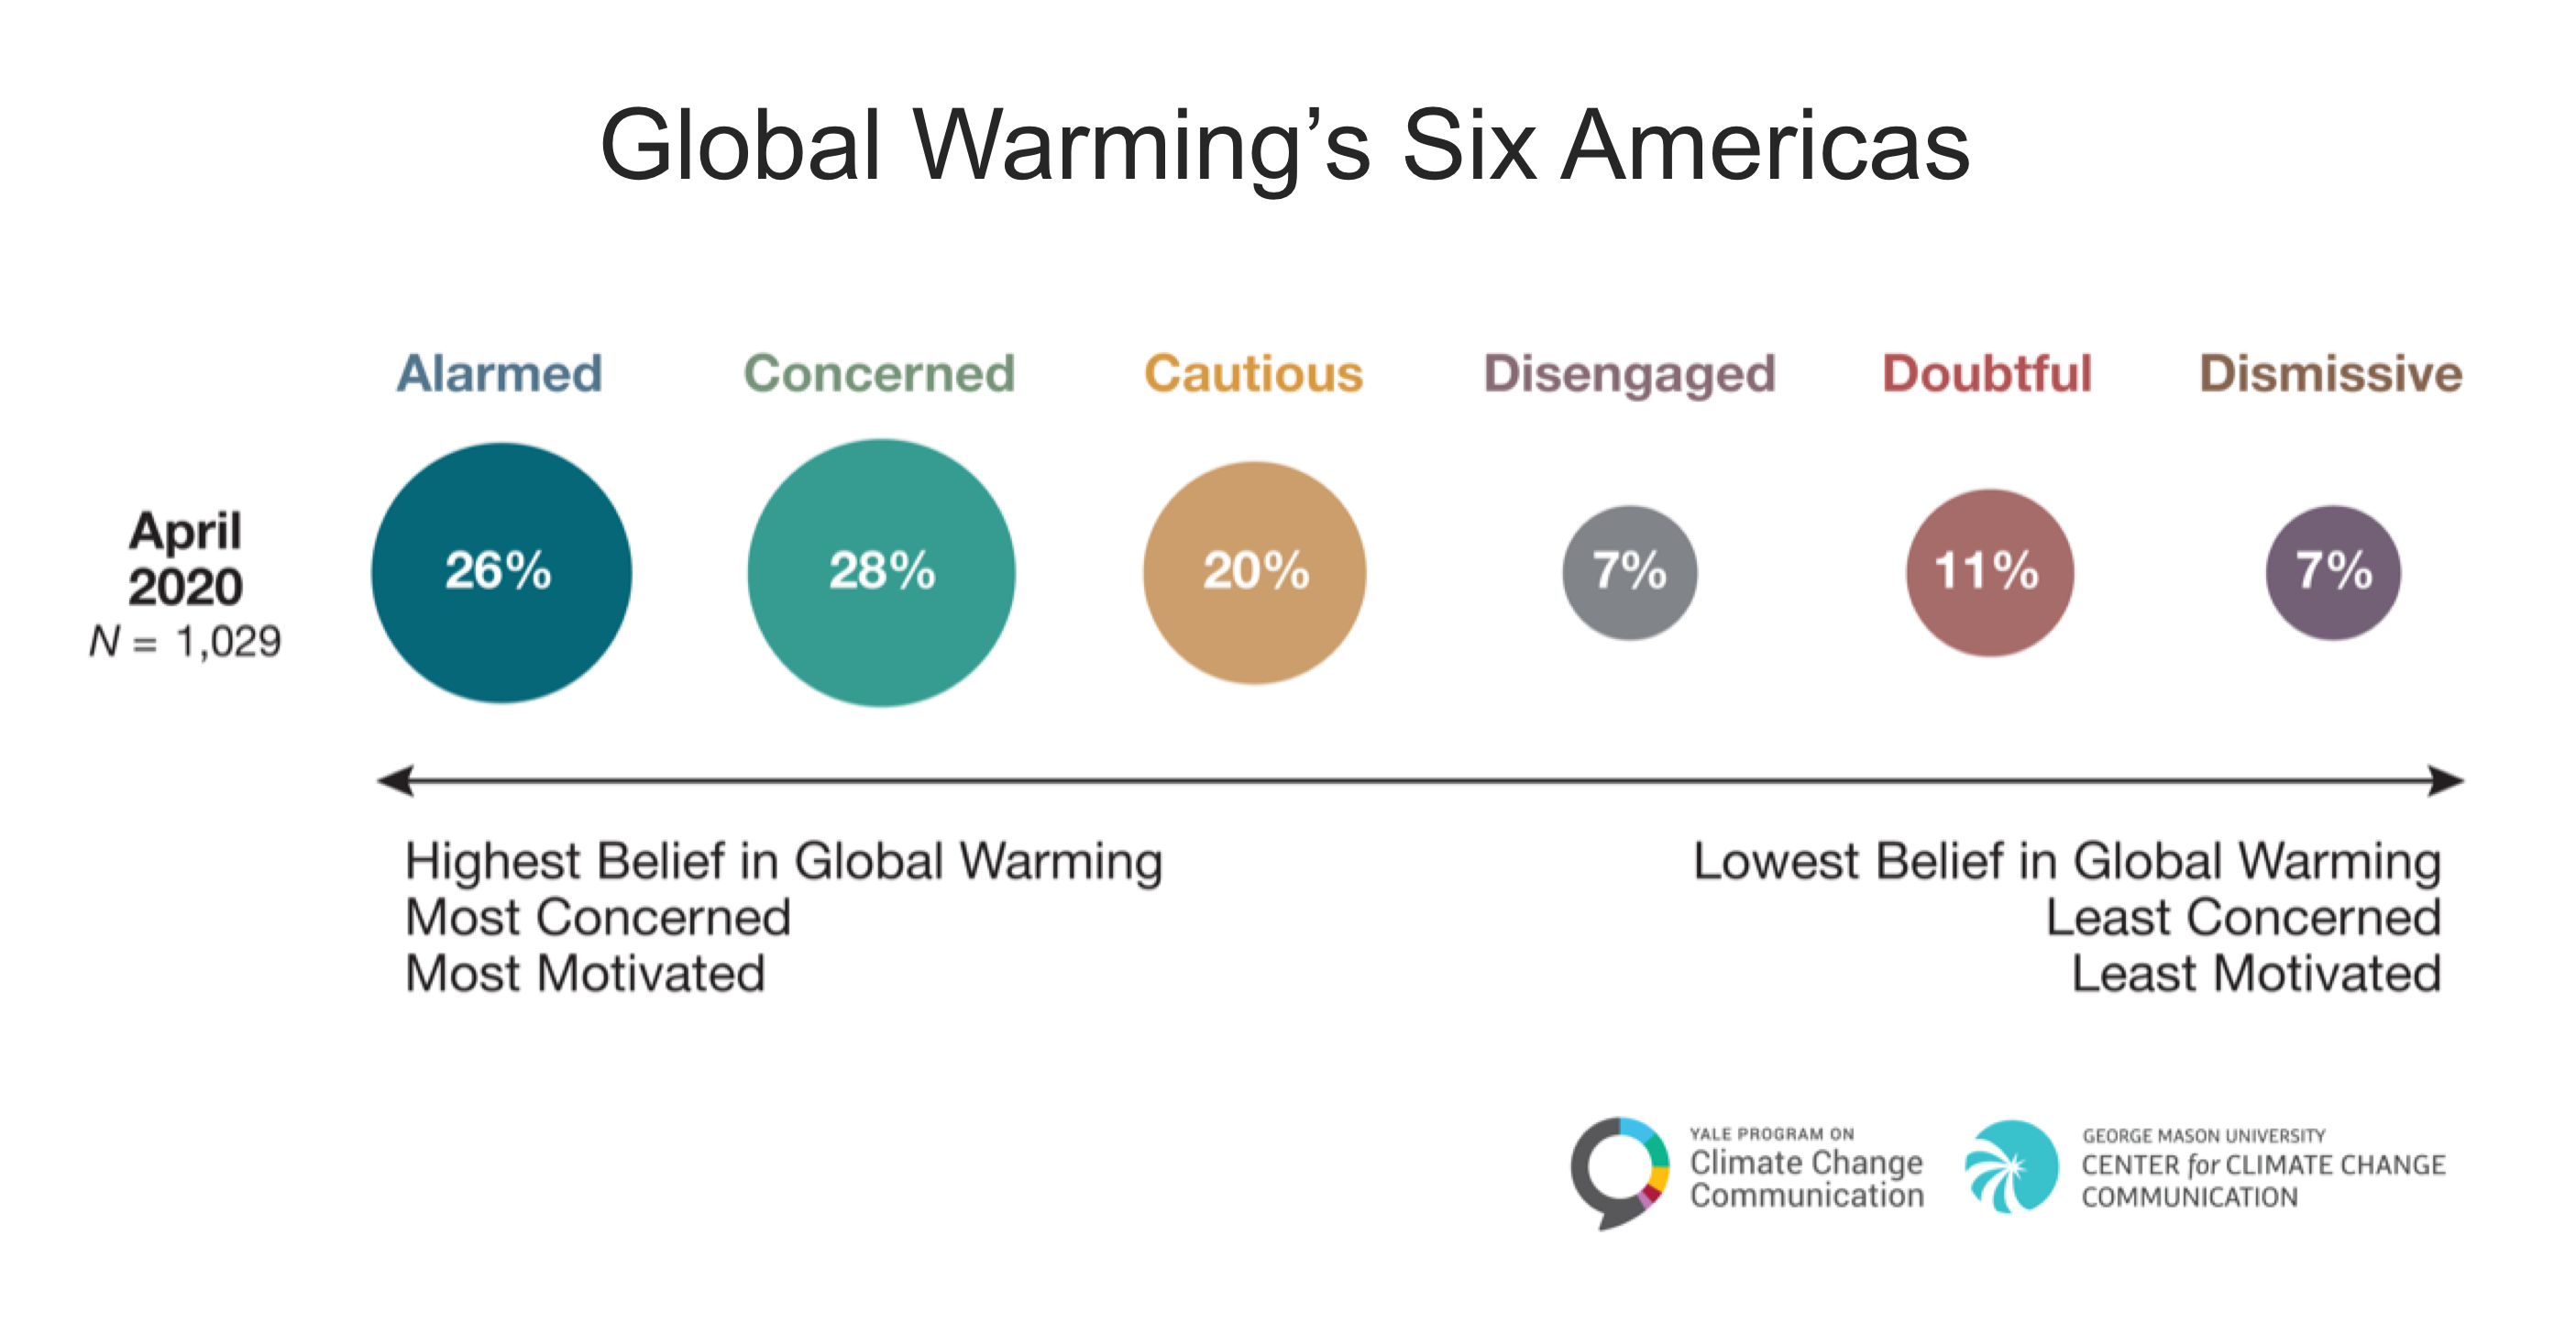
- Read more from the source
- Takeaways
- 2D plots are not intuitive for comparisons like this
- Barplots are just fine
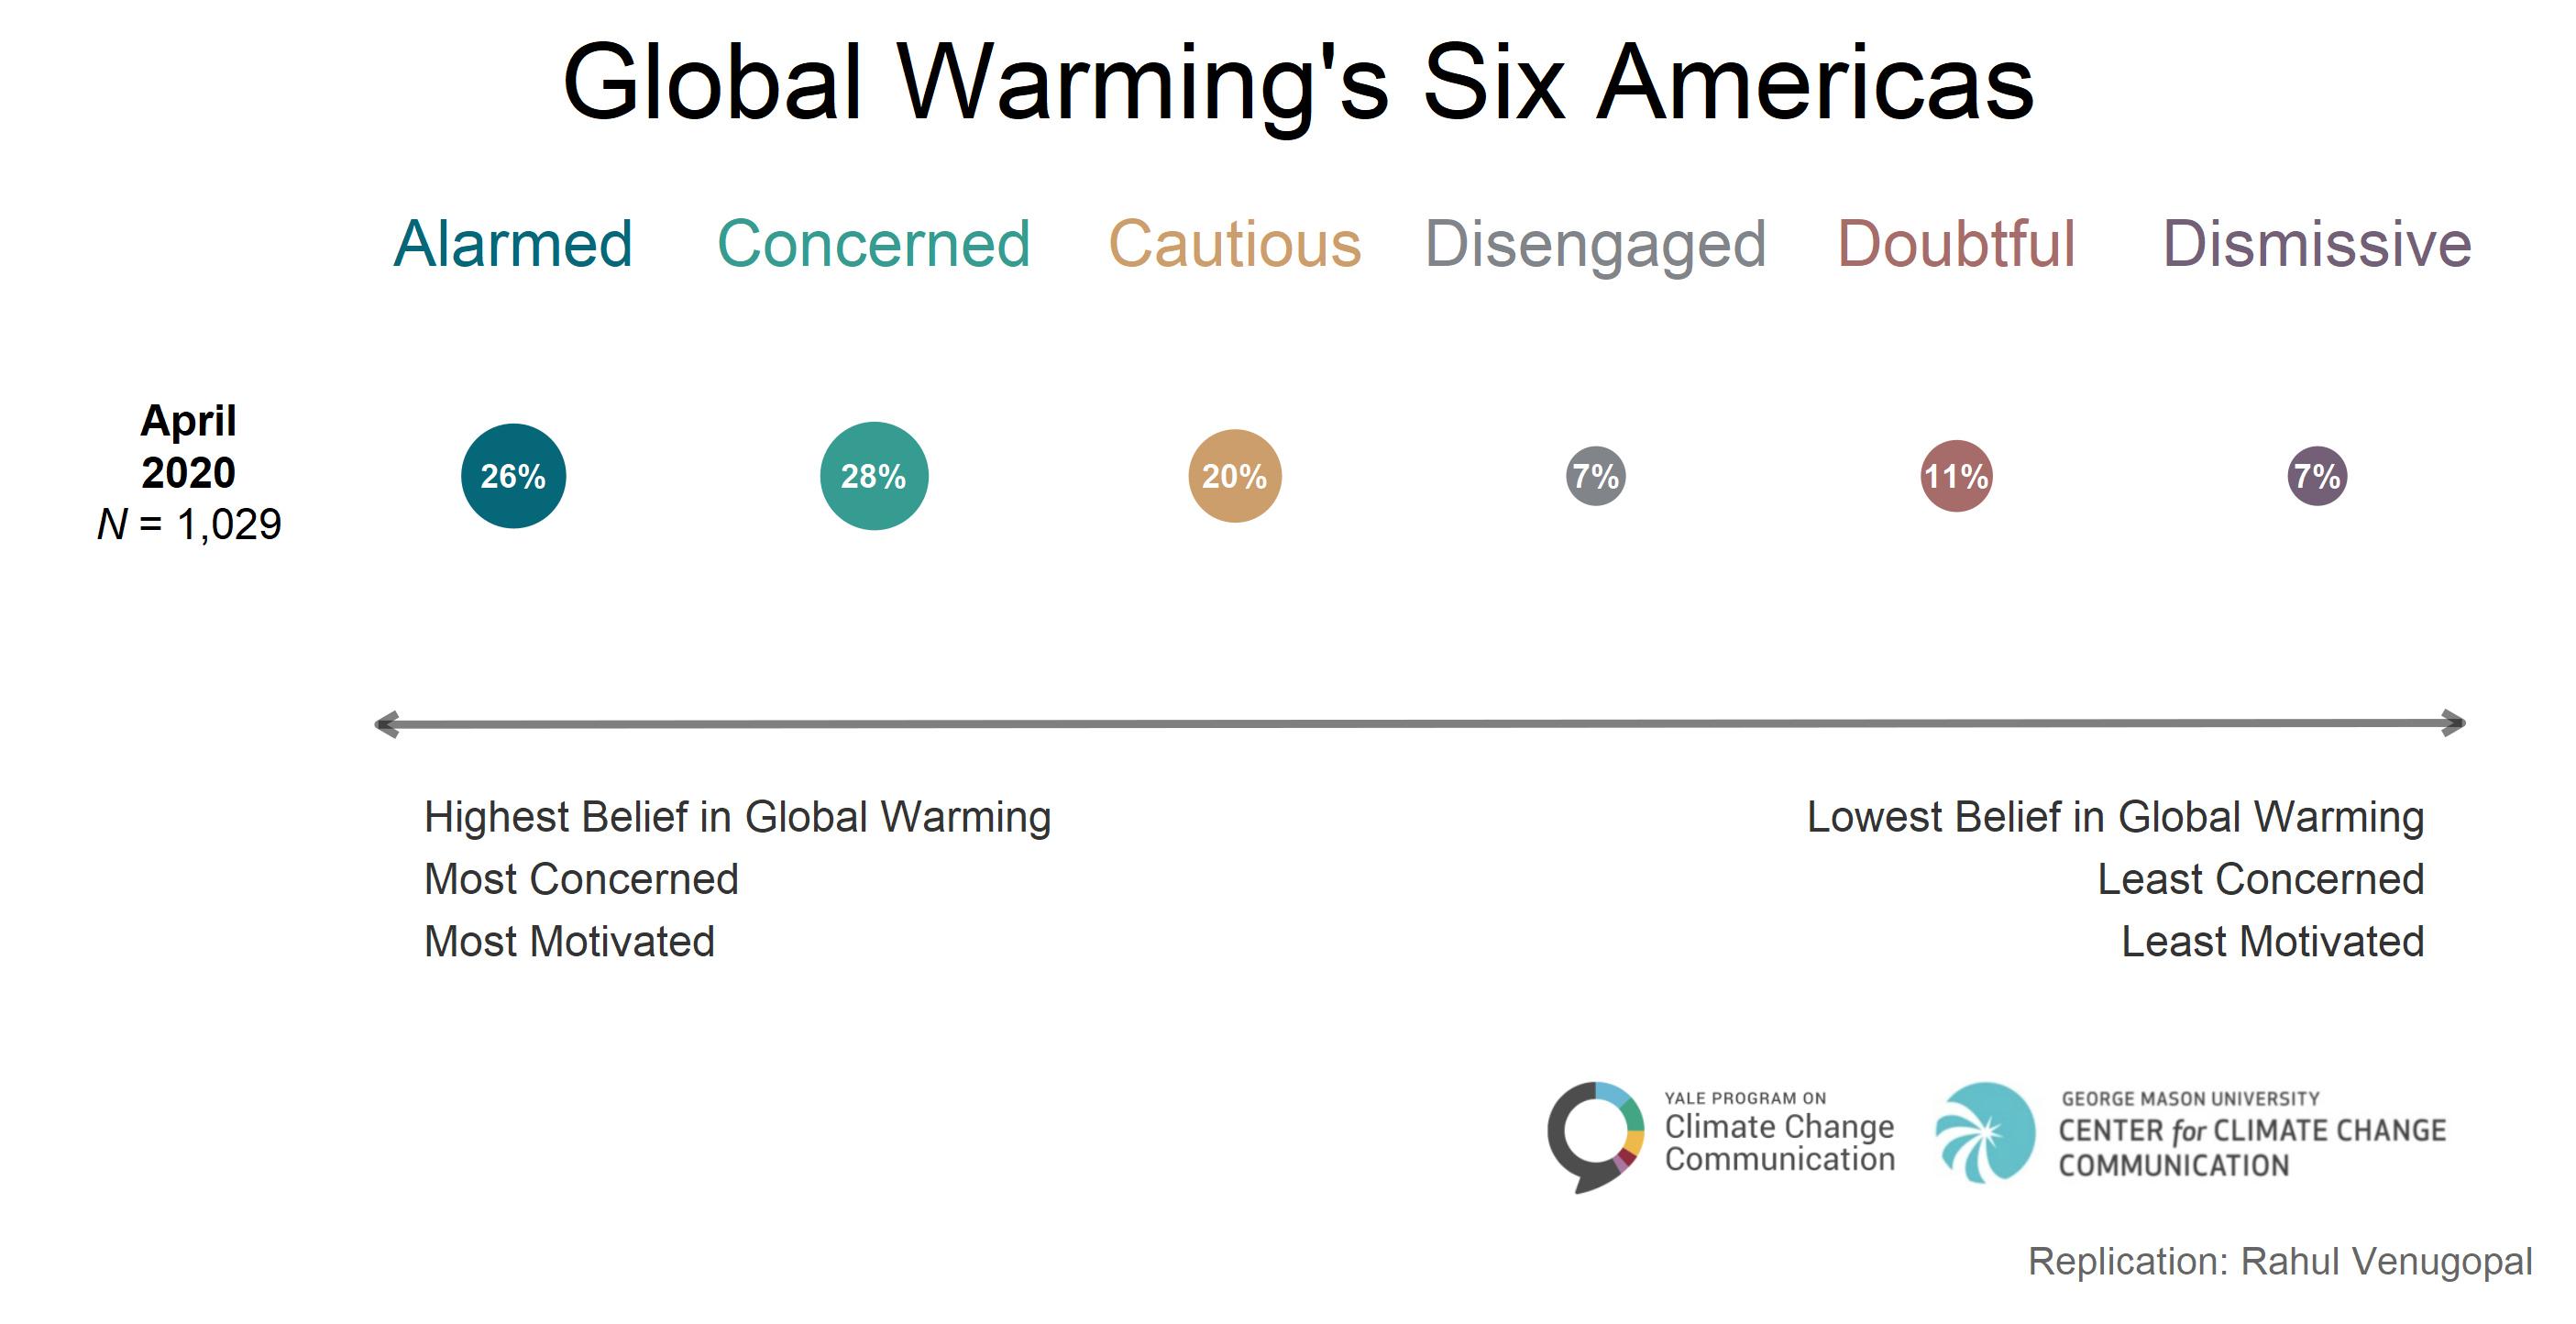
- Spotted that the areas were wrongly scaled! Have asked twitter world and @azandisarietta was generous in helping out
- I missed mapping the size variable inside aes() and was trying to assign size parameter inside geom_point
- Came to know about a python program to detect circles in an image (added to repo)
- I saw this post and wanted to replicate and extend this
- Tanya Shapiro has contributed lots of
TidyTuesdayvisualizations - For this endeavor, I referred the Scooby doo and Docto who submissions from her


- Used Image color picker to grab the color palette of original viz
- Reddit posts about the source viz : this and this
- Github emjo cheatsheet
- How to insert special symbols to text
- To combine geom_line and geom_point when x variable is categorical
- Vertical gradient
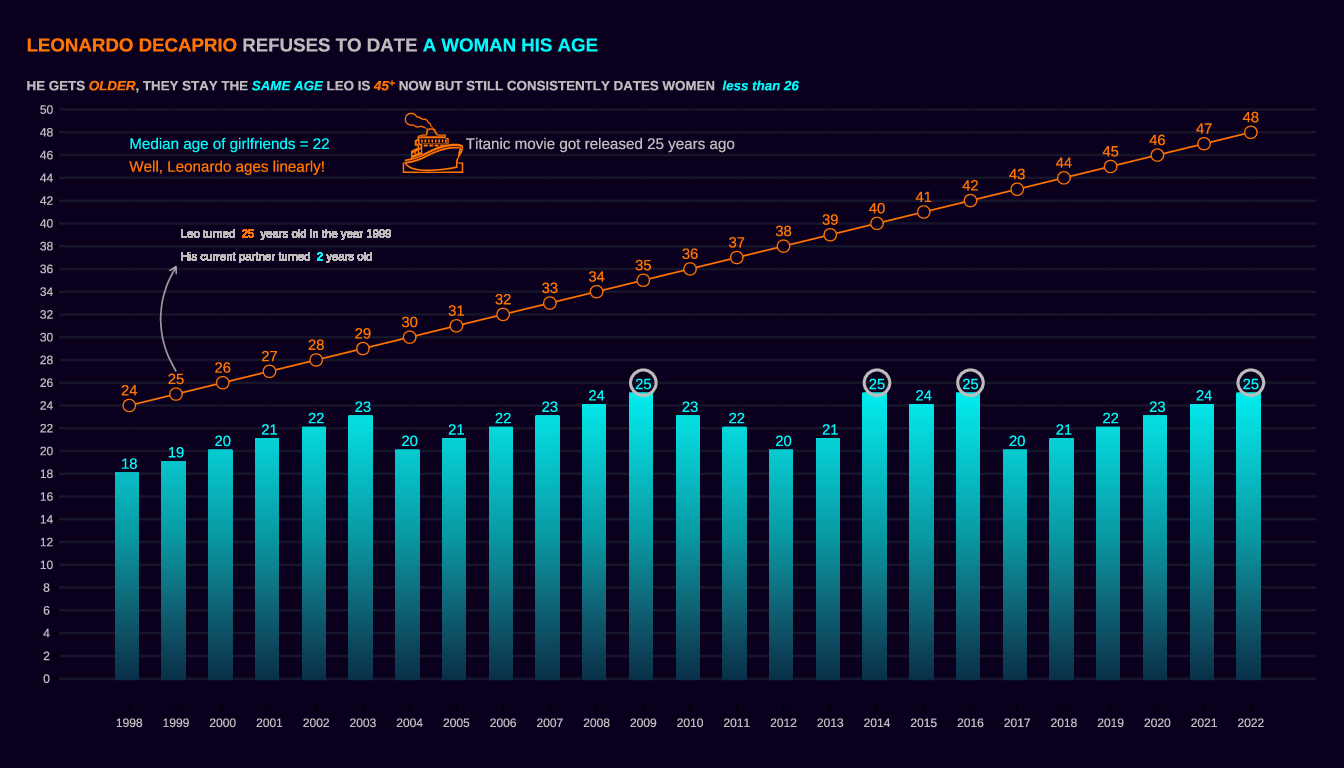

- SWD data viz makeovers attempted by Albert Rapp using ggplot2 in R
- Watch the video for the narrative

