 Data looked like this
There were three groups. Electrophysiology parameter was measured every 30 seconds This data came from multiple slices from multiple animals
Typically this is the way many researchers plot

Weird graphing softwares add their horrible palettes with meshes and grids. With more than 4 groups the entire visualisation gets muddy 😩
Enter seaborn + matplotlib. 
Code updated here
Things I learned from this dataviz
- Melting dataframes
- Color palette customisation
- Adding background fills
This set was just an average, quick and dirty requirement
There were heaps of excel sheets and need of the hour was box+point plots across two groups
Graphs were not visually pleasing 😩 But the job was done!

Data looked like this

Code here
Things I learned from this dataviz
- My first box+strip plot
- I could bring a smile to the person who had only 1 hour left to do entire graphing
- learned how to pick data from multiple columns, generate plot, save and loop
Yet To Do
- Removing one label
- Color palette customisation (learned it later)
- Learn how to automate creating a large csv from multiple based on some logic
There were ~100s of excel files which had to be converted to PDF
This was more of a challenge than utility hack
Things I learned
- Came across this opensource and free utility called wkhtmltopdf
- File converting was fun :happy:
To Do
- Styling of dataframe for a highlighted and aesthetic html
- Similar converters for .doc and .docx files

Data looked like this
Data had Groups column with 2 levels, Intervention with 2 levels, Recording time point 2 levels and Phase with 2 levels
As a combination there were 12 group combinations
Phase levels (Light and Dark were exclusive)
So, the idea was to represent Phase levels using color (Hours 0-12 with light color and 12-24 in dark color)

That leaves 6 groups to plot

I will leave out some attempts to capture all groups in a single plot. Far from complete 😒

The color palette is not standing out in background. The CI skirts are swallowed 😒

Phase(Light and Dark are captured) but no group info 😒
Got back to this Viz. Created a gridplot using patchwork
Linetypes captures BL vs PE
Linecolor captures four groups - Group+Intervention

Got the plot to work after some brainstorming!
Patchwork to rescue to stitch four plots

Detailed documentation provided in script plotsleep_fourcol.R
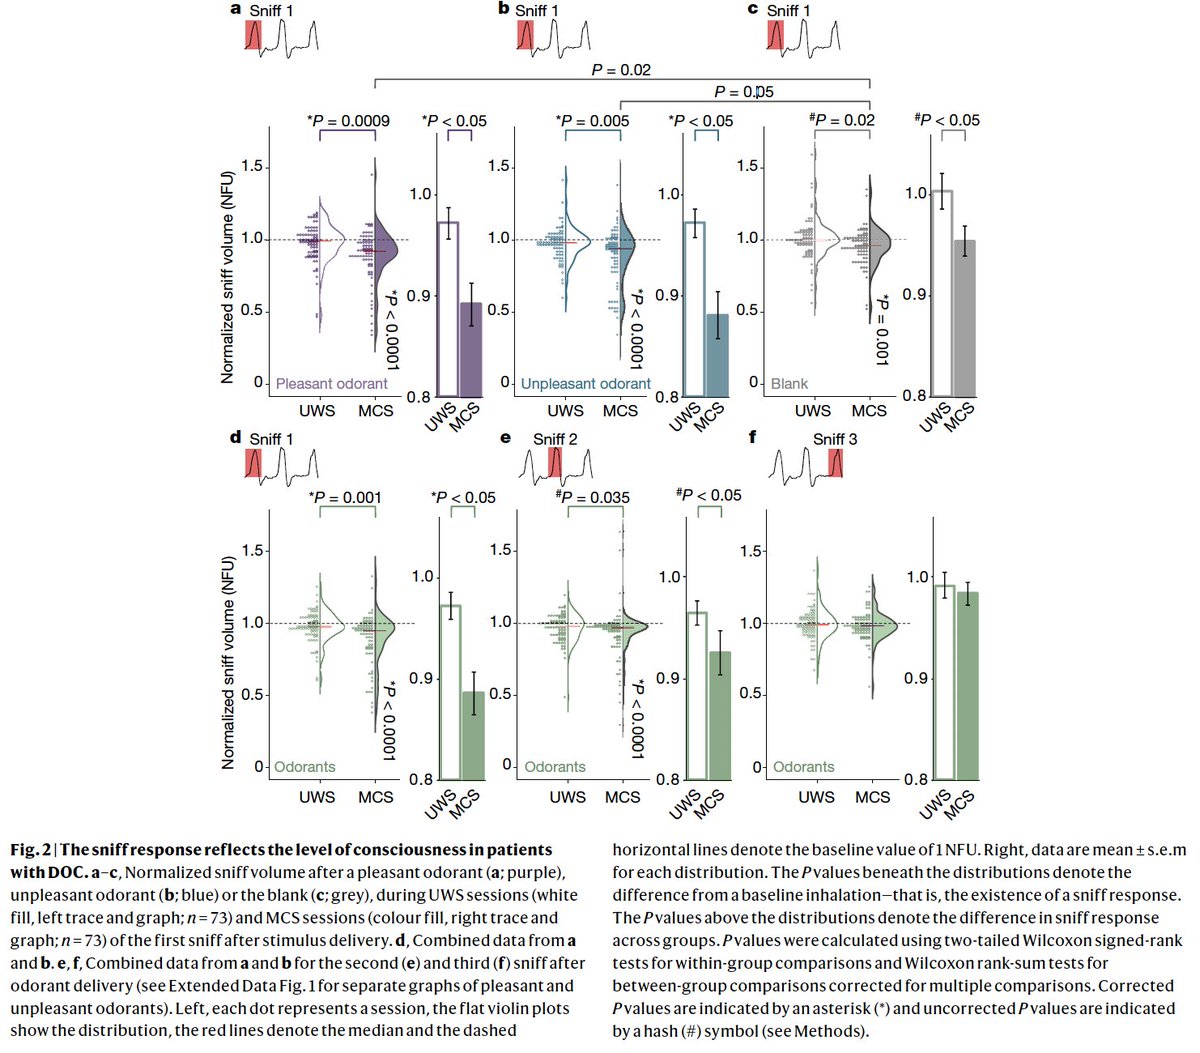
I was inspired by the plot from Anat Arzi's recent nature paper
- We had four groups
- Reordered the x-axis sequence
- Custom color palette
- New tricks from Cederic Scherer's talk
- ggtext based styling
Code is here


- Count of participants from various countries
Code is here


Code is here
 Code is here
- Adding geom_line from one dataset
- Adding geom_point from another dataset
 Code is here

- Connection lines colored based on slope
- Annotations using greek letters and mean
- Sample sizes per group added above x-axis
- Custom coloring and styling
 Code is here

- A better version from above v1
 Code is here

- Keep the y axis title
- Keep the y-axis scale same for both graphs on left and right
- Noticed one bug which takes the first colour by default when all lines are having only one type of slope (TRUE or FALSE)
- As a quick fix keep the first color which represents all slopes
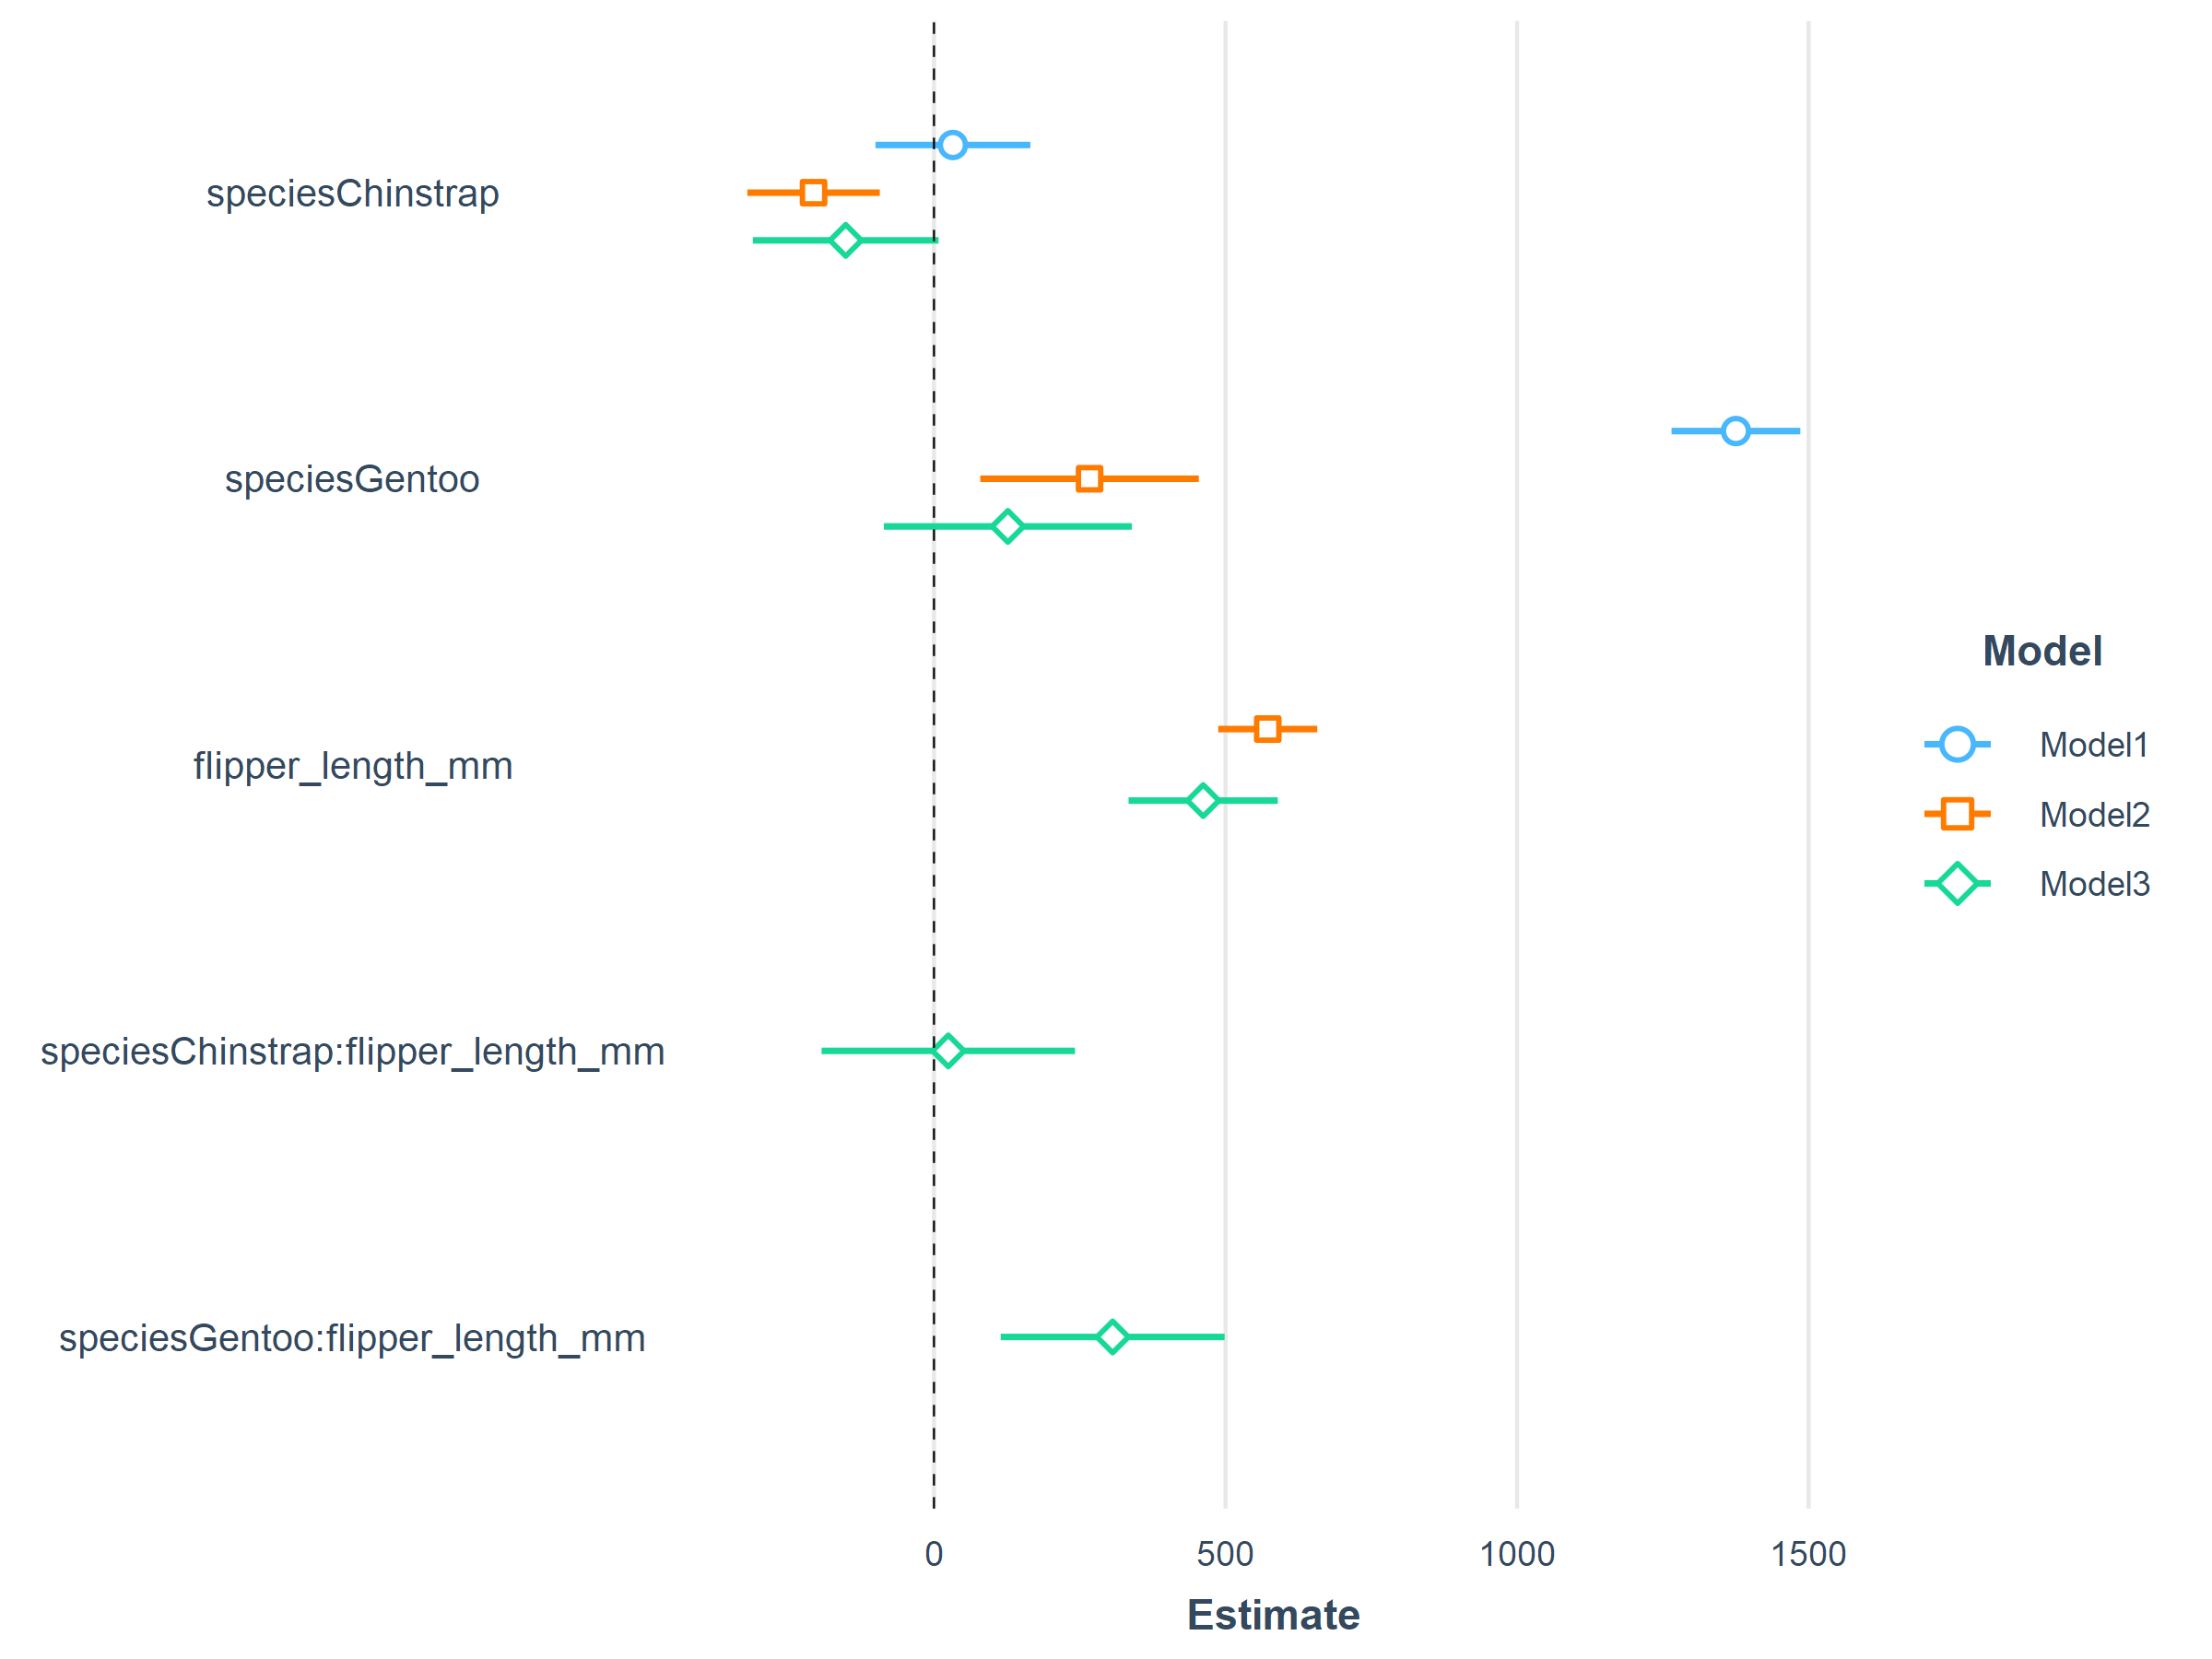
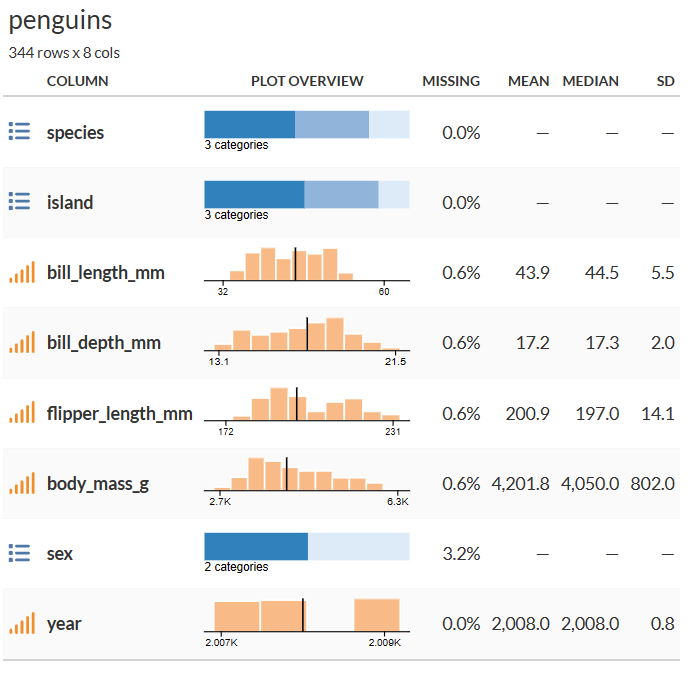
- compare multiple models and how each predictor performs
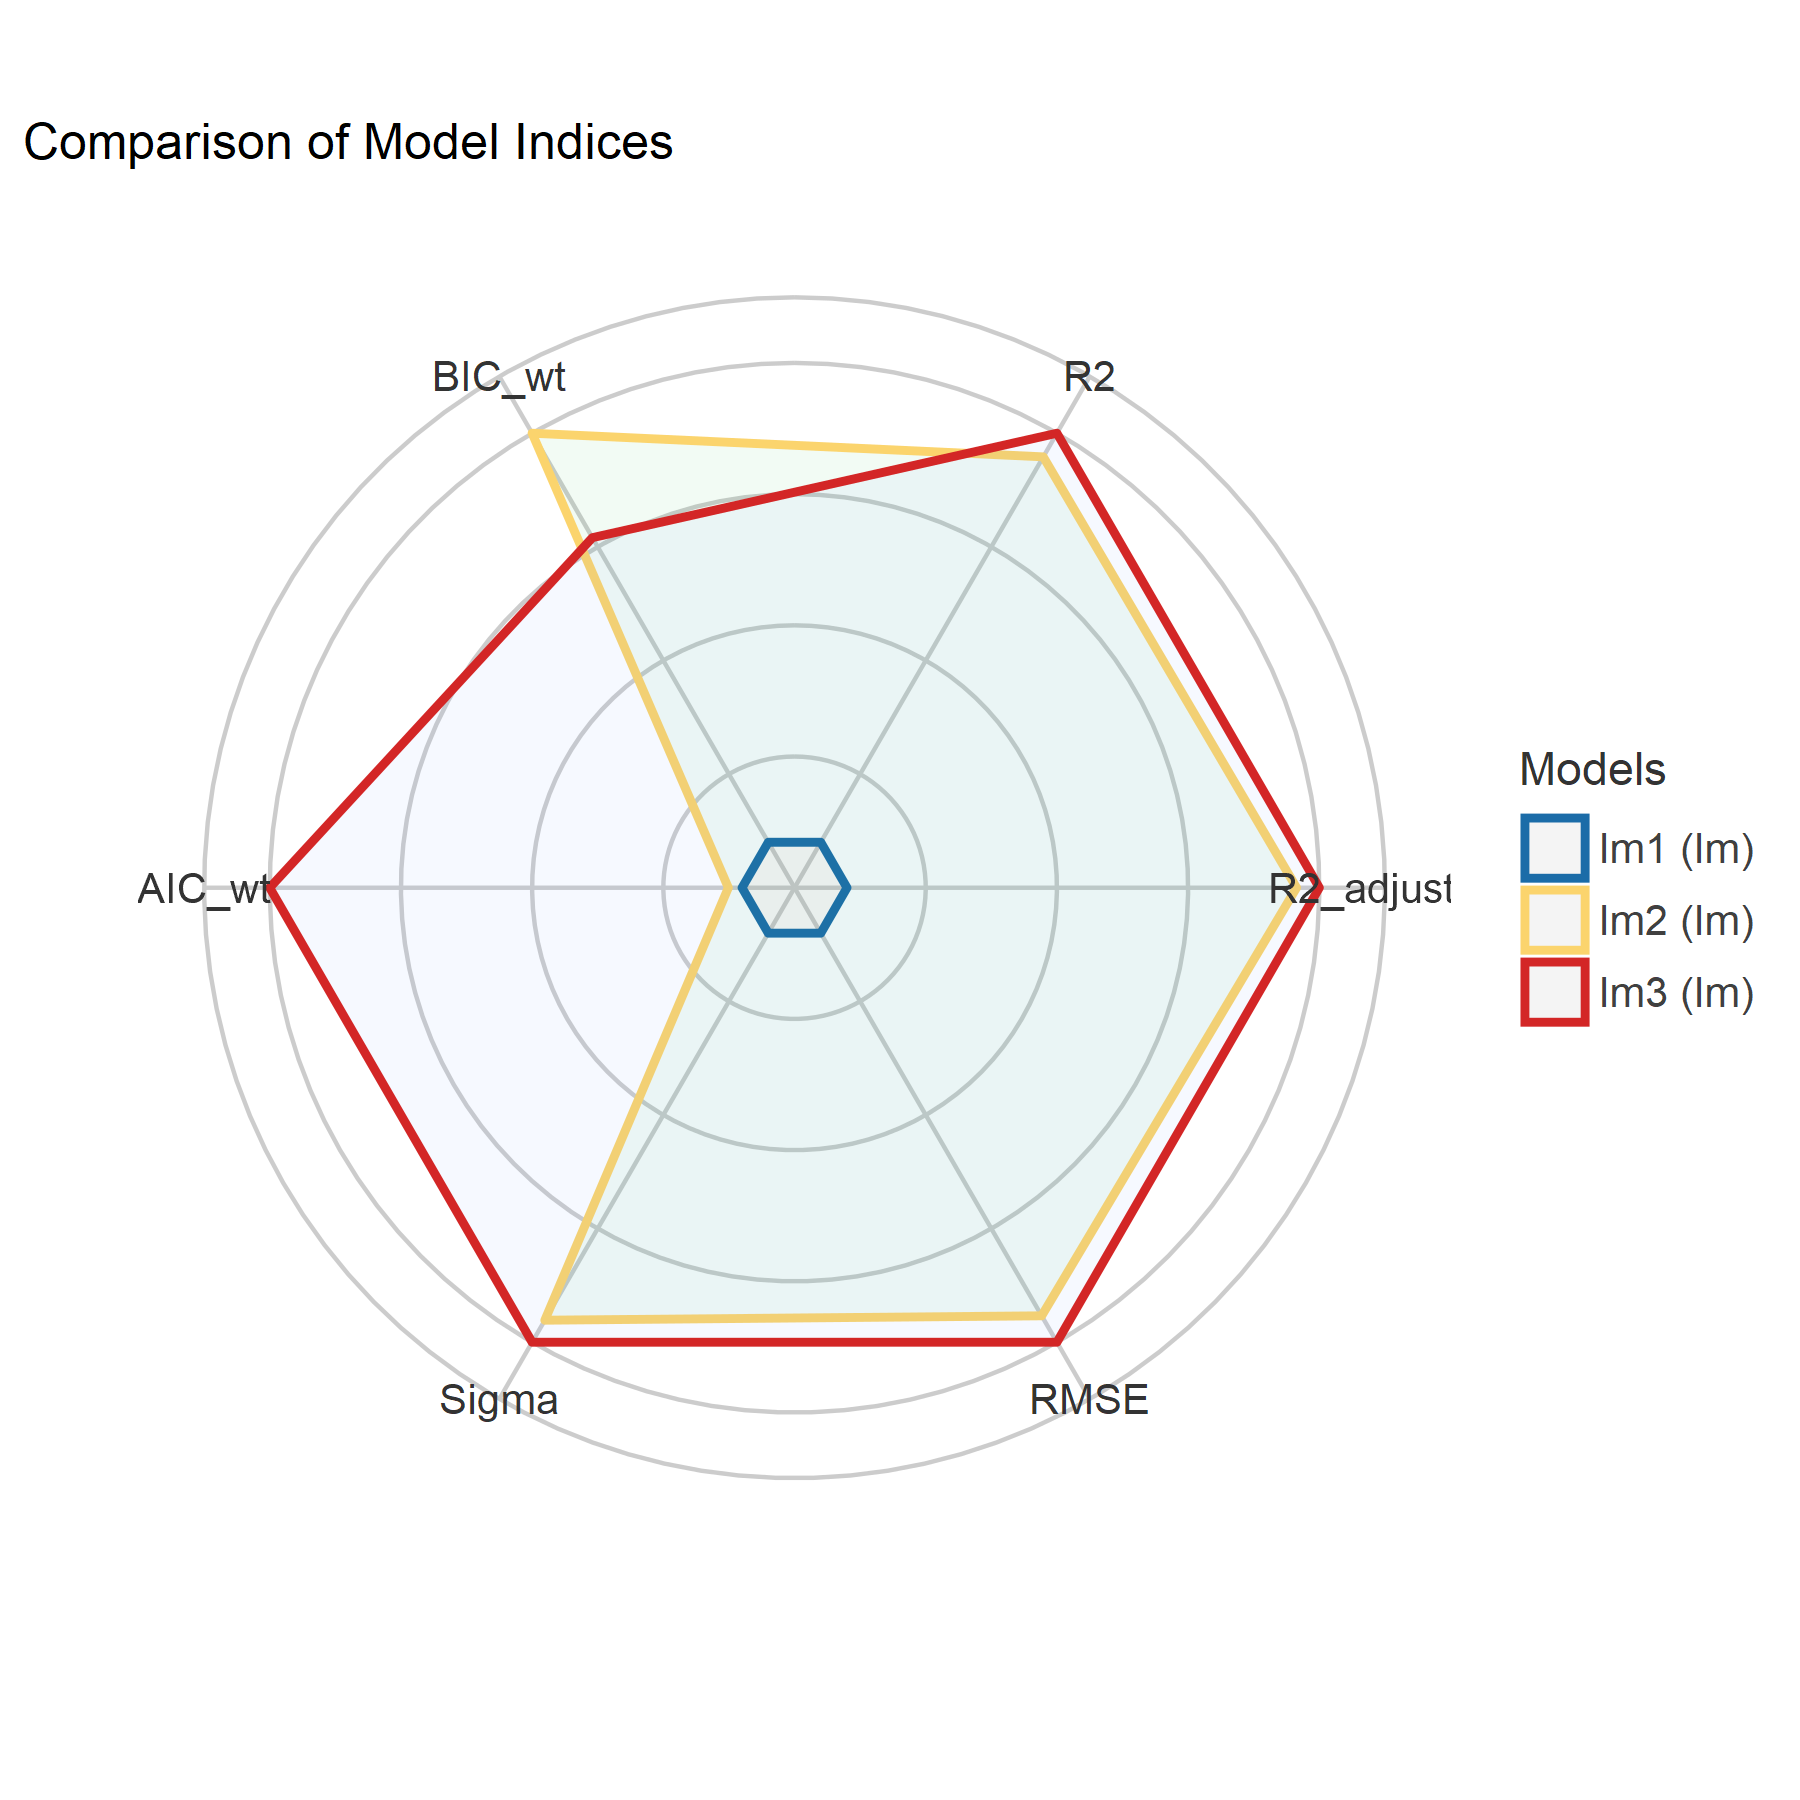
- see R squared adjusted, BIC etc for comapring models

- Neat viz showing values of 0.5 ECDF