[Monitoring V1, RKE1, RKE2] k8s 1.21 clusters do not display any metrics on Grafana #33465
Comments
|
|
|
|
Today, when I tested this, I noticed that it did affect an imported RKE2 cluster. However, this is likely due to the fact that the original imported cluster I created when testing this issue was at version Since Prometheus still seems to contain the data that Grafana is trying to access but the Grafana queries are returning empty lists, I suspect that the fix for this issue will involve updating https://github.com/rancher/prometheus-auth for supporting k8s 1.21 clusters. |
|
Reproduced consistently in RKE2 and RKE1 k8s 1.21 clusters, not observable in k8s 1.20. |
|
In the This is related since the token for the SubjectAccessReview issued by the authorization plugin sitting on top of Prometheus (rancher/prometheus-auth) is being denied. I tried uplifting the client-go package and all the versions in rancher/prometheus-auth#10 but it seems like the image produced does not seem to resolve this issue. Therefore, we might have to re-evaluate the logic in https://github.com/rancher/prometheus-auth/blob/master/pkg/kube/namespaces.go to see why the namespace logic is only failing in k8s 1.21 clusters. |
|
The resource Also, k8s has a builtin cluster role |
Root causek8s 1.21 enables What was fixed, or what changes have occurredWe did not fix the issue. Instead, we will document this as a known issue for monitoring v1 in k8s 1.21 and above. A workaround will be disabling the Areas or cases that should be testedWe need to test that the issue disappears if we disable What areas could experience regressions?The basic functionally of monitoring Are the repro steps accurate/minimal?n/a |
|
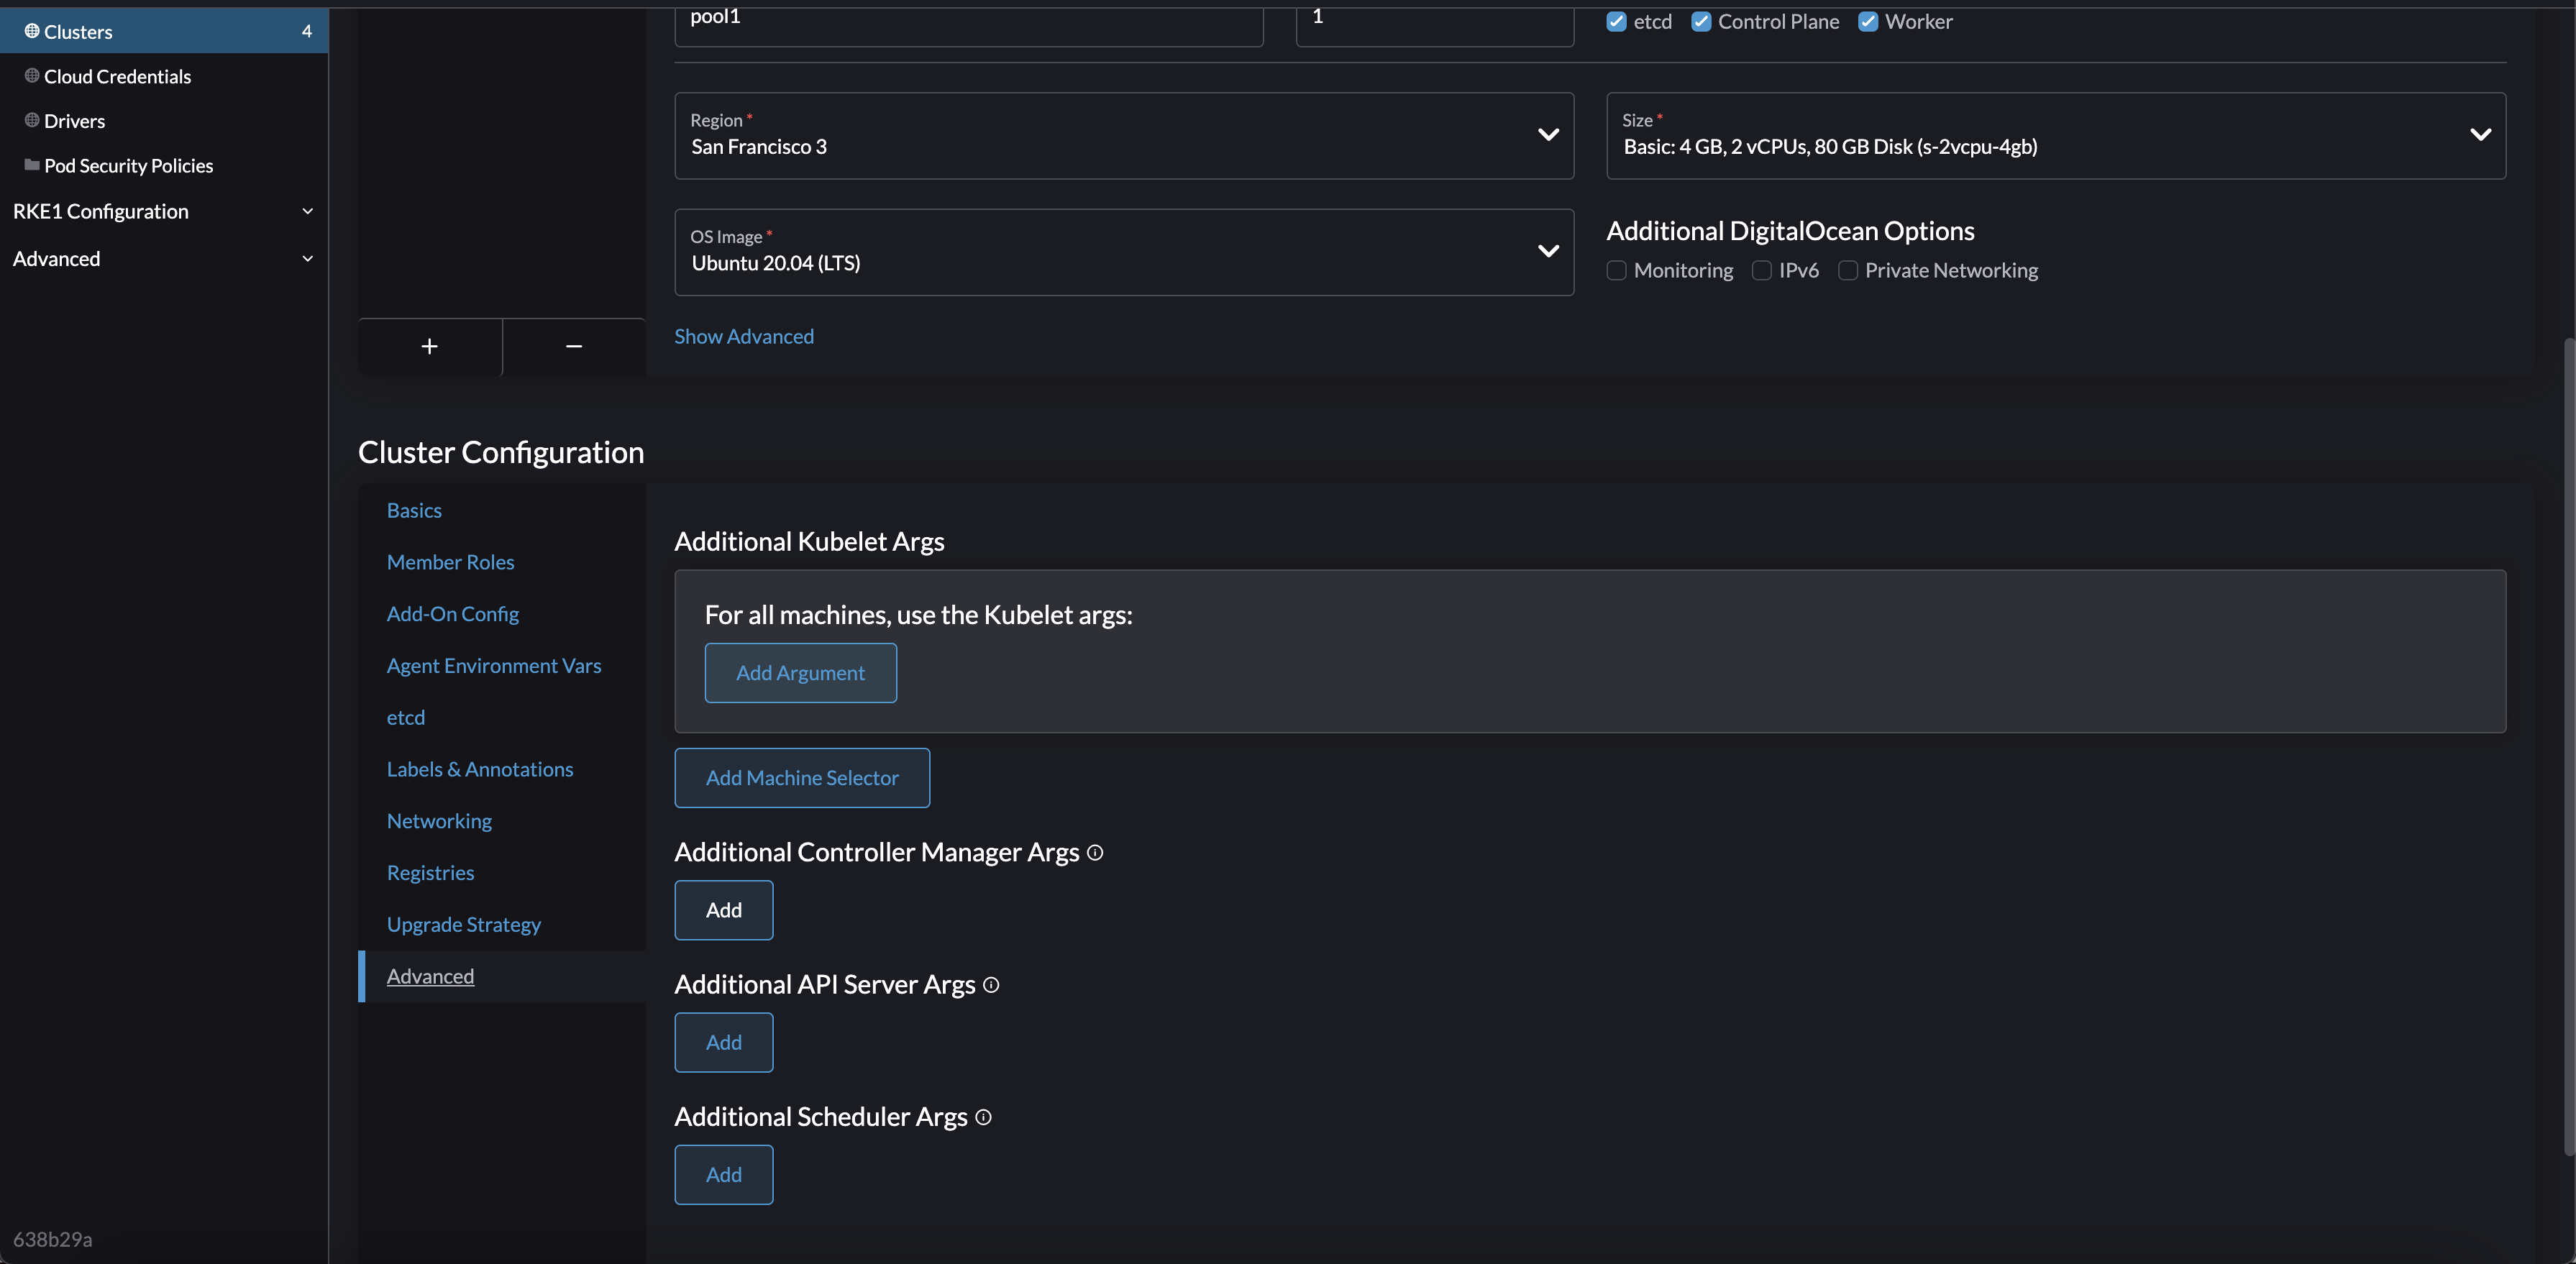
Further Testing Setup: rke2 cluster Referencing these design docs you can see the feature can be disabled. If you look up feature gate docs you can see that you should be able to disable the feature by using the following argument when provisioning a cluster: You can add those arguments to the configuration by going to the advanced options in the create page of an RKE2 cluster This should allow you to enter --feature-gate="BoundServiceAccountTokenVolume=false" into the api and controller args from the screenshot. Those appear to be the location where the feature gate is implemented, per the mentioned design docs However when you do this the provisioning of the cluster gets stuck waiting for a response from the cluster agent in the control plane node. |
|
Setup For Reproduction and Validation
Steps For Reproduction
Screenshot of issue: Steps For Validation
Screenshot of metrics showing: Note |


… will not get any data from prometheus, and there is a workaround, see rancher/rancher#33465
|
We had recently run into this issue on EKS which doesn't allow setting feature flags on cp aws/containers-roadmap#512 quick workaround is to update the prom access url for the grafana in the helm chart to |
What kind of request is this (question/bug/enhancement/feature request):
bug
Steps to reproduce (least amount of steps as possible):
Spin up an RKE2 cluster on the latest master-head in DO. I chose 1 node with all roles and 1 node as worker.
Deploy Monitoring V1 0.2.3 (in dev-v2.6).
Navigate to Grafana and check out any dashboard.
Result:
All dashboards show no data
Expected Result:
Grafana should show data on the dashboards
Other details that may be helpful:
The following logs are shown under prometheus-auth (which Grafana proxies through), so the fix for this issue is probably bumping the client-go package used by prometheus-auth.
Environment information
rancher/rancher/rancher/serverimage tag or shown bottom left in the UI): master-head671a4b1a026f5cf2706c9d6717ef7ee0a6674e73Cluster information
kubectl version):docker version):The text was updated successfully, but these errors were encountered: