-
-
Notifications
You must be signed in to change notification settings - Fork 1.7k
New issue
Have a question about this project? Sign up for a free GitHub account to open an issue and contact its maintainers and the community.
By clicking “Sign up for GitHub”, you agree to our terms of service and privacy statement. We’ll occasionally send you account related emails.
Already on GitHub? Sign in to your account
stacked bar chart radius issue #1888
Comments
|
Can someone give steps to recreate this? And describe desired functionality at the end? @firstLast98421 if it is still relevant |
|
@firstLast98421 It's recommend to use that case. Maybe it's not a bug, just wrong used case. |
|
@dauletisataev there's an example here: https://recharts.org/en-US/examples/BarChartHasBackground |
|
I'm trying to achieve a similar BarChart. I need a stacked bar chart, whose bars have rounded edges and appear to be on top of each other: 
My problem is that when I apply the Here is a reproduction in Code Sandbox: And an extract of the code: export default function App() {
const execution = { inactive: 20, win: 20, loss: 20, hedge: 40 };
return (
<BarChart width={120} height={30} data={[execution]} layout="vertical">
<XAxis type="number" hide />
<YAxis type="category" hide />
<Bar
dataKey="inactive"
stackId="a"
fill={"blue"}
radius={[10, 10, 10, 10]}
background={{ fill: "red" }}
/>
<Bar dataKey="hedge" stackId="a" fill={"green"} radius={[0, 10, 10, 0]} />
<Bar dataKey="win" stackId="a" fill={"pink"} radius={[0, 10, 10, 0]} />
<Bar dataKey="loss" stackId="a" fill={"yellow"} radius={[0, 10, 10, 0]} />
</BarChart>
);
} |
|
@RodriCabrera did you resolve this issue? I have the same problem |
|
Going to re-open this as an enhancement. I don't think its quite possible to get what is wanted at this point. Each bar item in a stack does not have an individual background and therefore one can't be configured. Its all or nothing for everything in the stack. We would need a mask or something for each part of the stack For understanding purposes though, how do you interpret the graph pictured @RodriCabrera - Is the datapoint at the tip of the rounded bar or is it at the edge where the radius starts? From a usability perspective this confuses me a bit. |
|
Hi All, I noticed more questions related to this issue I encountered years
ago. I'm no longer at that position so I do not have the source code
unfortunately but I recalled resolving it through NOT using the prop
"stacked". I was able to just add another component above first and mimic a
"stacked" bar to resolve this issue. If memory serves me right, the value
of the higher bar will show if you keep the value as the addition of the
shorter bar and the difference between both bars (i.e. -> shorter bar value
+ difference between bars). Hope this helps!
…On Mon, Aug 7, 2023 at 2:02 PM Coltin Kifer ***@***.***> wrote:
Reopened #1888 <#1888>.
—
Reply to this email directly, view it on GitHub
<#1888 (comment)>, or
unsubscribe
<https://github.com/notifications/unsubscribe-auth/ANPACL5LURVO27YCNR7FXL3XUEUTBANCNFSM4JAEYNKQ>
.
You are receiving this because you were mentioned.Message ID:
***@***.***>
|
Hi @OksanaTyshchenko , I couldn't solve it using recharts so I finally created what I needed without libraries (here's a codesandbox with that solution). Because in my case I only needed that small graph, with each overlapping bar representing a percentage.
Hey @ckifer ! Thanks for your attention. I interpret it as the datapoint at the tip of the rounded bar. But I understand what you mean about the usability perspective, because the next bar would start being visible before it's "starting point". |
|
+1 for this issue/enhancement |


Do you want to request a feature or report a bug?
Not sure if this is an issue, but maybe an enhancement I would like to request?
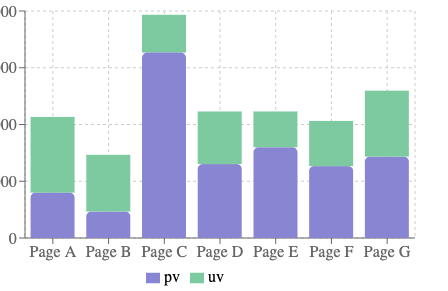
Currently, with stacked bar charts, if we give the first bar a radius:

-Ex
there's the white space gaps at the upper corners of the bars, not filled in with the fill color of the bar stacked above.
I know that with the background prop, we can fill in these corners:

but I don't think I could get it to have the dynamic value heights.
Any help/alternatives would be appreciated!
The text was updated successfully, but these errors were encountered: