Skip to content
New issue

Have a question about this project? Sign up for a free GitHub account to open an issue and contact its maintainers and the community.

By clicking “Sign up for GitHub”, you agree to our terms of service and privacy statement. We’ll occasionally send you account related emails.

Already on GitHub? Sign in to your account

Implement Redwood API side Logger #1937

Merged
merged 19 commits into from Mar 18, 2021
Merged

Conversation

dthyresson
Copy link
Contributor

@dthyresson dthyresson commented Mar 6, 2021

Implements api-side logging using the pino logger.

This is an opinionated logger that has some useful default configuration, such as:

  • pretty printing in development
  • development log level is trace, but production is warn
  • supports file system logging, but will warn if string to log to a file in a non-dev environment (need filesystem access)
  • support log transports (Datadog, logFlare etc via library of pino tranports)

This feature

  • is implemented in @redwood/api/logger
  • adds a /src/lib/logger.ts to the CRWA template (lives alongside db.js)

Example /src/lib/logger.ts and use:

import { createLogger, defaultLoggerOptions } from '@redwoodjs/api/logger'

/**
 * Creates a logger. Options define how to log. Destination defines where to log.
 * If no destination, std out.
 */
export const logger = createLogger({
  options: { ...defaultLoggerOptions, level: 'trace' },
  // destination: stream,
})

then ...

import { logger } from 'src/lib/logger'
...
  logger.info(`Saving widget ${widget.id} ${widget.name}`)

  logger.debug(
    { rawData: widget },
    `Widget ${widget.id} ${widget.name} detail`
  )

Please see:

  • the defaultLoggerOptions as this is opinonated
  • other examples of log config in the CRWA logger template (logging file, log love override, etc).

Still TODO

  • Does one need to flush the log? Since may not be done automatically, need to document
  • Consider setup commands to create logTransports for datadog ands logFlare etc (probably separate PR)
  • Consider making a flavor of the logger that accepts an event and context to be used in functions, including graphql that can add extra details to logger data
  • This could be used by graphql
import { logger, serviceLogger } from 'src/lib/logger'
...
export const handler = createGraphQLHandler({
  getCurrentUser,
  context: ({ event, context }) => {
    context.logger = serviceLogger({ event, context }) 
  },
  • so that in any service, one can context.logger.debug({model}, 'My message'}

For example, this would auto add the function path to the log info data which could be useful in custom functions

export const serviceLogger = ({ event, _context }) => {
  const _logger = createLogger({
    options: { ...defaultLoggerOptions, level: 'trace' },
  })

  return _logger.child({ function: event?.path })
}

Ideally, I would want to fetch the resolver name and set it.

Some Example Configs for Different Loggers

These examples are in the CRWA logger.ts file.

/*
 * Examples of how to configure and
 * send to log transport streams
/*

/**
 * Override log level
 */
export const logger = createLogger({
  options: { ...defaultLoggerOptions, level: 'warn' },
})

/**
 * Always pretty print
 */
export const logger = createLogger({
  options: { ...defaultLoggerOptions, prettyPrint: 'true' },
})

/**
 * Custom redaction list
 */
import { redactionsList } from '@redwoodjs/api/logger'
export const logger = createLogger({
  options: { ...defaultLoggerOptions, redact: [...redactionsList, 'my_secret_key'] },
})

/**
 * Log to a File
 */
export const logger = createLogger({
  options: { ...defaultLoggerOptions, file: '/path/to/file'},
})

/**
 * Datadog example
 */
import datadog from 'pino-datadog'

/**
 * Creates a pino-logflare stream
 *
 * @param {string} apiKey - Your logFlare API Key
 * @param {string} sourceToken - Your logFlare source token id
 *
 * @typedef {DestinationStream}
 */
export const stream = datadog.createWriteStreamSync({
  apiKey: process.env.DATADOG_API_KEY,
  ddsource: 'my-source-name',
  ddtags: 'tag,not,it',
  service: 'my-service-name',
  size: 1,
})

export const logger = createLogger({
  options: { ...defaultLoggerOptions, destination: stream},
})

/**
 * logFlare Example
 */
import { createWriteStream } from 'pino-logflare'

/**
 * Creates a pino-logflare stream
 *
 * @param {string} apiKey - Your logFlare API Key
 * @param {string} sourceToken - Your logFlare source token id
 *
 * @typedef {DestinationStream}
 */
export const stream = createWriteStream({
  apiKey: process.env.LOGFLARE_API_KEY,
  sourceToken: process.env.LOGFLARE_SOURCE_TOKEN,
})

export const logger = createLogger({
  options: { ...defaultLoggerOptions, destination: stream},
})

Prisma

I'd like to make it easy to log Prisma db output as well.

I'd like to simplify or include this setup:

import { PrismaClient } from '@prisma/client'

import { logger } from './logger'

/* Determines the type and level of logging.
 *
 * See: https://www.prisma.io/docs/reference/api-reference/prisma-client-reference#log
 */
const defaultPrismaLoggerOptions = [
  {
    emit: 'event',
    level: 'query',
  },
  {
    emit: 'event',
    level: 'info',
  },
  {
    emit: 'event',
    level: 'error',
  },
  {
    emit: 'event',
    level: 'warn',
  },
]

export const db = new PrismaClient({
  log: defaultPrismaLoggerOptions,
  errorFormat: 'colorless',
})

/*
 * To use event-based logging:
 * Set emit to event for a specific log level, such as query
 * Use the $on() method to subscribe to the event
 *
 * https://www.prisma.io/docs/concepts/components/prisma-client/working-with-prismaclient/logging
 */

db.$on('query', (queryEvent) => {
  logger.debug(
    { ...queryEvent },
    `${queryEvent.query} in ${queryEvent.duration} msec`
  )
})

db.$on('info', (logEvent) => {
  logger.info({ ...logEvent }, logEvent.message)
})

db.$on('warn', (logEvent) => {
  logger.warn({ ...logEvent }, logEvent.message)
})

db.$on('error', (logEvent) => {
  logger.error({ ...logEvent }, logEvent.message)
})
  • declare a prismaLogger?
  • define the defaults
  • add a method that take the db instance and wires up the events?

@dthyresson dthyresson linked an issue Mar 6, 2021 that may be closed by this pull request
@dthyresson dthyresson marked this pull request as draft March 6, 2021 17:02
@dthyresson
Copy link
Contributor Author

dthyresson commented Mar 6, 2021

First main questions:

  • Do we want setups for log transports
  • Should those be separate PRs? (I think so)
  • Needs docs, but code comments are useful to start
  • Should these docs me in a README.md ?
  • How to make prisma logging easier
  • How to make service, function logging easier
  • How to add to context via createGraphQLHandler

Copy link
Contributor

@jvanbaarsen jvanbaarsen left a comment

Choose a reason for hiding this comment

The reason will be displayed to describe this comment to others. Learn more.

I added a couple of thoughts about the code.

Setting this up in an existing app was a breeze! Only thing that I didn't see work is the Prisma logging, but I believe this is not yet implemented, right?

packages/api/src/logger/index.ts Outdated Show resolved Hide resolved
@dthyresson
Copy link
Contributor Author

Only thing that I didn't see work is the Prisma logging, but I believe this is not yet implemented, right?

That's correct @jvanbaarsen - I am not sure how best to simplify the setup.

This is my current db.js in an exsiting RW app:

// See https://www.prisma.io/docs/reference/tools-and-interfaces/prisma-client/constructor
// for options.

import { PrismaClient } from '@prisma/client'

import { logger } from './logger'

/* Determines the type and level of logging.
 *
 * See: https://www.prisma.io/docs/reference/api-reference/prisma-client-reference#log
 */
const defaultPrismaLoggerOptions = [
  {
    emit: 'event',
    level: 'query',
  },
  {
    emit: 'event',
    level: 'info',
  },
  {
    emit: 'event',
    level: 'error',
  },
  {
    emit: 'event',
    level: 'warn',
  },
]

export const db = new PrismaClient({
  log: defaultPrismaLoggerOptions,
  errorFormat: 'colorless',
})

/*
 * To use event-based logging:
 * Set emit to event for a specific log level, such as query
 * Use the $on() method to subscribe to the event
 *
 * https://www.prisma.io/docs/concepts/components/prisma-client/working-with-prismaclient/logging
 */

db.$on('query', (queryEvent) => {
  logger.debug(
    { ...queryEvent },
    `${queryEvent.query} in ${queryEvent.duration} msec`
  )
})

db.$on('info', (logEvent) => {
  logger.info({ ...logEvent }, logEvent.message)
})

db.$on('warn', (logEvent) => {
  logger.warn({ ...logEvent }, logEvent.message)
})

db.$on('error', (logEvent) => {
  logger.error({ ...logEvent }, logEvent.message)
})

I'm not sure how best to include this:

  • update db.js?
  • add a method to take the db instance and add the "on" event handling
  • Add a method used when creating the Prisma client that sets up
  errorFormat: 'colorless',```

Maybe something that takes

{ query: Boolean, levels: ['info, 'warn']}


or even options like: `{ query: false, warn: true, error: true}` and constructs the emitter list.

The tricky part is to turn on the custom emitters, the client has to already be created.

@dthyresson
Copy link
Contributor Author

dthyresson commented Mar 7, 2021

Setting this up in an existing app was a breeze!

Thanks! That was my goal. The pino logger is easy, but wanted to make the DX somewhat "out-of-the box".

Only thing that I didn't see work is the Prisma logging.

I spent some time this morning and converted my app's db.js to db.ts and now use:

// See https://www.prisma.io/docs/reference/tools-and-interfaces/prisma-client/constructor
// for options.

import { PrismaClient, Prisma } from '@prisma/client'
import { logger } from './logger'

/* Determines the type and level of logging.
 *
 * See: https://www.prisma.io/docs/reference/api-reference/prisma-client-reference#log
 */
const logLevels: Prisma.LogLevel[] = ['info', 'warn', 'error'] // add 'query' in dev?

const prismaLoggerOptions = (
  logLevels: Prisma.LogLevel[]
): Prisma.LogDefinition[] => {
  return logLevels?.map((level) => {
    return { emit: 'event', level } as Prisma.LogDefinition
  })
}

const createPrismaClient = (logLevels: Prisma.LogLevel[]) => {
  const client = new PrismaClient({
    log: prismaLoggerOptions(logLevels),
    errorFormat: 'colorless',
  })

  /*
   * To use event-based logging:
   * Set emit to event for a specific log level, such as query
   * Use the $on() method to subscribe to the event
   *
   * https://www.prisma.io/docs/concepts/components/prisma-client/working-with-prismaclient/logging
   */

  logLevels.forEach((level) => {
    if (level === 'query') {
      client.$on(level, (queryEvent: Prisma.QueryEvent) => {
        logger.debug(
          { ...queryEvent },
          `${queryEvent.query} in ${queryEvent.duration} msec`
        )
      })
    } else {
      client.$on(level, (logEvent: Prisma.LogEvent) => {
        logger.info({ ...logEvent }, logEvent.message)
      })
    }
  })

  return client
}

export const db = createPrismaClient(logLevels)

This still creates the db instance but sets up all the logging in Prisma based on just the level chosen:

const logLevels: Prisma.LogLevel[] = ['info', 'warn', 'error'] // add 'query' in dev?

@jvanbaarsen Can you try this out to see if you like it? If so perhaps change the CRWA db.js template to something like this.

One idea would be to construct:

const logLevels: Prisma.LogLevel[] = ['info', 'warn', 'error'] // add 'query' in dev?

based on the logger's level and silent would be none or [] with an option to add query.

@dthyresson
Copy link
Contributor Author

db.$on('query', (queryEvent) => {
  logger.debug(
    { ...queryEvent },
    `${queryEvent.query} in ${queryEvent.duration} msec`
  )
})

Actually, what is very cool i that one can warn on slow queries (ie duration over a threshold):

 logLevels.forEach((level) => {
    if (level === 'query') {
      client.$on(level, (queryEvent: Prisma.QueryEvent) => {
        if (queryEvent.duration > 20) {
          logger.warn(
            { ...queryEvent },
            `Slow Query performed in ${queryEvent.duration} msec`
          )
        } else {
          logger.debug(
            { ...queryEvent },
            `Query performed in ${queryEvent.duration} msec`
          )
        }
      })
    } else {
      client.$on(level, (logEvent: Prisma.LogEvent) => {
        logger.info({ ...logEvent }, logEvent.message)
      })
    }
  })

then it appears as:

api | WARN [2021-03-07 14:50:52.691 +0000]: Slow Query performed in 34 msec
api |     log: {
api |       "timestamp": "2021-03-07T14:50:52.690Z",

@dthyresson
Copy link
Contributor Author

Note: I've added db.ts to this PR to finalize features and suggest an opinionated Prisma client with logging configured.

Moving out of draft.

Subsequent PRs will setup logFlare and dataddog transports.

@jvanbaarsen
Copy link
Contributor

@dthyresson I'll give the Prisma setup a try tomorrow 👍

Comment on lines 7 to 9
export const logger = createLogger({
options: { ...defaultLoggerOptions },
})
Copy link
Contributor

Choose a reason for hiding this comment

The reason will be displayed to describe this comment to others. Learn more.

Maybe we can just leave these as the default in the function itself?

Copy link
Contributor Author

@dthyresson dthyresson Mar 8, 2021

Choose a reason for hiding this comment

The reason will be displayed to describe this comment to others. Learn more.

I thought about that, but I really like explicitly showing it here because you gives some nice help:
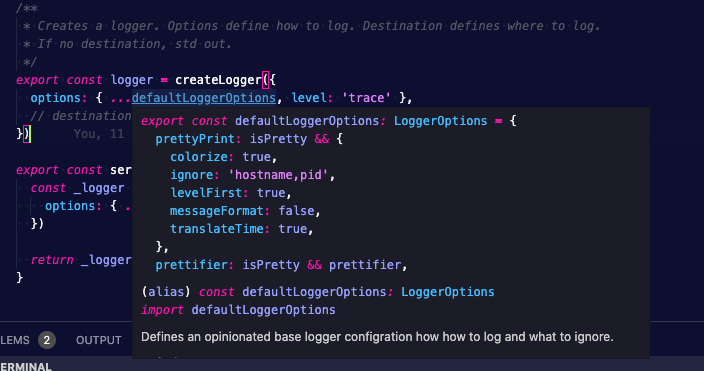
image

and

image

which I think help you know what the defaults are and the expected config out-of-the-box.

What do you think, @peterp ? Happy to move though.

Copy link
Contributor Author

Choose a reason for hiding this comment

The reason will be displayed to describe this comment to others. Learn more.

Ah some typos ... I fix!

Copy link
Contributor

Choose a reason for hiding this comment

The reason will be displayed to describe this comment to others. Learn more.

You can actually make that part of the type, then it'll be auto-completed and typed checked. I think the comment will also show up.

Copy link
Contributor

Choose a reason for hiding this comment

The reason will be displayed to describe this comment to others. Learn more.

Would you be OK with making the defaultLoggerOptions part of the function, and using types to document them to the user during design time?

If so, and if you need any guidance to make this happen let me know.

Copy link
Contributor Author

Choose a reason for hiding this comment

The reason will be displayed to describe this comment to others. Learn more.

@peterp

Would you be OK with making the defaultLoggerOptions part of the function,

I think so.

if you need any guidance to make this happen let me know.

I'm not sure I understand what is needed to do that though.

export const createLogger = ({
  options,
  destination,
  showConfig = isDevelopment,
}: RedwoodLoggerOptions): BaseLogger => {

Include the defaultLoggerOptions always? And then just override with options that are LoggerOptions?

Like

export const createLogger = ({
  options,
  destination,
  showConfig = isDevelopment,
}: RedwoodLoggerOptions): BaseLogger => {

const loggerOptions = { ...defaultLoggerOptions, options }

and then use loggerOptions in the function?

That way you'd declare a logger like:

export const logger = createLogger()

But if you do want to override:

export const logger = createLogger({ options: { level: 'warn' } })

?

@dthyresson
Copy link
Contributor Author

@peterp and @Tobbe I am rather happy with the state of the logger now.

The only large unresolved question is how to treat logging in test?

  • Turn it off ie silent?
  • Set it to error?
  • Do nothing?

Copy link
Contributor

@peterp peterp left a comment

Choose a reason for hiding this comment

The reason will be displayed to describe this comment to others. Learn more.

Looking great David, I've left a few notes, questions and suggestions

Comment on lines +82 to +91
export const createPrismaClient = (setLogLevels?: Prisma.LogLevel[]) => {
const client = new PrismaClient({
log: prismaLoggerOptions(setLogLevels),
errorFormat: 'colorless',
})

setLogLevels && configureLogLevels(client, setLogLevels)

return client
}
Copy link
Contributor

Choose a reason for hiding this comment

The reason will be displayed to describe this comment to others. Learn more.

@dthyresson I know this has now merged, but I was wondering if we could hide most of this implementation?

The reason is I'm worried that Prisma changes the logging interfaces and we have to ship a huge code mod.

Maybe there's a way to internalize configureLogLevels?

Copy link
Contributor Author

Choose a reason for hiding this comment

The reason will be displayed to describe this comment to others. Learn more.

@peterp

Definitely would like to.

I commented yesterday above:

Can we hide these implementations in the logger library in the api package?

@peterp I didn't know if I wanted to have the api/logger depend on Prisma.

Some deploys won't have Prisma so then would that prevent people from using the logger?

I'm concerned that Prisma changes the format

...

But not sure I can think of an alternative.

But of course when you say:

The reason is I'm worried that Prisma changes the logging interfaces and we have to ship a huge code mod

I definitely want to avoid that scenario.

I am having a hard time visualizing what

if we could hide most of this implementation?

or

internalizing

it might look like?

Can you give me a direction or maybe we jump of a quick call?

I wanted to get logging in so people could give feedback like this and can improve the implementation so can assess if we want to ship the CRWA template changes in w/ v0.28.

dac09 added a commit to dac09/redwood that referenced this pull request Mar 22, 2021
…r-rwt-link

* 'main' of github.com:redwoodjs/redwood: (26 commits)
  Router: Fix auth (redwoodjs#2038)
  Steps towards a11y for Redwood Router (redwoodjs#1817)
  Router: <Set wrap={}> (redwoodjs#1898)
  Pass event and context into getCurrentUser (redwoodjs#1908)
  Implement Redwood API side Logger (redwoodjs#1937)
  Fixed path on windows to allow for pages under subdirectories (redwoodjs#2022)
  Add experimental ESBuild for api side (redwoodjs#1948)
  Upgrade to Prisma 2.19.0 (Prisma Migrate GA) (redwoodjs#2021)
  Fix lint breaking when deleting a side (redwoodjs#2017)
  Refactor: Converted Prisma.ts to js (redwoodjs#1958)
  Fix issue with verify email redirect using Auth0 (redwoodjs#1990)
  add GitHub Action CodeQL Analysis (redwoodjs#1951)
  fix: correct var name for grabbing user config (redwoodjs#2002)
  Create functions to fs calls (redwoodjs#2007)
  Return signup Output (redwoodjs#1992)
  Add makeExecSchema options (redwoodjs#1964)
  upgrade gotrue-js to 0.9.29 (redwoodjs#2011)
  Azure Active Directory Auth: Adding try-catch block on callback to capture empty key (redwoodjs#2010)
  withCellHOC: Fix TS error (redwoodjs#1967)
  Update error message in tasks/publish-local to point to tasks/run-local-npm when Verdaccio isn't running (redwoodjs#2004)
  ...
@dthyresson dthyresson added this to In progress in Logging via automation Mar 23, 2021
@dthyresson dthyresson moved this from In progress to Done in Logging Mar 23, 2021
@dthyresson dthyresson deleted the dt-logger branch December 23, 2021 22:54
Sign up for free to join this conversation on GitHub. Already have an account? Sign in to comment
Projects
No open projects
Logging
  
Done
Development

Successfully merging this pull request may close these issues.

Logging v1 Experience: Status, Objectives, Decisions
5 participants