Fit single flow curve
In this page we report a good practice example on how to fit a single flow curve.
Main points:
- Define a Boolean mask to filter the data
- Pass data and weights to the lmfit.model.fit function to make data range selection as concise as possible
- Implement a data selection algorithm
import rheofit
import lmfit
import pybroom as pb
import matplotlib.pyplot as plt
import pandas as pddata=rheofit.rheodata.example_emulsion()
min_shear_rate=0
max_shear_rate=10000
mask=(data['Shear rate']>=min_shear_rate) & (data['Shear rate']<=max_shear_rate)
model=rheofit.models.HB_model
res_fit=model.fit(data['Stress'],x=data['Shear rate'],weights=1/(0.1*data[mask]['Stress']),nan_policy='omit')res_fit.plot_fit(ax_kws={'yscale':'log','xscale':'log'},xlabel='Shear rate [1/s]',ylabel='Stress [Pa]', yerr=False)
data=rheofit.rheodata.example_emulsion()
min_shear_rate=1
max_shear_rate=10000
mask=(data['Shear rate']>=min_shear_rate) & (data['Shear rate']<=max_shear_rate)
model=rheofit.models.HB_model
res_fit=model.fit(data['Stress'],x=data['Shear rate'],weights=1/(0.1*data[mask]['Stress']),nan_policy='omit')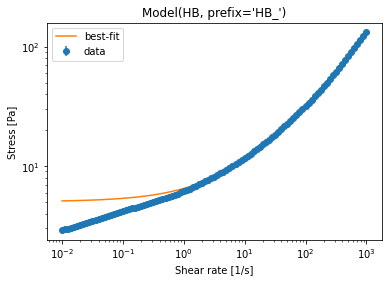
pb.tidy({'example_data':res_fit})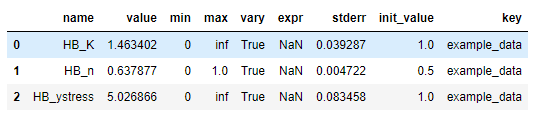
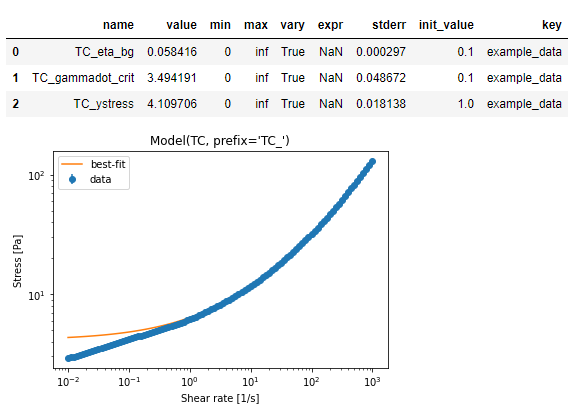
data=rheofit.rheodata.example_emulsion()
model=rheofit.models.TC_model

min_shear_rate=0
max_shear_rate=10000

mask=(data['Shear rate']>=min_shear_rate) & (data['Shear rate']<=max_shear_rate)

res_fit=model.fit(data['Stress'],x=data['Shear rate'],weights=1/(0.1*data[mask]['Stress']),nan_policy='omit')

while res_fit.params['TC_gammadot_crit'].value> min(data[mask]['Shear rate']):
    min_shear_rate=res_fit.params['TC_gammadot_crit'].value
    max_shear_rate=10000
    mask=(data['Shear rate']>=min_shear_rate) & (data['Shear rate']<=max_shear_rate)
    res_fit=model.fit(data['Stress'],x=data['Shear rate'],weights=1/(0.1*data[mask]['Stress']),nan_policy='omit')

display(pb.tidy({'example_data': res_fit}))
res_fit.plot_fit(ax_kws={'yscale':'log','xscale':'log'},xlabel='Shear rate [1/s]',ylabel='Stress [Pa]', yerr=False);