R package for creation of "diverging pip" plots
I designed these figures to help identify imbalances between two groups where both percentages and raw frequencies were important. For instance, if one sees a 70/30 split between two groups with 300 people, this might be a problem; but if the number of people is 10, that is less of a problem. Typical plots will show percentages with numerical frequencies added; these plots are confusing and don't represent the data very well.
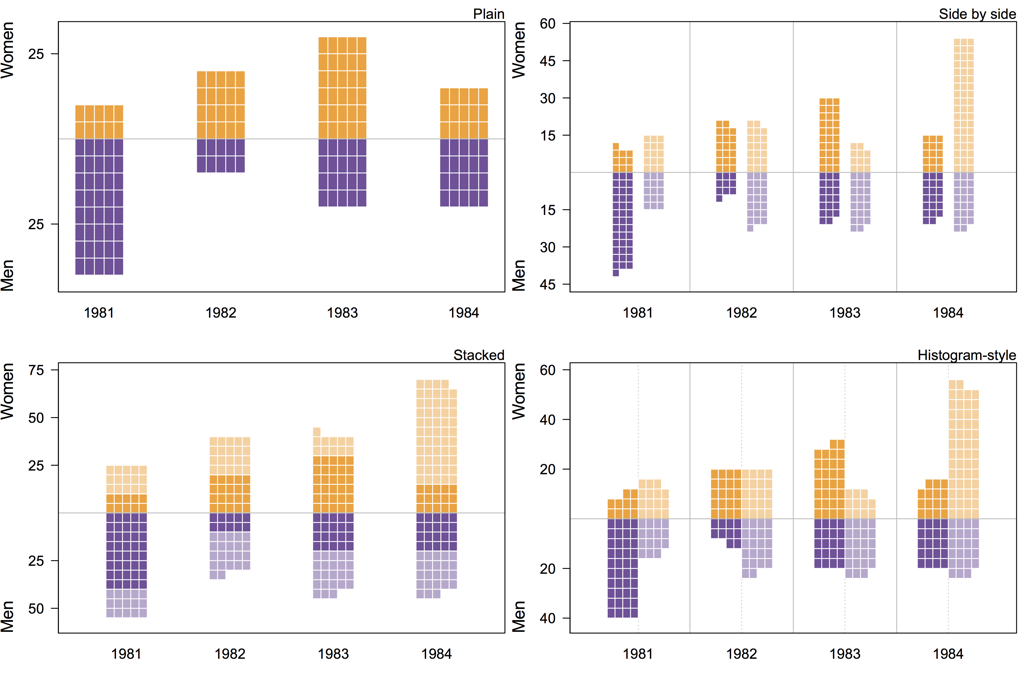
There are four kinds of plots currently supported: plain, side-by-side, stacked, and histogram-style.
| Type | Example use |
|---|---|
| plain | Show group balance across time. |
| side-by-side | Compare group balance across time between two or more populations |
| stacked | Compare group balance in, say, turnover across time |
| hisstogram-style | Compare group balance in distribution of ordinal variable (e.g., grades) |
To install, use the devtools package:
install.packages('devtools') # if necessary

devtools::install_github("richarddmorey/divergingPips", subdir = "divergingPips")
Then run the examples:
example("diverging_pip_plot", "divergingPips")
Or try this example:
frq = array( c(10,40,20,10,
               30,20,15,20,
               15,15,20,22,
               11,23,54,23), dim = c(2,4,2))

rownames(frq) = c("Women","Men")
colnames(frq) = 1981:1984

cols = matrix(c(rgb(255,164,56,maxColorValue = 255),
            rgb(120,80,155,maxColorValue = 255),
            rgb(255,164,56,maxColorValue = 255, alpha=128),
            rgb(120,80,155,maxColorValue = 255, alpha=128)),2,2)

divergingPips::diverging_pip_plot(frq, bar.width = .4, bar.width.n = 5, bar.col = cols, sym = FALSE, stacked = TRUE)
which results in this figure:
