Interactive data markers for matplotlib.
pip install mpl-markersimport mpl_markers as mplmAdd a marker attached to matplotlib data lines:
import numpy as np
import matplotlib.pyplot as plt

fig, ax = plt.subplots(1,1)
x1 = np.linspace(-np.pi, np.pi, 1000)

ax.plot(x1, np.sin(x1)*np.cos(x1)**2)
# create line marker at x=0.
mplm.line_marker(x=0)
In interactive matplotlib backends (i.e. Qt5Agg), the marker can be dragged to any location along the data line, or moved incrementally with the left/right arrow keys. Interactive markers are not supported for inline figures generated in Jupyter Notebooks.
Additional markers can be added by using the Shift+Left Mouse button. The active marker can be removed from the plot by pressing the Delete key.
Axis markers move freely on the canvas and are not attached to data lines. Axis markers can reference other markers to create a delta marker.
fig, ax = plt.subplots(1, 1)
y1 = np.random.normal(6, 3, size=10)

ax.bar(np.arange(10), y1)
ax.margins(x=0.2)

# create horizontal axis marker
m1 = mplm.axis_marker(y=np.min(y1), yformatter="{:.2f}%")

# create second marker that is referenced from the first marker m1
mplm.axis_marker(y=np.max(y1), ref_marker=m1, yformatter="{:.2f}%")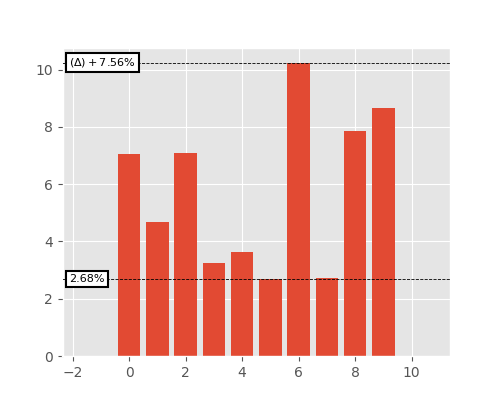
Data markers can also be added to pcolormesh plots. The marker label shows the value of the color-mapped z data.
xy = np.linspace(-1, 1, 100)
x, y = np.meshgrid(xy, xy)
z = np.sin(2*x)**2 + np.cos(3*y)**2

fig, ax = plt.subplots(1, 1)
m = ax.pcolormesh(x, y, z, vmin=0, vmax=2)
plt.colorbar(m)

# add a data marker at a single x/y point on the plot. x/y is in data coordinates.
mplm.mesh_marker(x=0.75, y=0)
The marker style is controlled by the mpl_markers/style/default.json file:
{
    "xline": {
        "linewidth": 0.6,
        "color": "k",
        "linestyle": "dashed"
    },
    "yline": {
        "linewidth": 0.6,
        "color": "k",
        "linestyle": "dashed"
    },
    "xlabel": {
        "fontsize": 8,
        "color": "black",
        "bbox": {
            "boxstyle": "square",
            "facecolor": "white",
            "edgecolor": "black",
            "alpha": 1,
            "linewidth": 1.5
        }
    },
    "ylabel": {
        "fontsize": 8,
        "bbox": {
            "boxstyle": "square",
            "facecolor": "white",
            "edgecolor": "black",
            "alpha": 1,
            "linewidth": 1.5
        }
    },
    "datadot": {
        "markersize": 10,
        "marker": "."
    },
    "axisdot": {
        "markersize": 10,
        "marker": ".",
        "markerfacecolor":"white",
        "markeredgecolor":"k"
    }
}
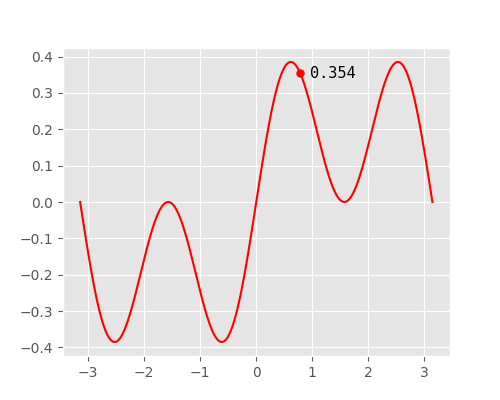
To use custom styles on a single marker, pass in a dictionary of artist settings that matches the keys in this file. To turn on/off any of the artists, pass in True/False instead of a dictionary.
For example, this will turn off the box around the data label and add an xlabel artist.
mplm.line_marker(
    x=np.pi/4,
    ylabel=dict(fontfamily="monospace", bbox=dict(linewidth=0, facecolor="none")),
    xlabel=True
)
Custom .json files are supported with the mplm.set_style method. This will set the style on all future markers and must have the same keys as the default.json file.
mplm.set_style("user_style.json")mpl-markers is licensed under the MIT License.