Quantitative trading using Golden Cross and EMA.
In the last few years, the golden crossover and death crossover trading strategy has seen vast popularity and has been widely used by traders in hopes to gather significant returns. Through this project, we try to implement this trading strategy and compare its performance with a buy and hold strategy across equity, forex, and cryptocurrency segments.
Moving Average: A moving average is a technical indicator used by market speculators and traders in which the price of a security is summed up over a specified period and averaged out. This moving average is plotted on the price chart to observe trends in the movement of the security. There are two main types of moving averages which are simple moving average (SMA) and exponential moving average (EMA).
Simple Moving Average: This indicator takes the sum of the price over the specified period and finds the average value over the period. This is a lagging indicator which to look for entry and exit in the security.
Exponential Moving Average: This indicator is like SMA except the fact that it gives more weightage to recent data points to account for recent price changes. It does so by including a smoothing factor which can be variable. The most common smoothing factor is 2.
Golden crossover: A golden cross is a trading pattern in which a short-term moving average crosses the long-term moving average from below. This is seen as a bullish indicator by trends wherein the security has gained recent momentum and has seen a breakout. Primarily, the 50-day MA is seen as the short-term moving average and the 200-day MA is seen as the long-term moving average.
Death crossover: A death cross is a trading pattern in which the short-term moving average crosses the long-term moving average from above. This is seen as a bearish indicator wherein the security is seeing a downward momentum.
The golden cross and death cross can be combined as a trading strategy to find good entry and exit points into the market. The strategy can be back tested on historical data to check its performance before actual deployment of any capital into the trading strategy.
This strategy is tried on three different assets with varying pairs. They are stocks, currencies and cryptocurrencies. They are all collected automatically using APIs. For the case of stocks and currencies, the data is collected from Yahoo Finance using their API. While cryptocurrencies data is collected from Binance. Using a python script, 10 years of historical data is collected from the API with an interval of 1 day.
For stocks, the data collected are from the Russell 3000 and SNP500. There would be a total of 3500 stocks. However, the stocks that do not have complete 10 years of daily data would be removed. Holidays, non-trading days and any abnormal data are deleted. In this case, there would only be 2500 stocks. The industry of the stocks varies and the industry each stock is in are also different. Having variety is good as it shows what works and what doesn’t.
Currencies data is also collected through Yahoo Finance. Over 30,000 currency pairs are searched on Yahoo Finance. However, only 500 currency pairs are available. The currencies that do not have the complete 10 years will also be deleted.
Cryptocurrency data is slightly trickier. Since cryptocurrency is a new asset class, Binance does not have daily price for 10-years. It only stores data up till 2017. Hence, for cryptocurrencies, missing data is not deleted. However, each token pairs are analysed individually. Only when the token pair has been delisted from Binance, the token pair is deleted from the analysis. Binance stored a total of 500+ trading pairs and daily price can be easily extracted using the API.
Cleaning is done through a series of python codes. It can easily be done by dropping a whole column whenever there is missing data. Back-testing is also done though python which would be further described in the later chapter.
Short and long EMA are calculated based on input periods. Post this, we find the difference between the short and long MA and note the point of sign changes. If sign goes from -1 to +1, that implies a golden crossover, and we take a long position. If the sign changes from +1 to -1, close the long position and then possibly taking a short position. We take note of the dates when these positions have been taken and sum up the log returns during this trading period and then convert it back to percentage returns. We plot this alongside a buy and hold strategy to compare the performance of this strategy. We perform this process for various types of EMA/SMA/Prices and choose the strategy with the best performance.
Best Trading Performance – Equity

The best returns for our strategy have been seen in equity. We achieve a total return of 189.2% from May 2012 to May 2022 which is an annualized return of 11.2%. SPY’s annual max drawdown is 0.8728 and Sharpe ratio is 0.8015. In this case, we chose the price chart as the short-term trend and 200-day EMA as the long-term moving average after various combinations were tested. For this model, long positions are closed when we encounter a death cross and no short position is taken.
Worst Trading Performance – Forex

We saw the worst returns in the forex category from May 2012 to May 2022. The total returns over the 10 years were -61.3% using the 50 day and 200-day EMA. EX’s max drawdown is -0.8389 and Sharpe ratio is -0.0187. This was because the strategy was implemented on all forex pairs, but it works well only for a few pairs with strong momentums. In this model, long position is closed when we encounter a death cross and a short position is taken and vice versa for golden cross.
Average trading performance – Cryptocurrency
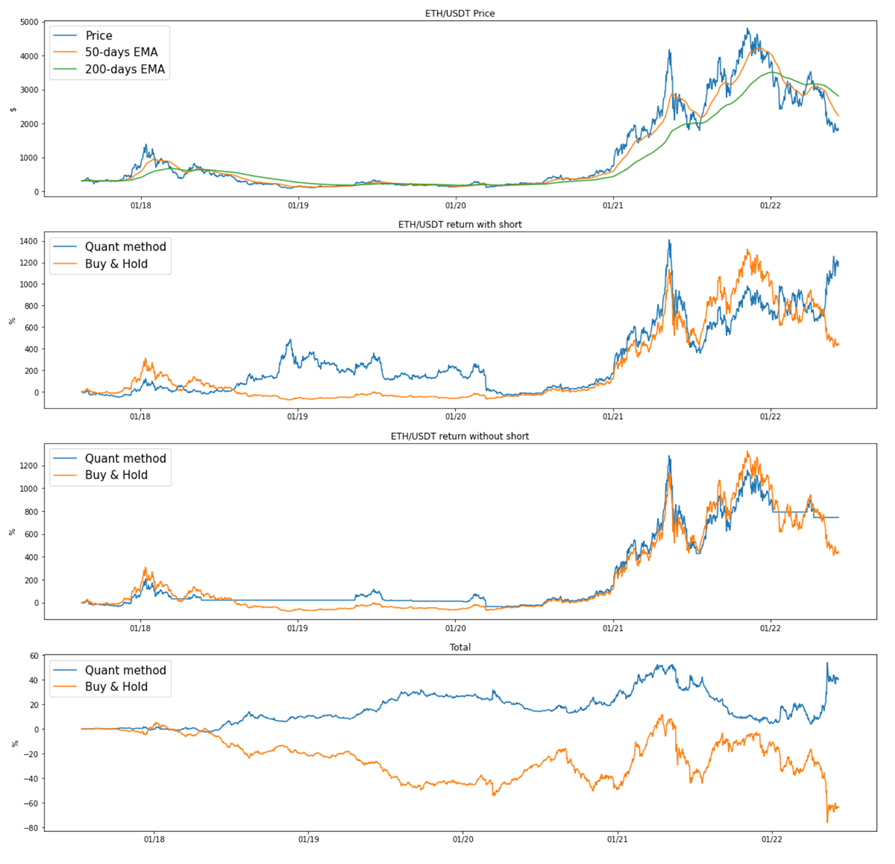
In case of cryptocurrencies, we achieved median returns of 40.91% from July 2017 to June 2022 which converts to an annualized return of 7.1%. Cryptocurrency’s max drawdown is 0.5898 and Sharpe ratio is -0.6826. In this case, we chose the price chart as the short-term trend and 200-day EMA as the long-term moving average Due to very high volatility, cryptocurrency trades need quick actions to avoid high drawdown. In this model, the strategy is similar to forex.
Observations
We observed that there were better returns in case of long only strategy then long and short strategy in case of equity. The returns also varied greatly between various combinations of Price/SMA/EMA’s. Often, it was difficult to beat the market thus the strategy needs further improvements.
Limitations
The issue with moving averages is that they are lagging indicators thus they can generate signals long after the trend has passed. Also, there is always a possibility of false signals being generated in cases of the security trading in a small channel. Contrasting trends can also be observed on varying time periods.
Optimizations
Further improvements can be confirming signals across varying periods before taking any action. We can also account for diversification for better returns and adding a threshold return and a stop loss can lead to significant improvements to the performance of the trading strategy.