![]()


Create mermaid graphs from the method resolution order (mro) of Python objects.
For the examples below, let's consider the following classes saved in a file code.py that can be imported via import code (adjust your PYTHONPATH if this is not the case).
# code.py

class A(object):
    pass

class B(object):
    pass

class C(A):
    pass

class D(C, B):
passSimply pass the module and class in the format module_name:class_name to mermaidmro.
> mermaidmro code:D

graph TD
    code.D("code.D (0)")
    code.C("code.C (1)")
    code.A("code.A (2)")
    code.B("code.B (3)")
    object("object (4)")

    code.C --> code.D
    code.B --> code.D
    code.A --> code.C
    object --> code.B
    object --> code.A
You can hide the mro indices by adding --no-mro / -n.
> mermaidmro code:D --no-mro

graph TD
    code.C --> code.D
    code.B --> code.D
    code.A --> code.C
    object --> code.B
    object --> code.A
You can also limit the maximum depth via --max-depth / -m.
> mermaidmro code:D --no-mro --max-depth 1

graph TD
    code.A --> code.D
code.B --> code.DJust configure the executable of your browser you like to open the graph with via --cmd / -c (on Macs this is usually just open).
This functionality is based on the mermaid.live service.
> mermaidmro code:D --cmd open

# opens https://mermaid.ink/img/pako:eNptkM8KwjAMh18l5JSBE_-dPAht9wgec6lbdYrdZNTT2LvbUUvLWE6_fB8kISPWfWPwDPgY9KeFa8Ud-JrptiLGEIB2BWORORWdAtovnIhOAB0WTkYngY7J9beXqZ13IQCdgss3Qlle_oflA9exSFjlKxKW61jgBtCawepnM_9lZHStsYZ9w9iYu_6-HeOE0w_Nr1i5?type=png
To open the graph in the live editor, add --edit.
This requires that you have a tool installed that lets you visualize images in your terminal, e.g. imgcat for iTerm2.
> mermaidmro code:D --visualize imgcat

# shows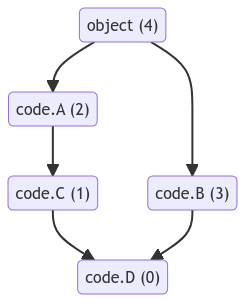
> mermaidmro code:D --download graph.pngSimply install via pip
pip install mermaidmro- Source hosted at GitHub
- Report issues, questions, feature requests on GitHub Issues
If you like to contribute, I'm happy to receive pull requests. Just make sure to add a new test cases and run linting and coverage checks:
> ./tests/test.sh
> ./tests/lint.sh
> ./tests/coverage.sh