Stream2segment as command line application
Stream2segment (s2s) is a program to download, process and visualize event-based seismic waveform data (segments). It is particularly dedicated and optimized to the task of managing huge amounts of relatively short segments.
Stream2segment is primarily a command line application which can be used by opening a terminal and typing s2s or stream2segment followed by a specific command representing a specific task (type s2s --help for details), but it also features utilities and tutorials for running your custom processing on the downloaded data (see the Process section below and the Jupyter notebook wiki page)
Note: All commands below have to be run in a Python virtual environment (see installation instructions): remember to activate the virtual environment first (e.g.
source <env_path>/bin/activateand typedeactivateto resume to the system env)
| Initialize | Download | Visualize | Process | Utilities |
|---|
s2s init OUTDIR
This command creates template files for launching download, manage and process the downloaded data, including a Jupyter notebook also available online. OUTDIR will be created if it does not exist
All files are intended to be easily configured by the user, and contain all the necessary documentation
Edit the download.yaml file created with s2s init (at least the DB path, which can be Sqlite or a Postgres) and then run s2s download (s2s download --help for details) to perform all the steps required for downloading the desired events, data and metadata.
Note The supported database types are SQLite and Postgres: for massive downloads (as a rule of thumb: ≥ 1 million segments) we suggest to use Postgres. In any case, we strongly suggest running the program on computers with at least 16GB of RAM.
Note massive downloads are time-consuming operations where it is likely to miss some data due to any kind of temporary connection problems. Consequently, it is advisable to perform the same massive download at least twice with the same configuration(subsequent runs will be faster as data will not be re-downloaded unnecessarily)
A Terminal window excerpt of a typical download routine looks like this:
(env) s2s@localhost:~$ s2s download -c download.yaml

STEP 1 of 7: Fetching events
Db table 'web_services': 1 new row inserted (no sql error)
Request seems to be too large, splitting into sub-requests
 ●●●●●●●●●●●●●●●●●●●●●●●●●●●●●●●●●●●● 100%
Db table 'events': 1212 new rows inserted (no sql error)

STEP 2 of 7: Fetching data-centers
Db table 'data_centers': 1 new row inserted (no sql error)

STEP 3 of 7: Fetching stations and channels from 1 data-center
 ●●●●●●●●●●●●●●●●●●●●●●●●●●●●●●●●●●●● 100%
Db table 'stations': 20 new rows inserted (no sql error)
Db table 'channels': 117 new rows inserted (no sql error)

STEP 4 of 7: Selecting stations within search area from 1212 events
 ●●●●●●●●●●●●●●●●●●●●●●●●●●●●●●●●●●●● 100%

STEP 5 of 7: 127569 segments found. Checking already downloaded segments

STEP 6 of 7: Downloading 127569 segments (open data only) and saving to db
 ●●●●○○○○○○○○○○○○○○○○○○○○○○○○○○○○○○○○  12%  07:17:04
Download routine features and description
The download routine can be started by editing the parameters of the download config and running the relative command. The routine fetches the requested events and then searches for stations and channels available (in case of network error, the data is fetched from the database, if any): the corresponding parameter accepts FDSN compliant URLs or the special words “eida” or “iris”. The search of channels can be tuned with a parameter controlling the minimum sampling rate and with constraint parameters (network, station, location and channel) which additionally accept the leading character “!” representing exclusion (e.g. “!A*”). Note that a station is internally uniquely identified by the tuple (network code, station code, start time), meaning that the same physical station closed and re-opened later is saved as two different station entities in our database (this also allows to handle the relative inventories separately, which might be different). Note also that the same station might be returned by more than one station web service: when providing "eida", being EIDA a federated organization of data centers, a so-called Routing Service is used to map each station to a single data center URL. In any other case, station duplicates might unfortunately always be returned: Stream2segment simply ignores duplicated stations, keeping only the first fetched from the web service, in case. Then, if a station (or channel) is found on the database, the database station (or channel) will be used as segment metadata. This behaviour can be changed with the "update_metadata" parameter, usually in conjunction with the "inventory" parameter, to overwrite existing stations (and channels) on the database, and optionally their inventories (see download config documentation for details): this might be handy, e.g., if you perform several downloads with different web services and you want to force duplicated stations and channels to be fetched and saved from a specific "trusted" web service among them.
With all the list of events and stations, for each event epicentre the program finds iteratively the nearby stations by means of a circle area (whose configurable radius can be constant or magnitude dependent), or an Annulus: this results in a list of potential segments to be downloaded. For any of these segments the time at which the segment event reaches the segment’s station (arrival time) is efficiently calculated by interpolation on a regular grid of distance and source depth and pre-computed (by means of obspy functions) travel times. The grid can be configured by supplying the name of one of four pre-computed grids. With the configurable (arrival time dependent) window every information is now available in order to download the waveform data segments from the relative data center URLs. Given the amount of data to fetch compared to station and event requests, this is the more demanding step. Therefore, stream2segment packs together all segments belonging to the same time-window and data center, and queries all segments at once, reducing the number of connections and running each request in a parallel thread to further optimize blocking IO- operations.
Even more important in this stage is a detailed tracking of the download results: massive downloads should be generally performed more than once with the same parameters set, as network problems which might be solved in a further download are likely to happen. For each requested waveform, stream2segment saves a code denoting the download state, either issued by the server (data center) or by reading all successfully received waveforms by means of an efficient diagnostic module originally implemented for SeisComP3. This results in a broad and configurable spectrum of cases whereby it is possible to retry the download of already saved segments . The diagnostic also returns several information hold in the waveform header which a RDBMS can efficiently store to perform powerful segments selections in the processing phase: maxgap numsamples, data seed id, sample rate (which might differ from the one stored on the associated station’s channel), start time and end time. The last two parameters are particularly important: as the time window of the received segment data might not match the requested time window (RTW). All miniSEED records (chunk of data) outside the RTW will be discarded, avoiding saving useless data. The optional configurable last step is the download of the station inventories (xml format) which will be saved (compressed to optimize storage size) only for stations who have at least a downloaded segment with data. Depending on the configuration, already downloaded inventories will be skipped (the default) or overridden.
After downloading, you can visualize raw waveforms and their meta-data in a browser GUI out-of-the-box via the s2s show command, by simply indicating with the -d option the database URL or, as in the example below, the download configuration used (with the URL in it):
(env) s2s@localhost:~$ s2s show -d download.yamlIn most cases it is more useful to visualize processed waveforms and/or custom plots. This is possible by passing a Python module with the plot functions implemented in it. Streams2segment offers with s2s init an already compiled module gui.py. By running:
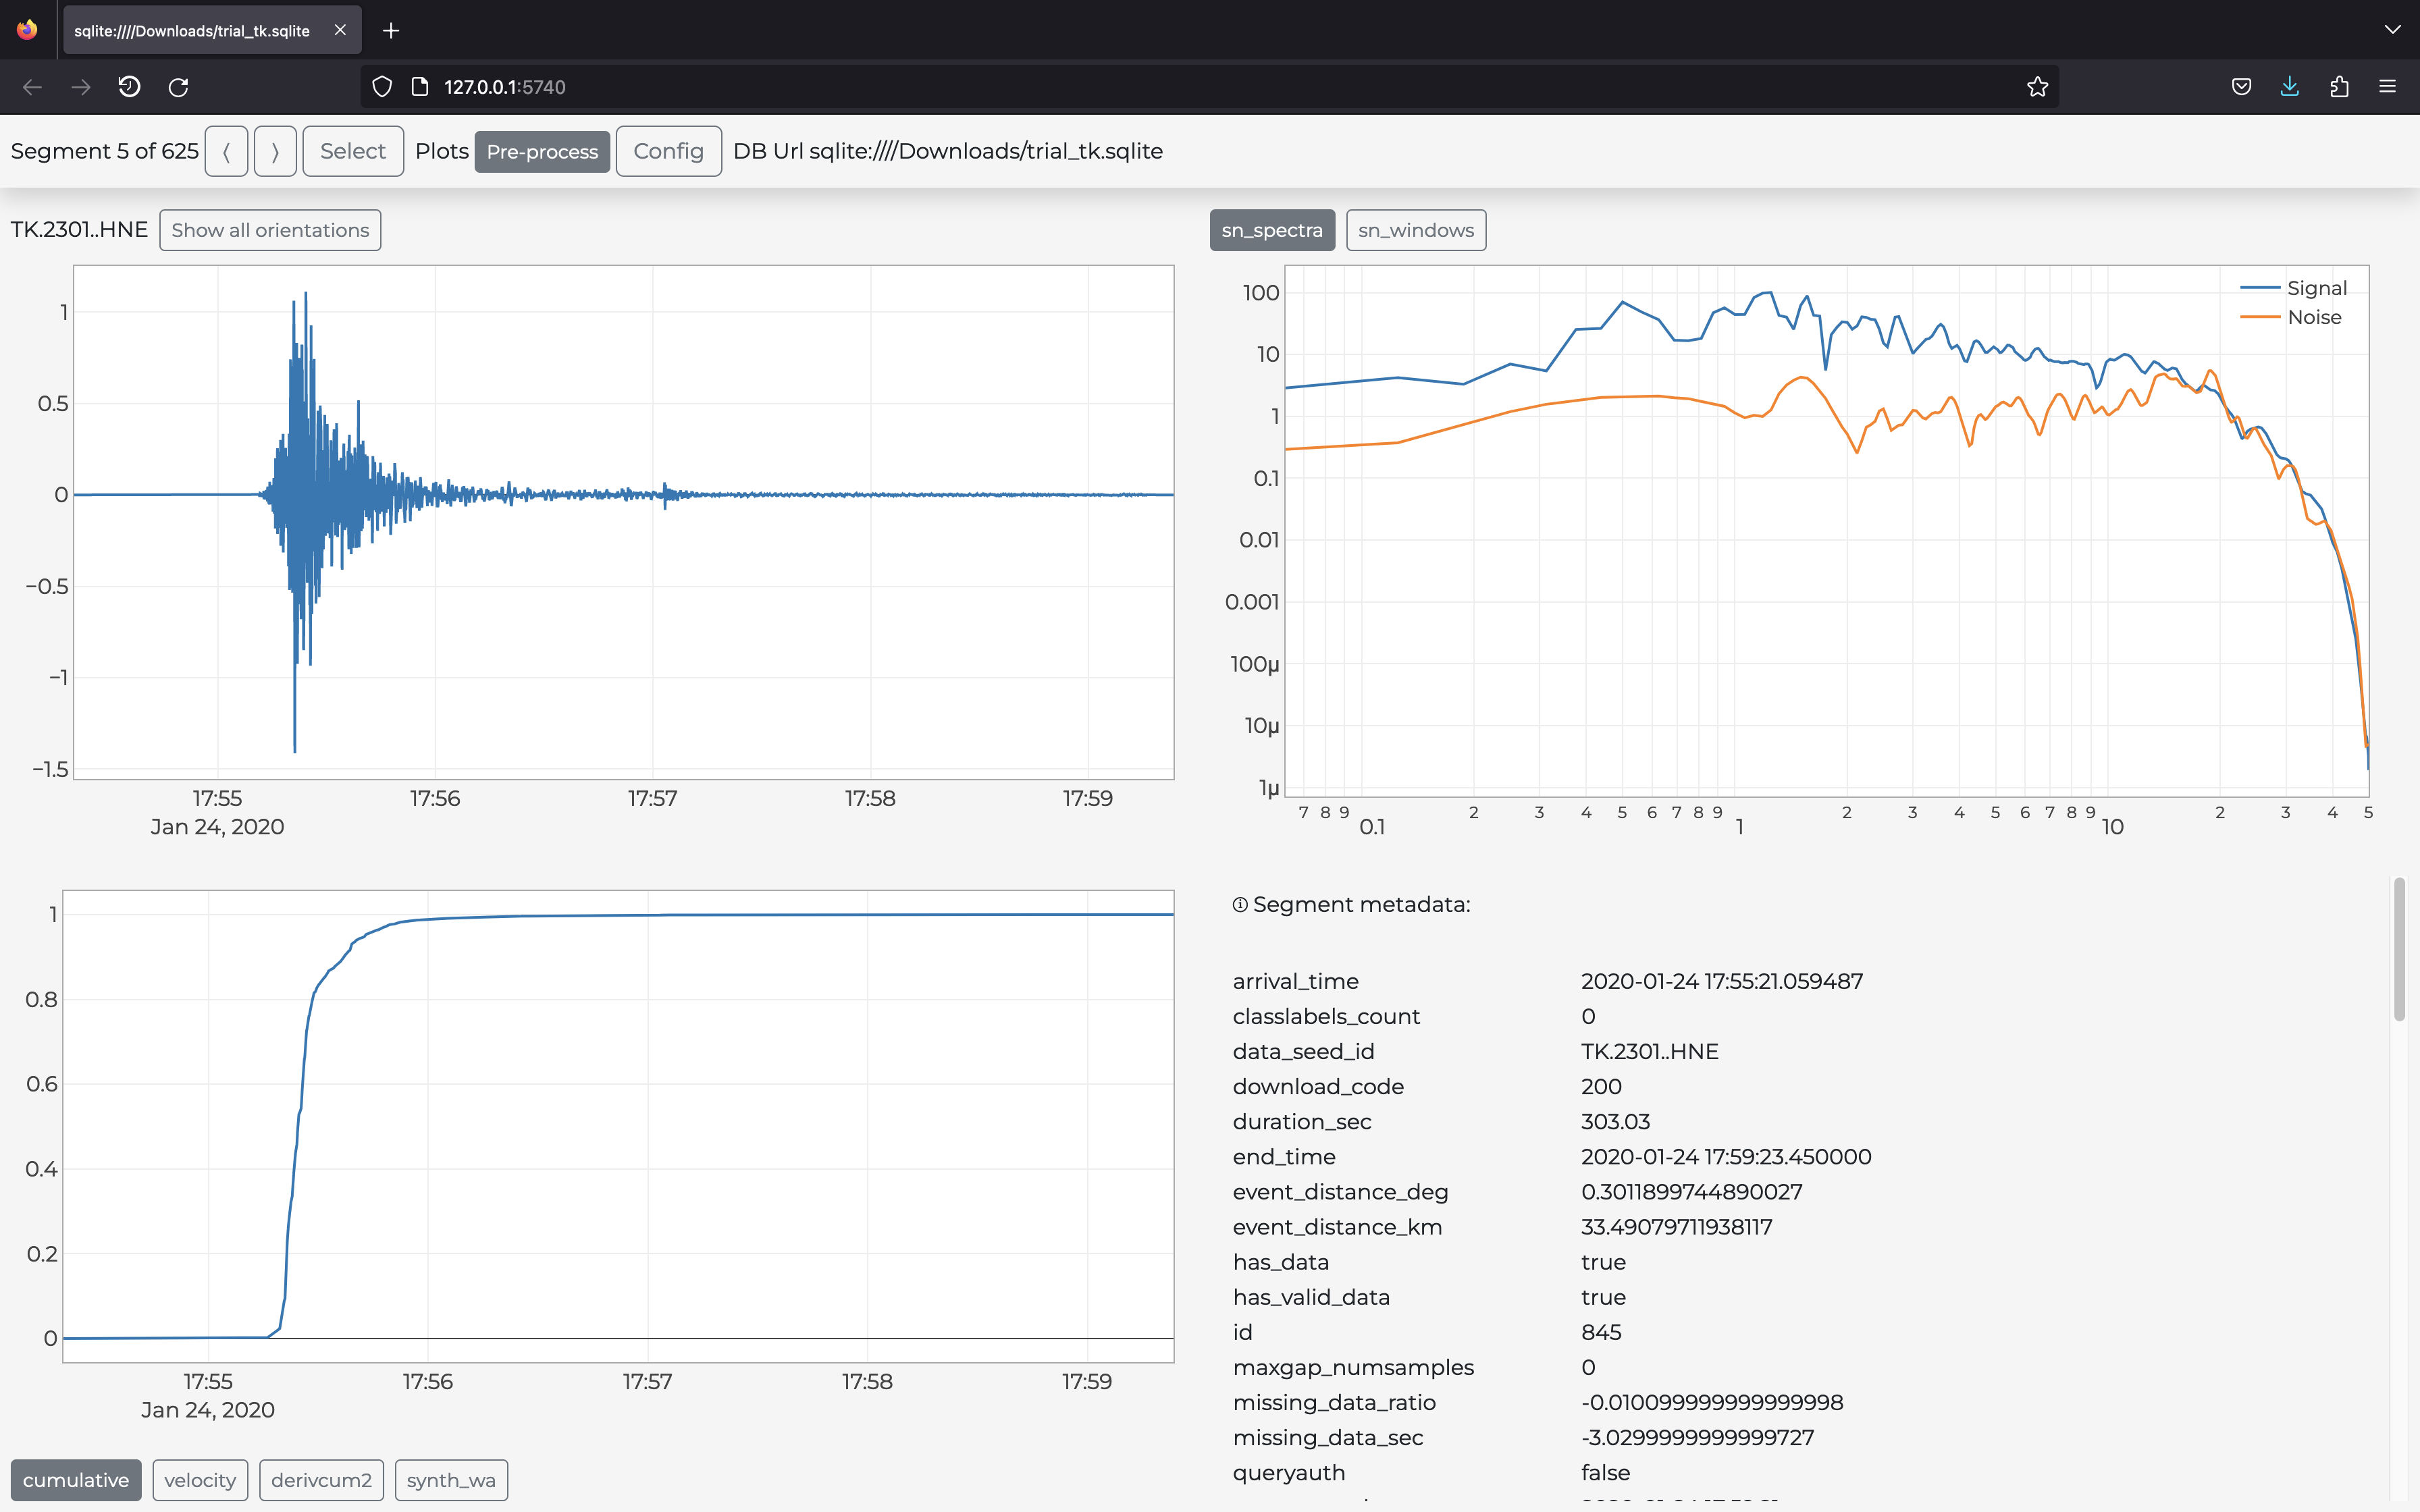
(env) s2s@localhost:~$ s2s show -d download.yaml -p gui.pyyou will see the GUI depicted in the figure below. As always, gui.py can be customizable with any user defined plot or Python code: simply open the file and follow the specifications therein to produce your custom GUI.
Note remember there is also an optional
configin YAML syntax that can be used in your plot functions to tune your plots, and that are editable from within the GUI to update the plots dynamically. If a config is not passed, stream2segment will search for one matching the processing file (if not found, then your module is assumed to work without config). Because the commands2s initalso creates agui.yamlfile, the previous command is equivalent to:
(env) s2s@localhost:~$ s2s show -d download.yaml -p gui.py -c -p gui.yamlType s2s show --help for further details. Example of the output of the command above (opened in the user browser):
With Stream2segment, you can also create class labels that can be toggled (on/off) for each segment from within the GUI: just define your labels with the command s2s db classlabel, and those labels will appear in your GUI to annotate segments via checkbox controls (for ref., in the lower right corner of the figure above). Class labels will be stored on the chosen database alongside data and metadata. Annotating segments via class labels is useful to select/discard data later in your processing code, or prepare labelled databases for e.g. supervised machine learning applications
The processing of data involves several applications, tools and requirements that Stream2segment tries not to "reinvent the wheel" but to help users accomplish their needs, especially when dealing with a database storage, via Python code templates and tutorials that can be easily customized:
-
An online description of the Segment object that might be useful in any custom Python code, and where the user can see the benefits of a backend database when accessing, filtering and selecting data
-
Two files, available via
s2s initand as always fully documented to be easily customized:-
a Jupyter notebook also available online on a separate page of this wiki
-
A Python module (as of 2023,
paramtable.py) that can be run as a script to produce a parametric table from the downloaded data and metadata. This file needs some configuration (at least the database URL), so open it before run and check at least the last part after "if name == main" where all specifications are written, before run.
-
IMPORTANT Although less intuitive than a Notebook, a Python module should be the preferred choice for heavy operations both in terms of memory or time, because it runs without interfaces in pure Python, and exploits several high-level features of Stream2segment such as an optimized I/O with the DB, and the automatic display of progress bar + estimated time available. This is an example of a terminal window after running a custom Python module:
(env) s2s@localhost:~$ s2s python paramtable.py
╔════════════════════════════════════════════════════════════════════╗
║ Input database:      postgresql://user:***@host/db_name            ║
║ Processing function: /Users/s2s/configs/process.py:main            ║
║ Config. file:        /Users/s2s/configs/process.yaml               ║
║ Log file:            /Users/s2s/output.hdf.2019-12-02T11:25:04.log ║
║ Output file:         /Users/s2s/output.hdf                         ║
╚════════════════════════════════════════════════════════════════════╝
Fetching segments to process (please wait)
116247 segment(s) found to process
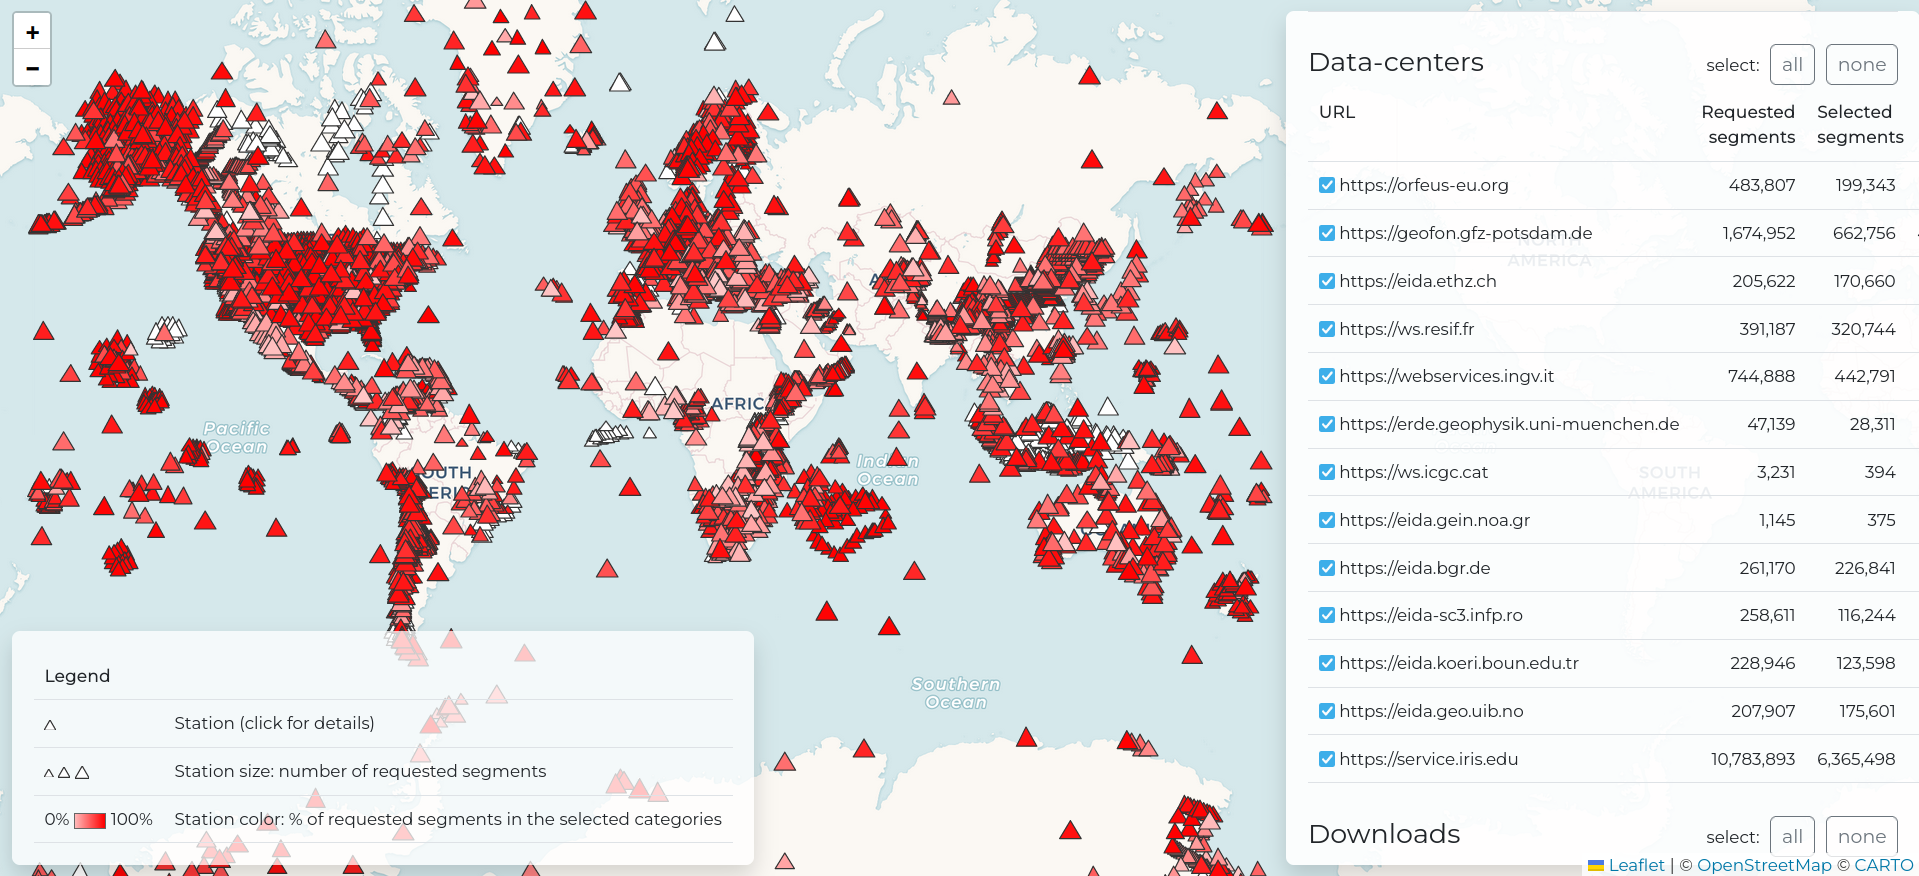
●●○○○○○○○○○○○○○○○○○○○○○○○○○○○○○○○○○○ 2% 18:40:43Alongside s2s db classlabels, stream2segment implements several other utilities for managing the database and the downloaded data. You can always inspect them with the s2s --help command. For instance, users can inspect the downloaded data by creating user-defined HTML pages, as in the example below (s2s dl stats command):