This is a tool for graphically illustrating the (possibly time-dependent) Markov chain underlying a Markov Decision Process (MDP).
First define the transition probabilities of the MDP in mdp.py along with the
number of actions and the state labels. A variant of the standard machine
replacement problem is provided as an example in the file.
To run MDP-Explore, type pythonw main.py.
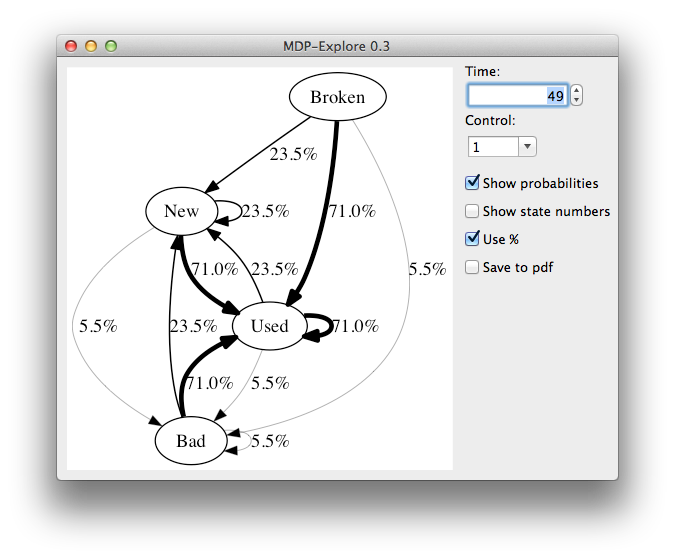
The states will be plotted along with the transitions. If Show probabilities is enabled, then the transition probabilities will be added as labels to the transitions. The thicknesses of the arrows is proportional to the transition probabilities. You can choose which action and time that should be used to evaluate the transition matrix.
The current plot is saved and can be found in the img/ folder.

MDP-Explore requires graphviz and wxPython to run.
On OSX, these can be installed by running brew install graphviz, pip install graphviz and brew install wxpython. If you run into problems with
linking libpng, try running sudo chown -R $USER:admin /usr/local/share/man/man5 (see
this).