-
Notifications
You must be signed in to change notification settings - Fork 0
/
aula5-regressao.Rmd
270 lines (187 loc) · 7.43 KB
/
aula5-regressao.Rmd
1
2
3
4
5
6
7
8
9
10
11
12
13
14
15
16
17
18
19
20
21
22
23
24
25
26
27
28
29
30
31
32
33
34
35
36
37
38
39
40
41
42
43
44
45
46
47
48
49
50
51
52
53
54
55
56
57
58
59
60
61
62
63
64
65
66
67
68
69
70
71
72
73
74
75
76
77
78
79
80
81
82
83
84
85
86
87
88
89
90
91
92
93
94
95
96
97
98
99
100
101
102
103
104
105
106
107
108
109
110
111
112
113
114
115
116
117
118
119
120
121
122
123
124
125
126
127
128
129
130
131
132
133
134
135
136
137
138
139
140
141
142
143
144
145
146
147
148
149
150
151
152
153
154
155
156
157
158
159
160
161
162
163
164
165
166
167
168
169
170
171
172
173
174
175
176
177
178
179
180
181
182
183
184
185
186
187
188
189
190
191
192
193
194
195
196
197
198
199
200
201
202
203
204
205
206
207
208
209
210
211
212
213
214
215
216
217
218
219
220
221
222
223
224
225
226
227
228
229
230
231
232
233
234
235
236
237
238
239
240
241
242
243
244
245
246
247
248
249
250
251
252
253
254
255
256
257
258
259
260
261
262
263
264
265
266
267
---
title: "Correlação e regressão"
author: "Rodrigo Rocha"
date: "20/10/2016"
output: ioslides_presentation
---
```{r setup, include=FALSE}
knitr::opts_chunk$set(echo = FALSE)
library(datasets)
library(MASS) # sample
library(knitr)
library(pander)
library(dplyr, warn.conflicts = FALSE)
set.seed(0)
survey <- MASS::survey
files <- read.csv(gzfile('data/eclipse-metrics.csv.gz'))
bugs <- readRDS('data/netbeans-platform-bugs.rds')
builds <- readRDS('data/travis-sample.rds')
projects <- builds %>%
group_by(gh_project_name) %>%
summarise(language = last(gh_lang),
teamsize = last(gh_team_size))
files100 <- files %>% filter(version == 3) %>% sample_n(100)
bugs100 <- bugs %>% sample_n(100)
builds100 <- builds %>% sample_n(100)
projects30 <- projects %>% sample_n(30)
survey30 <- survey %>% sample_n(30)
```
# Correlação e regressão
## Introdução
- Correlação e regressão são métodos para estimar o relacionamento entre duas variáveis numéricas
## Correlação
- É uma medida da dependência entre duas variáveis
- A correlação, r, é um valor entre -1 e 1
- Quanto mais distante de 0, mais forte é a correlação
- A correlação pode ser positiva (> 0) ou negativa (< 0)
- Exemplo mais comum é a correlação linear
- Indica que a relação entre as variáveis é uma equação linear (1o grau):
- Ex.: para variáveis x e y, `y = a*x + b` (onde a e b são constantes)
## Força da correlação
- De acordo com seu valor, a correlação pode ser:
- -1.0 a -0.5 ou 1.0 a 0.5: Forte
- -0.5 a -0.3 ou 0.3 a 0.5: Moderada
- -0.3 a -0.1 ou 0.1 a 0.3: Fraca
- -0.1 a 0.1: Muito fraca ou nenhuma
- Essa classificação é subjetiva. Você pode encontrar outros valores em outros lugares.
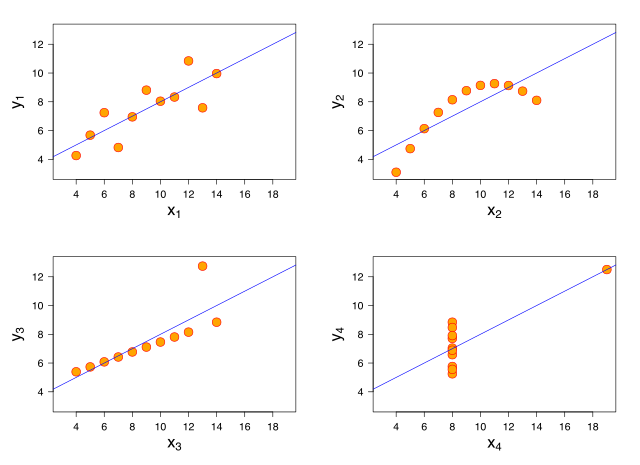
## Correlação linear

## Correlação linear
## Correlação: exemplo em R
```{r echo=T}
# Data set mtcars:
# mpg = milhas por galão (consumo)
# hp = horsepower
plot(mtcars$hp, mtcars$mpg)
```
## Correlação: exemplo em R
```{r echo=T}
cor.test(mtcars$hp, mtcars$mpg) ## teste de significância
# uma correlação pode ser alta e
# não ser estatisticamente significativa!
```
## Métodos de correlação
- Correlação linear de Pearson (paramétrico). Pressupostos: normalidade, ausência de outliers, linearidade e homocedasticidade.
- Correlação de Spearman (não-paramétrico). Mede se existe uma relação monotônica entre as variáveis (ex.: as duas crescem ou as duas diminuem).
- Correlação de Kendall (não-paramétrico). Como Spearman, porém mais adequado quando há valores iguais e amostras pequenas
- Cada método tem seus pressupostos
## Correlação de Spearman

## Correlação de Spearman: exemplo em R
```{r echo=T}
cor.test(mtcars$hp, mtcars$mpg, method="spearman")
```
## Regressão linear
- A regressão linear, além de medir a força da dependência entre duas variáveis (como a correlação), também estima os parâmetros a e b da reta que relaciona as variáveis
- É uma técnica para **modelagem estatística**
- Regressão linear: estimar a e b na equação linear y = ax + b de forma a obter a reta que se ajusta melhor nos dados

## Regressão linear: exemplo em R
```{r echo=T}
modelo <- lm(mpg ~ hp, data=mtcars)
plot(mtcars$hp, mtcars$mpg)
abline(modelo, col="red")
```
## Regressão linear: exemplo em R
- O valor de `b` é chamado de Intercept.
```{r echo=T}
print(modelo)
```
## Regressão linear e coeficiente de determinação
- O coeficiente de determinação, R², mede a força da relação linear entre as variáveis
- Varia de 0 (mais fraco) até 1 (mais forte)
- R² é o quadrado da correlação de Pearson entre as variáveis
## Regressão linear: exemplo em R
Detalhes do modelo de regressão podem ser obtidos com `summary(modelo)`
## Regressão linear: exemplo em R
```{r echo=F}
summary(modelo)
```
## Regressão múltipla
Na regressão múltipla, consideram-se 2 ou mais variáveis independentes.
```{r echo=T}
modelo <- lm(formula = mpg ~ hp + wt + cyl, data = mtcars)
print(modelo)
```
## Regressão múltipla: exemplo em R
```{r echo=F}
summary(modelo)
```
## Regressão logística
- Tipo de regressão em que a variável de saída (dependente) é binária (0 ou 1)

## Regressão logística
- A regressão modela os dados através de uma curva sigmoidal
- Sendo:
- x a variável independente (numérica)
- y a variável dependente (binária: 0 ou 1)
- Então o valor previsto pelo modelo de y para um determinado x é
- 0, se f(x) < 0.5
- 1, se f(x) >= 0.5
## Regressão logística: exemplo em R
- Vamos tentar prever o tipo de motor de um carro a partir da sua potência
- 0 = motor em V; 1 = motor reto
```{r}
mtcars %>% select(hp, vs) %>% pander()
```
## Regressão logística: exemplo em R
```{r}
plot(mtcars$hp, mtcars$vs)
```
## Regressão logística: exemplo em R
```{r echo=T}
library(MLmetrics, warn.conflicts = FALSE)
# vs: tipo de motor (0 = motor em V, 1 = motor reto)
# hp: potência do motor, em cavalos
# Cria modelo de regressão logística
logreg <- glm(formula = vs ~ hp,
family = binomial(link = "logit"), data = mtcars)
# Usa o modelo para prever o tipo de motor
dados <- mtcars %>%
select(hp, vs) %>%
mutate(vsPrevisto = ifelse(logreg$fitted.values < 0.5, 0, 1))
```
## Regressão logística: exemplo em R
```{r}
plot(dados$hp, dados$vs)
curve(predict(logreg, data.frame(hp=x), type="response"), add=TRUE)
```
## Regressão logística
```{r echo=F}
dados %>% pander()
```
## Regressão logística
- O modelo de regressão logística prevê o valor da variável de saída (0 ou 1)
- O valor pode estar certo ou errado
- Podemos montar uma tabela de contingência com a combinação resultado real, resultado previsto
## Tabela de contingência
```{r echo=T}
xtabs(~ vsPrevisto + vs, data=dados)
```
## Positivos e negativos, verdadeiros e falsos
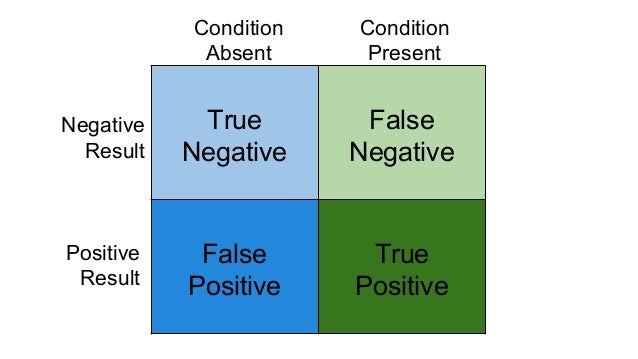
## Acurácia
- Acurácia: acertos / total de registros
- = (TP + TN) / (TP + TN + FP + FN)
- = proporção de elementos na diagonal principal da tabela de contingência
## Precisão e recall

## Precisão e recall

## F-measure ou F1 Score
- Ponderação entre precisão e recall
- F = 2 * precisão * recall / (precisão + recall)
## Precisão e recall: exemplo em R
```{r echo=T}
Accuracy(y_pred = dados$vsPrevisto, y_true = dados$vs)
Precision(y_pred = dados$vsPrevisto, y_true = dados$vs)
Recall(y_pred = dados$vsPrevisto, y_true = dados$vs)
F1_Score(y_pred = dados$vsPrevisto, y_true = dados$vs)
```
<!--
## Precisão e recall
- O que é mais importante? Alta precisão ou alto recall?
- Depende da aplicação
- Ex.: queremos prever o resultado de uma build com base nas características do commit
-->