Rperform: Performance analysis of R package code
There exists various tools and software to help developers across different languages test the performance of their code. This analysis can be performed in terms of quantifiable metrics such as time, memory, etc. R, however, lacks a standard tool for performance testing R packages. Rperform had started as a GSoC 2015 project to tackle the same problem. From its README,
Rperform is an R package that makes it easy for R package developers to track quantitative performance metrics of their code, over time. It focuses on providing changes, related to time and memory, brought over in the package’s performance metrics over subsequent development versions and across git branches. Also, you can use Rperform with travis-ci to do performance testing during your travis build by adding some sample scripts to your git repository.
This particular project will mainly deal with improving and expanding on Rperform's functionalities as well as implementing a coherent user interface (UI) for the package developers to view the performance analysis of their code.
TODO what tools exist in other languages? e.g. Wes McKinney's vbench project for python, airspeedvelocity and codespeed.
Tools employing visualization and version control:
- airspeedvelocity (asv): A tool for benchmarking Python packages over their lifetime. The results are displayed in an interactive web frontend that requires only a basic static webserver to host.
- vbench: A lightweight Python library to catch performance regressions. It integrates with git to run performance benchmarks for every revision of source repository, persisting the results in SQLite and generating graphs with matplotlib.
- codespeed
Tools employing visualization:
- snakeviz: A browser based graphical viewer for the output of Python’s cProfile module.
- dotTrace (Not open source): Performance profiler for .NET apps. Returns a very detailed analysis.
- Prophiler: A PHP profiler & developer toolbar built for phalcon web framework. Good UI.
Other examples: stats.js, benchmark by Google
Rperform is a first-of-its-kind package for detailed performance analysis of R packages.
Various tools are available for profiling R code such as lineprof, Rprof, proftools, summaryRprof, etc. These tools have limitations which make them unsuitable for performing relatively large-scale code performance analysis, which is required by package developers.
Tools such as Rprof, R's sampling/statistical profiler, stops the execution of code at regular intervals (typically few milliseconds or seconds). It then records which function or line of code is currently being executed. In this manner, a memory/time profile is built. summaryRprof and proftools are examples of packages which help summarize the output from Rprof. profvis is an interesting tool currently in development for visualizing code profiling data as well.
But such profiling methods make profiling a time-consuming and strenuous task for package developers when faced with multiple files across directories. Moreover, there's no simple way to compare across different versions of a package's git repository. Rperform overcomes these limitations and provides additional functionalities such as visualization and integration with Travis-CI builds. It builds on top of the testthat framework allowing developers to use testthat unit tests for performance analysis in addition to correctness testing if they want.
Finally, Rperform's two critical advantage are:
- Ability to perform and visualize runtime and memory analysis of code across git versions and branches. This can help us answer questions like "which commit contains the bit of code that slowed down my R package?".
- Ability to include Rperform's analysis in the development workflow by integration with Travis-CI. This can help us answer questions such as "does this Pull Request change the speed or memory usage of my R package?" before performing a merge. More on this below.
There are several focus areas which will be worked upon on this project. They include:
- Improvement of the visualization functions: One of the most prominent and helpful feature of Rperform are the visualization functions it provides. Here's an example plot generated by Rperform after analyzing the runtime performance of a unit test from Hadley Wickham's stringr package.
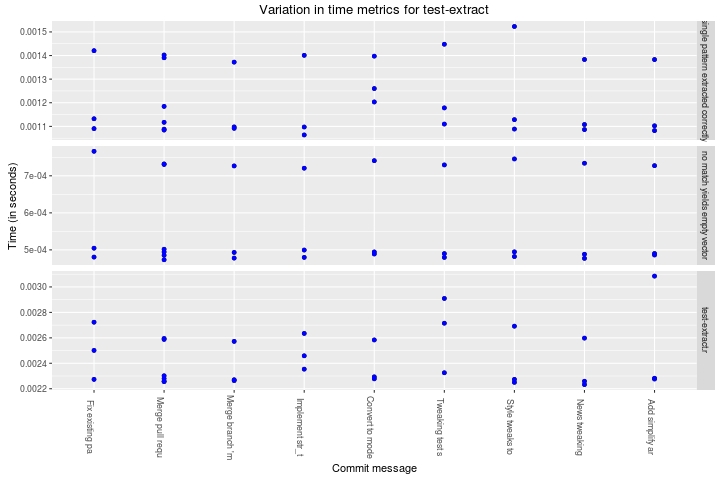
Details about the same can be found on the Rperform Wiki. The visualization functions need to be improved upon and more functions will be required to be added. Maybe the plots can be made interactive using packages such as animint. The direction this aspect of the project takes will heavily depend on how the UI implementation is done (see below).
-
Creating a coherent and useful user interface: Currently, Rperform does have a function which generates a webpage comprised of multiple plots obtained after analyzing the package code. However, there is a need for development of a proper user interface for the package developer to be able to interact meaningfully with the results. Inspiration for the same can be taken from projects such as asv and codespeed. TODO list specific features from these other tools that you would like to implement. Some potentially useful features are:
- Option to display plots for various files using a dropdown menu. Also, being able to display multiple plots at the same time for comparison purposes.
- Function to find a commit that produces a large regression (inspired from asv).
- Make the plots interactive. Hovering over a datapoint provides details about the commit such as date, author, etc.
-
Improvement and addition of multiple functionalities: Rperform currently provides metrics for two cases. First is by comparing multiple commits in a single branch. In the second case, metrics are provided across two specified branches which can then be compared. The latter case isn't fully developed and needs to be worked upon. Also, being able to compare specific commits separated by a decent amount of commits in between would be useful. This is explored in an issue here. Currently the performance analysis of commits can be done in a sequential manner.
Some of the most important questions that Rperform could answer are "does this Pull Request change the speed or memory usage of my R package?" and "which commit contains the bit of code that slowed down my R package?" So the package developer knows where to look to solve the regression. Assuming that a gh-page and Travis build has been setup for the repo, Rperform can help answer such questions. By including few scripts in the package's git repo, a webpage can be generated comprised of performance plots. Every time a travis build is triggered by pushing from the local repo, the webpage will be generated on the repo's gh-page. This can be done by using the scripts to run Rperform commands before the build on the Travis machine. And then pushing to the gh-pages branch. Details can be found here.
However, the same functionality hasn't been implemented successfully for PR builds as of now. Primary obstacle being the information (name) of the branch from which a PR originates being unavailable in the Travis environment. An issue is open on Travis' tracker addressing the same.
There are two possible ways to deal with this:
1.) Wait for the Travis developers to implement the required functionality. Getting it done on the Travis machine itself would be the ideal and most efficient way to deal with this.
2.) Look for a temporary way around. One way would be to modify the scripts to allow the developers to specify the branch name in one of them itself before making a PR. One issue that can arise with such a method is that of conflicts arising in large projects during merging due to multiple developers modifying the same script. Maybe specify a work-flow to do the same. Or look for another way altogether. -
Development of a test suite: Rperform currently lacks adequate number of unit tests. With increased functionality, working on this aspect will become even more important. TODO what tests currently exist? What tests would you like to write?
Currently, package developers that use GitHub and Travis can only judge Pull Requests in terms of Unit/Regression tests and code coverage. Rperform will make it easy to also judge Pull Requests in terms of performance metrics, e.g. does this PR make my code faster or slower?
- Toby Dylan Hocking initiated and mentored the project last year.
- Joshua Ulrich has agreed to co-mentor this year.
- Easy: something that any useR should be able to do, e.g. download some existing package listed in the Related Work, and run it on some example data.
- Medium: something a bit more complicated. You can encourage students to write a script or some functions that show their R coding abilities.
- Hard: Can the student write a package with Rd files, tests, and vigettes? If your package interfaces with non-R code, can the student write in that other language?
Students, please post a link to your test results here.