Brushjs는 HTML5의 canvas 엘리먼트를 통해 2D그래픽 작업을 수월하게 만들어 주는 라이브러리 입니다.
기본적으로 canvas엘리먼트의 좌표계는 실게 우리가 이해하는 좌표계와는 다른 형태입니다. 이는 복잡한 그래픽 작업을 하는데 있어서 직관적이지 않은 형태이기에 이를 우리기 이해가기 쉬운 형태로 Brushjs는 내부에서 맞춰주는 작업을 합니다.
기존 HTML5 Canvas 좌표계

Brushjs가 제공하는 좌표계

Brushjs도 canvas라는 하나의 엘리먼트를 구성하는 각각의 그래픽 요소들을 고유한 id값을 기반으로 관리 되고 있습니다. 이는 마치 DOM 객체를 다루는 방식과 유사하게 다양한 그래픽 효과나 애니메이션 효과를 만들 수 있습니다.
<!DOCTYPE html>
<html>
<head>
  <meta charset="utf-8">
  <title></title>
</head>
<body>
<canvas id="canvas" width="600" height="300"></canvas>

<script type="text/javascript" src="Brush.js"></script>
<script type="text/javascript">
var canvas = new Brush('canvas');

// Your code

</script>
</body>
</html>
#### - 기본 메서드
##### set(element_info) set 메서드의 인자로 전달된 정보는 new 를 통해 생성된 인스턴스에 레이어 정보로 추가가 됩니다. ```javascript var circle = { ... info } canvas.set(circle)
<br/>
##### draw()
set을 통해 저장된 레이어를 canvas상에 그리는 역활을 합니다. draw 메서드가 호출되기 전에는 set으로 저장한 레이어를 그리지는 않습니다.
```javascript

canvas.draw()
##### get(layer_id) get 메서드는 set을 통해 저장된 레이어의 고유 아이디를 기반으로 해당 레이어 정보를 전달받습니다. ```javascript
canvas.get(id)
<br/>
##### getLayers()
getLayers 메서드는 set을 통해 저장된 전체 레이어 정보를 전달받습니다.
```javascript

canvas.getLayers()
##### delete(layer_id) delete 메서드는 set을 통해 저장된 레이어 정보를 삭제합니다. ```javascript
canvas.delete(id)
<br/>
##### clear()
clear 메서드는 해당 canvas 영역을 모두 지웁니다.
```javascript

canvas.clear()
##### animate(elements_info) animate 메서드는 애니메이션 효과를 줄 레이어 정보를 설정합니다. ```javascript var moving = { // moving animation } canvas.animate(moving)
<br/>
##### deleteAnimation(layer_id)
deleteAnimation 메서드는 animate 메서드를 통해 등록된 에니메이션 정보를 제거합니다.
```javascript

canvas.deleteAnimation(id)
##### start() animate 메서드를 통해 등록된 에니메이션 정보로 애니메이션을 시작합니다. ```javascript
canvas.start()
<br/><br/>
#### - 이벤트 메서드
<br/>
##### click(callback)
클릭시 필요한 행동을 callback 함수로 전달합니다.
```javascript
var callbackFn = function(){
  //....
}

canvas.click(callbackFn)
##### mousemove(callback) canvas 상에서 마우스를 이동 시킬때 필요한 행동을 callback 함수로 전달합니다. ```javascript var callbackFn = function(){ //.... }
canvas.mousemove(callbackFn)
<br/><br/>
### 4.기본 그래픽 (Non-Animation)

<br/>
#### Line
-

```javascript
var line = {
  id : 고유한 ID 값(string),
  type: 'line',
  points : [
    [x0, y0], // 필수 [int, int]
    [x1, y1], // 필수 [int, int]
    ...
    [xn, yn]
  ],
  lineWidth : 라인 두께(string),
  strokeStyle : 라인 칼러(string),
  lineCap : 라인의 끝 마무리 형태,
  lineJoin : 라인간의 연결 형태, //miter , round, bevel
  isClose : 끝점과 시작점 연결 유무 (bool),
  isFill : isClose 가 true인 경우에 내부 색 채움 (bool),
  fillStyle : isFill 이 true인 경우 내부 색 (string),
  opacity : 투명도 (0 < opacity < 1)
};
#### 예제 ```javascript var line = { id : 'line1', type: 'line', from : [0, 100], points : [ [100, 200], [200, 180], [300, 300], [400, 200], [600, 0] ], lineWidth : 1, strokeStyle : 'gray', lineCap : 'round', lineJoin : 'round', isClose : false, isFill : false, fillStyle : 'green', opacity : 0.5 } canvas.set([ line ]).draw(); ```
#### MutiLine -
var MutiLine = {
  id : 고유한 ID 값(string),
   type: 'mutiLine',
  type: 'line',
  points : [
    [x0, y0], // 필수 [int, int]
    [x1, y1], // 필수 [int, int]
    ...
    [xn, yn]
  ],
  lineWidth : 라인 두께(string),
  strokeStyle : 라인 칼러(string),
  lineCap : 라인의 끝 마무리 형태,
  lineJoin : 라인간의 연결 형태, //miter , round, bevel
  isClose : 끝점과 시작점 연결 유무 (bool),
  isFill : isClose 가 true인 경우에 내부 색 채움 (bool),
  fillStyle : isFill 이 true인 경우 내부 색 (string),
  opacity : 투명도 (0 < opacity < 1)
};
#### 예제 ```javascript var multiLine = { id: 'multiLine', type: 'mutiLine', from: [0, 100], lines : [ { type : 'line', points: [ [10, 100] ] }, { type : 'quadraticCurve', points : [ [110, 118, 210, 100] ] }, { type : 'line', points: [ [230, 100] ] }, { type : 'quadraticCurve', points : [ [330, 118, 430, 100] ] }, { type : 'line', points: [ [430, 120], [0 ,120] ] },
], lineWidth : 3, strokeStyle : '#000', lineCap : 'round', lineJoin : 'round', isFill : false, fillStyle: 'red' } canvas.set([ multiLine ]).draw();
<br/>
#### Circle

-
```javascript
var circle = {
  id : 고유한 ID 값(string),
  type: 'circle',
  points : [
      [x1 , y1 , radius1],
      ...
      [x , y , radius]
  ]
  startAngle : 시작 각 (int),
  endAngle : 종료 각 (int),
  radius : 반지름(int),
  lineWidth : 라인 두께(string),
  strokeStyle : 라인 칼러(string),
  isFill : 내부 색 채움(bool),
  fillStyle : isFill이  true인 경우 내부 색(string),
  opacity : 투명도 (0 < opacity < 1)
}
#### 예제 ```javascript var circle = { id : 'ball1', type: 'circle', points : [ [100, 100 , 20] ], startAngle : 0, endAngle : Math.PI*2, radius : 20, lineWidth : 1, strokeStyle : 'red', isFill : true, fillStyle : 'red' } canvas.set([ circle ]).draw(); ```
#### Rectangle - ```javascript var rectangle ={ id : 고유한 ID 값(string), type: 'rectangle', points : [ [x1, y1, width1, height1], ... [x, y, width, height] ], lineWidth : 라인 두께(string), strokeStyle : 라인 칼러(string), isFill : 내부 색 채움(bool), fillStyle : isFill이 true인 경우 내부 색(string), opacity : 투명도 (0 < opacity < 1) } ```
#### 예제 ```javascript var rectangle = { id: 'rectangle', type: 'rectangle', points : [ [50, 50, 100, 100] ], isFill : true, fillStyle : 'red', lineWidth : 1, strokeStyle : 'gray', opacity : 1, fillStyle : 'red' } canvas.set([ rectangle ]).draw(); ```
#### Text -
var text = {
  id : 고유한 ID 값(string),
  type: 'text',
  points : [
  [x , y],
  ...
  ],
  text : 텍스트 (string),
  font : 폰트 속성 (string),
  textAlign : 텍스트 정렬,
  textBaseline : 텍스트 베이스 라인 형태,
  fillStyle : 폰트 색 (string),
  lineWidth : 폰트 라인 두깨(string),
  strokeStyle : 폰트 라인 색 (string),
  opacity : 투명도 (0 < opacity < 1)
}
#### 예제
var text ={
  id : 'text1',
  type: 'text',
  font : '38pt Arial',
  fillStyle : 'yellow',
  lineWidth : 1,
  //strokeStyle : 'blue',
  text : 'Hello World',
  textAlign : 'center',
  textBaseline : 'middle',
  points : [
    [200 , 50],
    [300 , 150]
  ]
}
canvas.set([
  text
]).draw();
#### Cubic Bézier curve(BezierCurve) -
var bezierCurve = {
  id : 고유한 ID 값(string),
  type: 'bezierCurve',
  from : [x, y], // 시작점 (int)
  points : [
    [controlePointX1, controlePointY1, controlePointX2, controlePointY2, endPointX1, endPointY2]
    ...
  ],
  lineWidth : 폰트 라인 두깨(string),
  strokeStyle : 폰트 라인 색 (string),
  isClose : 끝점과 시작점 연결 유무 (bool),
  isFill : isClose 가 true인 경우에 내부 색 채움 (bool),
  fillStyle : isFill 이 true인 경우 내부 색 (string),
  opacity : 투명도 (0 < opacity < 1)
}
#### 예제 
var bezierCurve ={
  id : 'bazier1',
  type: 'bezierCurve',
  from : [20, 20],
  points : [
    [20,100,200,100,200,20]
  ],
  lineWidth : 3,
  strokeStyle : 'green',
  isClose : false,
  isFill : false,
  fillStyle : 'red'
}
canvas.set([
  bezierCurve
]).draw();
#### Quadratic Bézier curve(QuadraticCurve) -
var quadraticCurve ={
  id : 'quadratic',
  type: 'quadraticCurve',
  from : [x, y], // 시작점 (int)
  points : [
    [controlePointX1, controlePointY1, endPointX1, endPointY1]
  ],
  lineWidth : 폰트 라인 두깨(string),
  strokeStyle : 폰트 라인 색 (string),
  lineCap : 라인의 끝 마무리 형태,
  isFill : isClose 가 true인 경우에 내부 색 채움 (bool),
  opacity : 투명도 (0 < opacity < 1)
}
####예제
var quadraticCurve ={
  id : 'quadratic',
  type: 'quadraticCurve',
  from : [20, 20],
  points : [
    [20, 100, 200, 20]
  ],
  lineWidth : 10,
  strokeStyle : 'blue',
  lineCap : 'square',
  isClose : false
}
canvas.set([
  quadraticCurve
]).draw();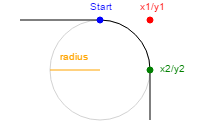
var arcTo = {
  id : 고유한 ID 값(string),
  type: 'arcTo',
  from : [x, y], // 시작점 (int)
  points : [
    [x1, y1 ,x2, y2, radius]
  ],
  lineWidth : 라인 두께(string),
  strokeStyle : 라인 칼러(string),
  lineCap : 라인의 끝 마무리 형태,
  lineJoin : 라인간의 연결 형태, //miter , round, bevel
  isClose : 끝점과 시작점 연결 유무 (bool),
  isFill : isClose 가 true인 경우에 내부 색 채움 (bool),
  fillStyle : isFill 이 true인 경우 내부 색 (string),
  opacity : 투명도 (0 < opacity < 1)
}var arcTo = {
id : 'arc2',
type: 'arcTo',
from : [300, 200],
points : [
[350, 200 ,350, 250, 50]
],
lineWidth : 2,
strokeStyle : 'black',
lineCap : 'round',
lineJoin : 'round', //miter , round, bevel
isClose : false,
isFill : false
}
canvas.set([
arcTo
]).draw();canvas.animate([
{
id: '고유한 ID 값(string),
type: 'stroking', // moving
speed: 1, // how fast
time: 1 // how many
}
]);#### Stroking -
var stroke =
    {
      id : 'stroke1',
      type: 'stroke',
      points : [
        [0, 100],
        [100, 200],
        [200, 180],
        [300, 300],
        [400, 200],
        [600, 0]
      ],
      lineWidth : 1,
      strokeStyle : '#000',
      lineCap : 'round',
      lineJoin : 'round'
    }
canvas.set([
  stroke
]).draw().animate([
  {
    id: 'stroke1',
    type: 'stroking',
    speed: 1,
    time: 1
  }
]).start();
#### Moving -
var multiLine = {
  id: 'multiLine',
  type: 'mutiLine',
  from:  [0, 100],
  lines : [
    {
      type : 'line',
      points: [
        [10, 100]
        ]
    },
    {
      type : 'quadraticCurve',
      points : [
        [110, 118, 210, 100]
      ]
    },
    {
      type : 'line',
      points: [
        [230, 100]
        ]
    }
  ],
  lineWidth : 3,
  strokeStyle : '#000',
  lineCap : 'round',
  lineJoin : 'round',
  isFill : false,
  fillStyle: 'red'
}
canvas.set([
  multiLine
]).draw();

var circle = {
  id : 'ball1',
  type: 'circle',
  points : [
      [100, 100 , 20]
  ],
  startAngle : 0,
  endAngle : Math.PI*2,
  radius : 20,
  lineWidth : 1,
  strokeStyle : 'red',
  isFill : true,
  fillStyle : 'red'
}
canvas.set([
  circle,
  multiLine

]).draw().animate([
  {
    id: 'ball1',
    type: 'moving',
    moveTo : [200, 200],
    speed: 1,
    time: 2
  },
 {
    id: 'multiLine',
    type: 'moving',
    moveTo : [200, 200],
    speed: 1,
    time: 2
  }
]).start();#### Click ```javascript var circle = { id : 'ball1', type: 'circle', points : [ [100, 100 , 20] ], startAngle : 0, endAngle : Math.PI*2, radius : 20, lineWidth : 1, strokeStyle : 'red', isFill : true, fillStyle : 'red' }
var clickEvent = function(self , position){ canvas.get('ball1').points.forEach(function(elem){ elem[0] = position.x; elem[1] = position.y; self.draw() }) } canvas.set([ circle ]).draw().click(clickEvent);
<br/>
#### Mousemove

```javascript
var circle = {
  id : 'ball1',
  type: 'circle',
  points : [
      [100, 100 , 20]
  ],
  startAngle : 0,
  endAngle : Math.PI*2,
  radius : 20,
  lineWidth : 1,
  strokeStyle : 'red',
  isFill : true,
  fillStyle : 'red'
}


var clickEvent = function(self , position){
  canvas.get('ball1').points.forEach(function(elem){
    elem[0] = position.x;
    elem[1] = position.y;
    self.draw()
  })
}
canvas.set([
  circle
]).draw().mousemove(clickEvent);
Rectangle(updated 2016.07.13)Gradient(effect)(updated 2016.07.15)Shadow(effect)(updated 2016.07.15)globalCompositeOperation(updated 2016.07.19)- Scale(animation)
- Rotate(animation)
moving to specific points (animation)(updated 2016.09.01)- Image
- Performance
- Document in English
- Brushjs Gallery (updating)