Add and search for nodes in a binary tree with an easy-to-use, web-based visualization

Inspired by Coding Train's Binary Tree Visualization Challenge
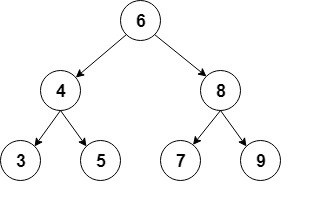
A binary tree is a data type where every node in the graph can have at most two children. The node to the left of any parent node must contain a value less than the value of the parent node, and the node to the right must contain a value greater than the value of the parent node.
For more information, see this explanation from Carnegie Mellon University
When the visualization is first opened, the screen will be empty

To add a node to the tree, click the Add button, and enter an integer for the new node to hold. Watch as the animation adds the node to the tree. In this case, green represents the node that was just added. To pan on the visualization, click and drag. To zoom in and out on the visualization, scroll up or down.

Click the Add button a few more times to add more nodes to the tree, and watch as their insertion is animated. To make the animation progress faster, move the Animation Speed slider farther to the right. Blue represents nodes that must be visited to insert the node into the correct location

To watch the binary tree search for a value in itself, slick the Search button, and enter an integer that you previously inserted into the tree. Blue represents nodes that must be visited to find the value, red represents sections of the tree where the value will not be found, and green represents the node that was being searched for. Note that if no node is green, the value was not found.

To clear the entire tree, click the Clear button. This will make your screen appear as it did when the visualization was first opened
Rather than manually adding nodes, you can fill the entire tree with a certain number of nodes. To do this, click the Fill button, enter the desired number of nodes in the prompt, and watch as nodes are added one at a time. Note: this clears the current tree
If you do not want to wait for the insertion animation, click the Quick Fill button, which functions the same as the Fill button, but does not animate the insertion process. Note: this also clears the current tree

- Node.js - Defines the Node class, the building block of the binary tree. Nodes store their value, references to both of their child nodes, and information to to draw them on-screen (e.g. x and y-coordinates, colors, etc.)
- Tree.js - Defines the Tree class, which serves as both a wrapper for the root node of the binary tree (e.g. providing functions for searching the tree for values), and the primary class responsible for animating the binary tree
- Controls.js - Defines the Controls class, which connects the buttons (e.g. Clear, Quick Fill, etc.) to the animation functions of the Tree class
- Explorer.js - Defines the Explorer class, which adjusts the size and position of the tree to allow for panning and zooming over the entire tree
- sketch.js - Instantiates all the necessary objects to run the visualization
See each file for more detailed documentation, and in-depth explanations of how each class functions
- p5.js - A library for creating visualizations using the canvas
- Make the tree self-balancing using AVL tree rotation
- Add an animation for removing a node from the tree
- Improve the performance of the Explorer class for larger trees with svg