Home
Welcome to the napari-hippo wiki! This is currently under active construction, but will hopefully contain useful documentation and tutorials on how to use our napari-hippo plugin.
This wiki is organised as follows:
-
Installation and first steps - how to install
napari-hippo, load a test dataset and use some basic functions. -
Overview - outlines what each submodule in
napari-hippodoes. - Tutorial 1 - ingesting data as cubes, stacks and slices.
-
Tutorial 2 - viewing point spectra and
caterpillarplots. -
Tutorial 3 - hyperspectral analyses with
hylitetools. - Tutorial 4 - masking data and adding geometric annotations.
- Tutorial 5 - coregistration transforms and affines.
napari-hippo, like napari, can be installed via pip.
To install napari-hippo, please first install napari as described here.
Once napari is installed and running, you can install napari-hippo directly from pip:
pip install napari-hippo
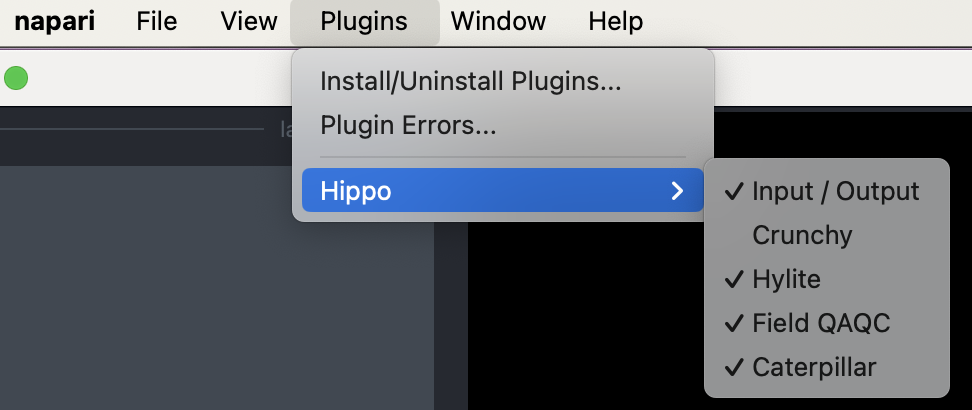
Alternatively, the plugin can be installed directly through the napari gui using Plugins->Install/Uninstall Plugins and searching for napari-hippo.
Note that the napari-hippo plugin depends on the hylite package. This is listed as a dependency so should be installed automatically (but could potentially cause issues on some systems).
Once installed, the Hippo menu should appear in the Plugins dropdown. The Hippo HSI dataset should also appear in the sample datasets list.
The GUI toolboxes that form napari-hippo are accessible through the Plugins menu. Open some of these (one at a time) to check everything is working.
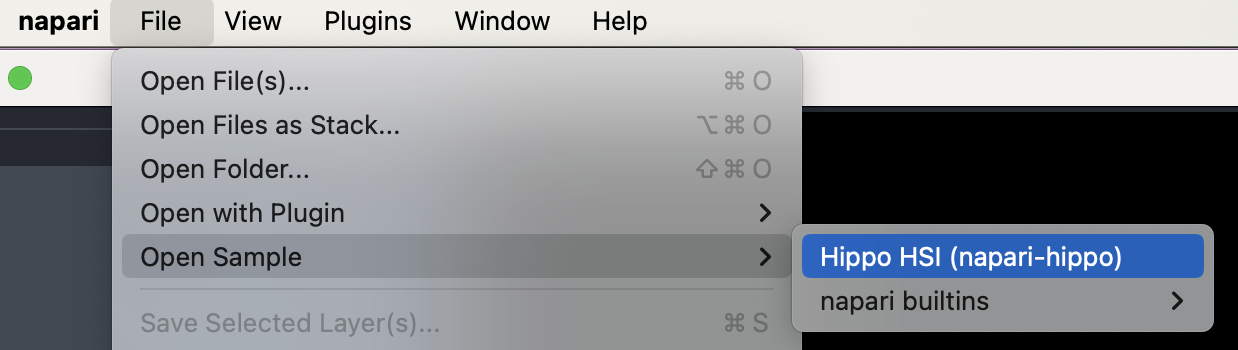
A small hyperspectral test dataset can also be loaded using File->Open Sample->Hippo HSI. This is a VNIR-SWIR hyperspectral scan of a small (~1x3 cm) geological thick section, and contains a variety of spectrally active minerals (clays, chlorite, etc.).
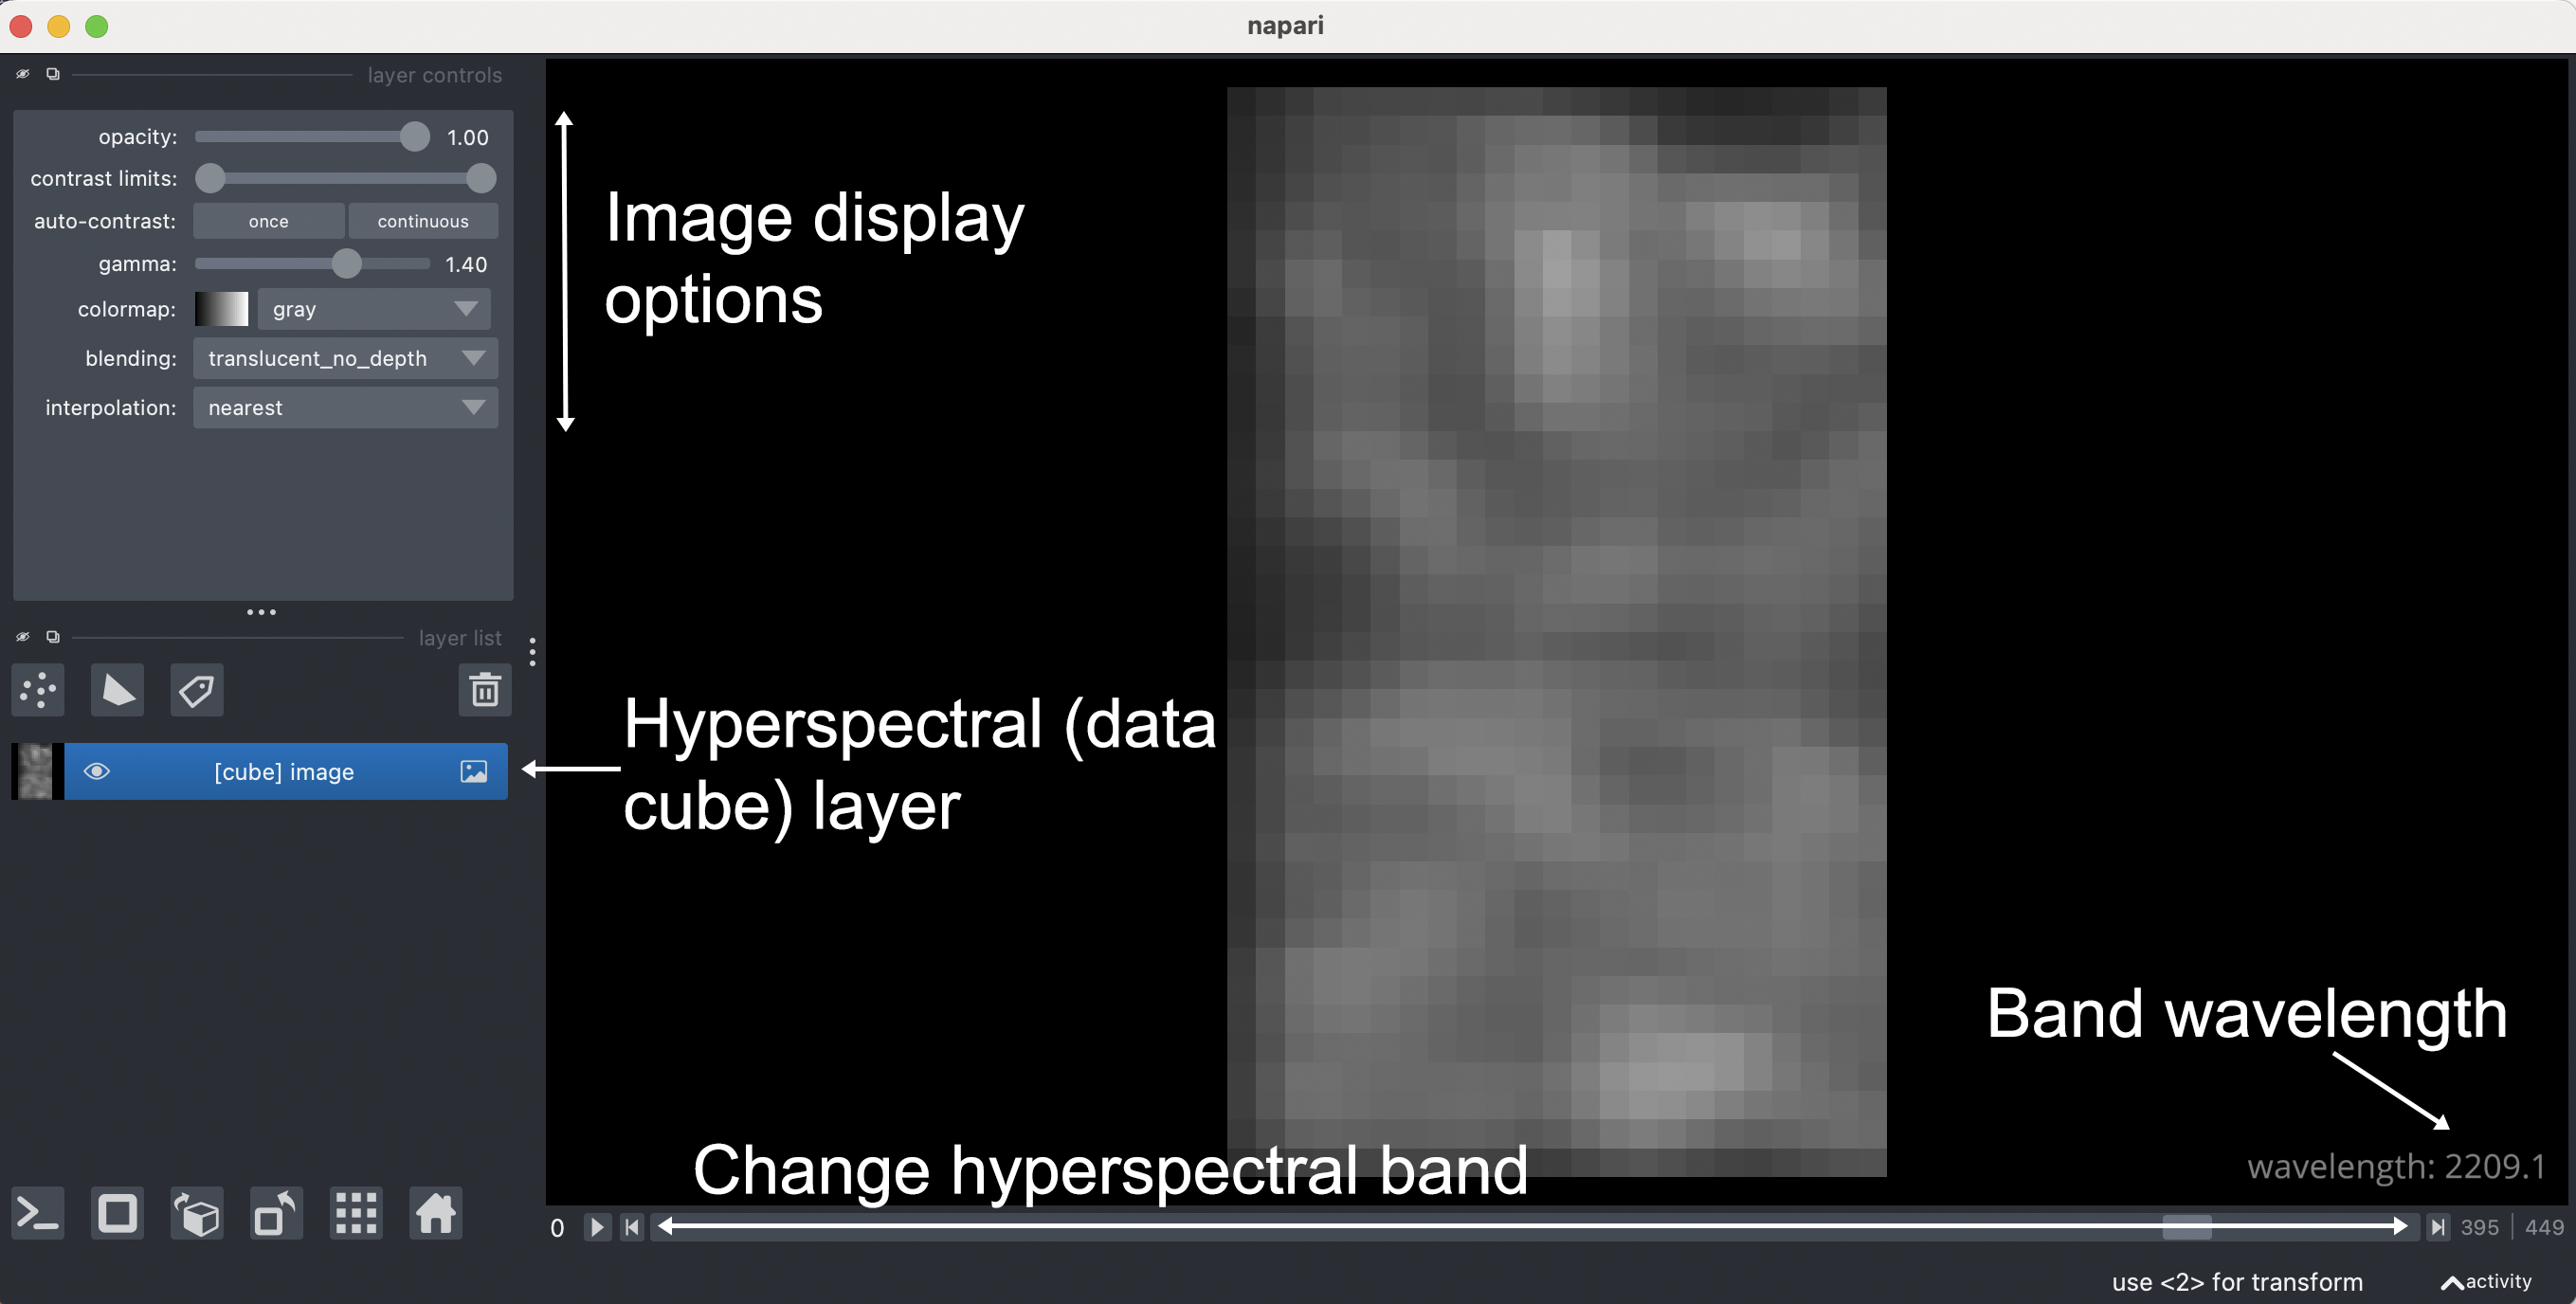
After opening this, a hyperspectral data cube should appear in the layers list. As with other 3-D image data, you can use the slider at the bottom of the napari window to view different hyperspectral bands (note the band wavelength written in the lower-right of the screen), and use the layer controls panel to adjust the (single-band) visualisation.
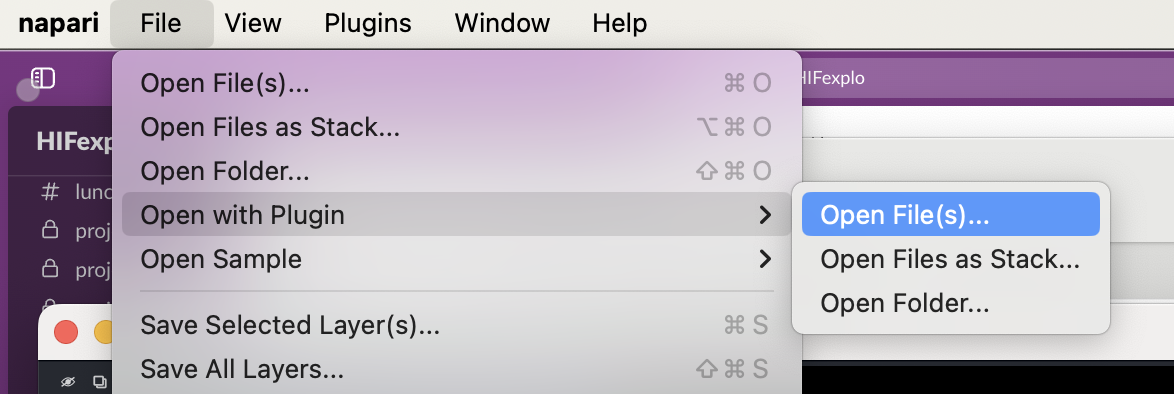
napari-hippo registers an IO plugin for ENVI format hyperspectral data cubes (typically a header file with .hdr extension and a data file with .dat extension, although this can vary). Hence you can load your own data cubes by (1) dragging the .dat file onto the image viewer window, or (2) using the File->Open with Plugin menu.
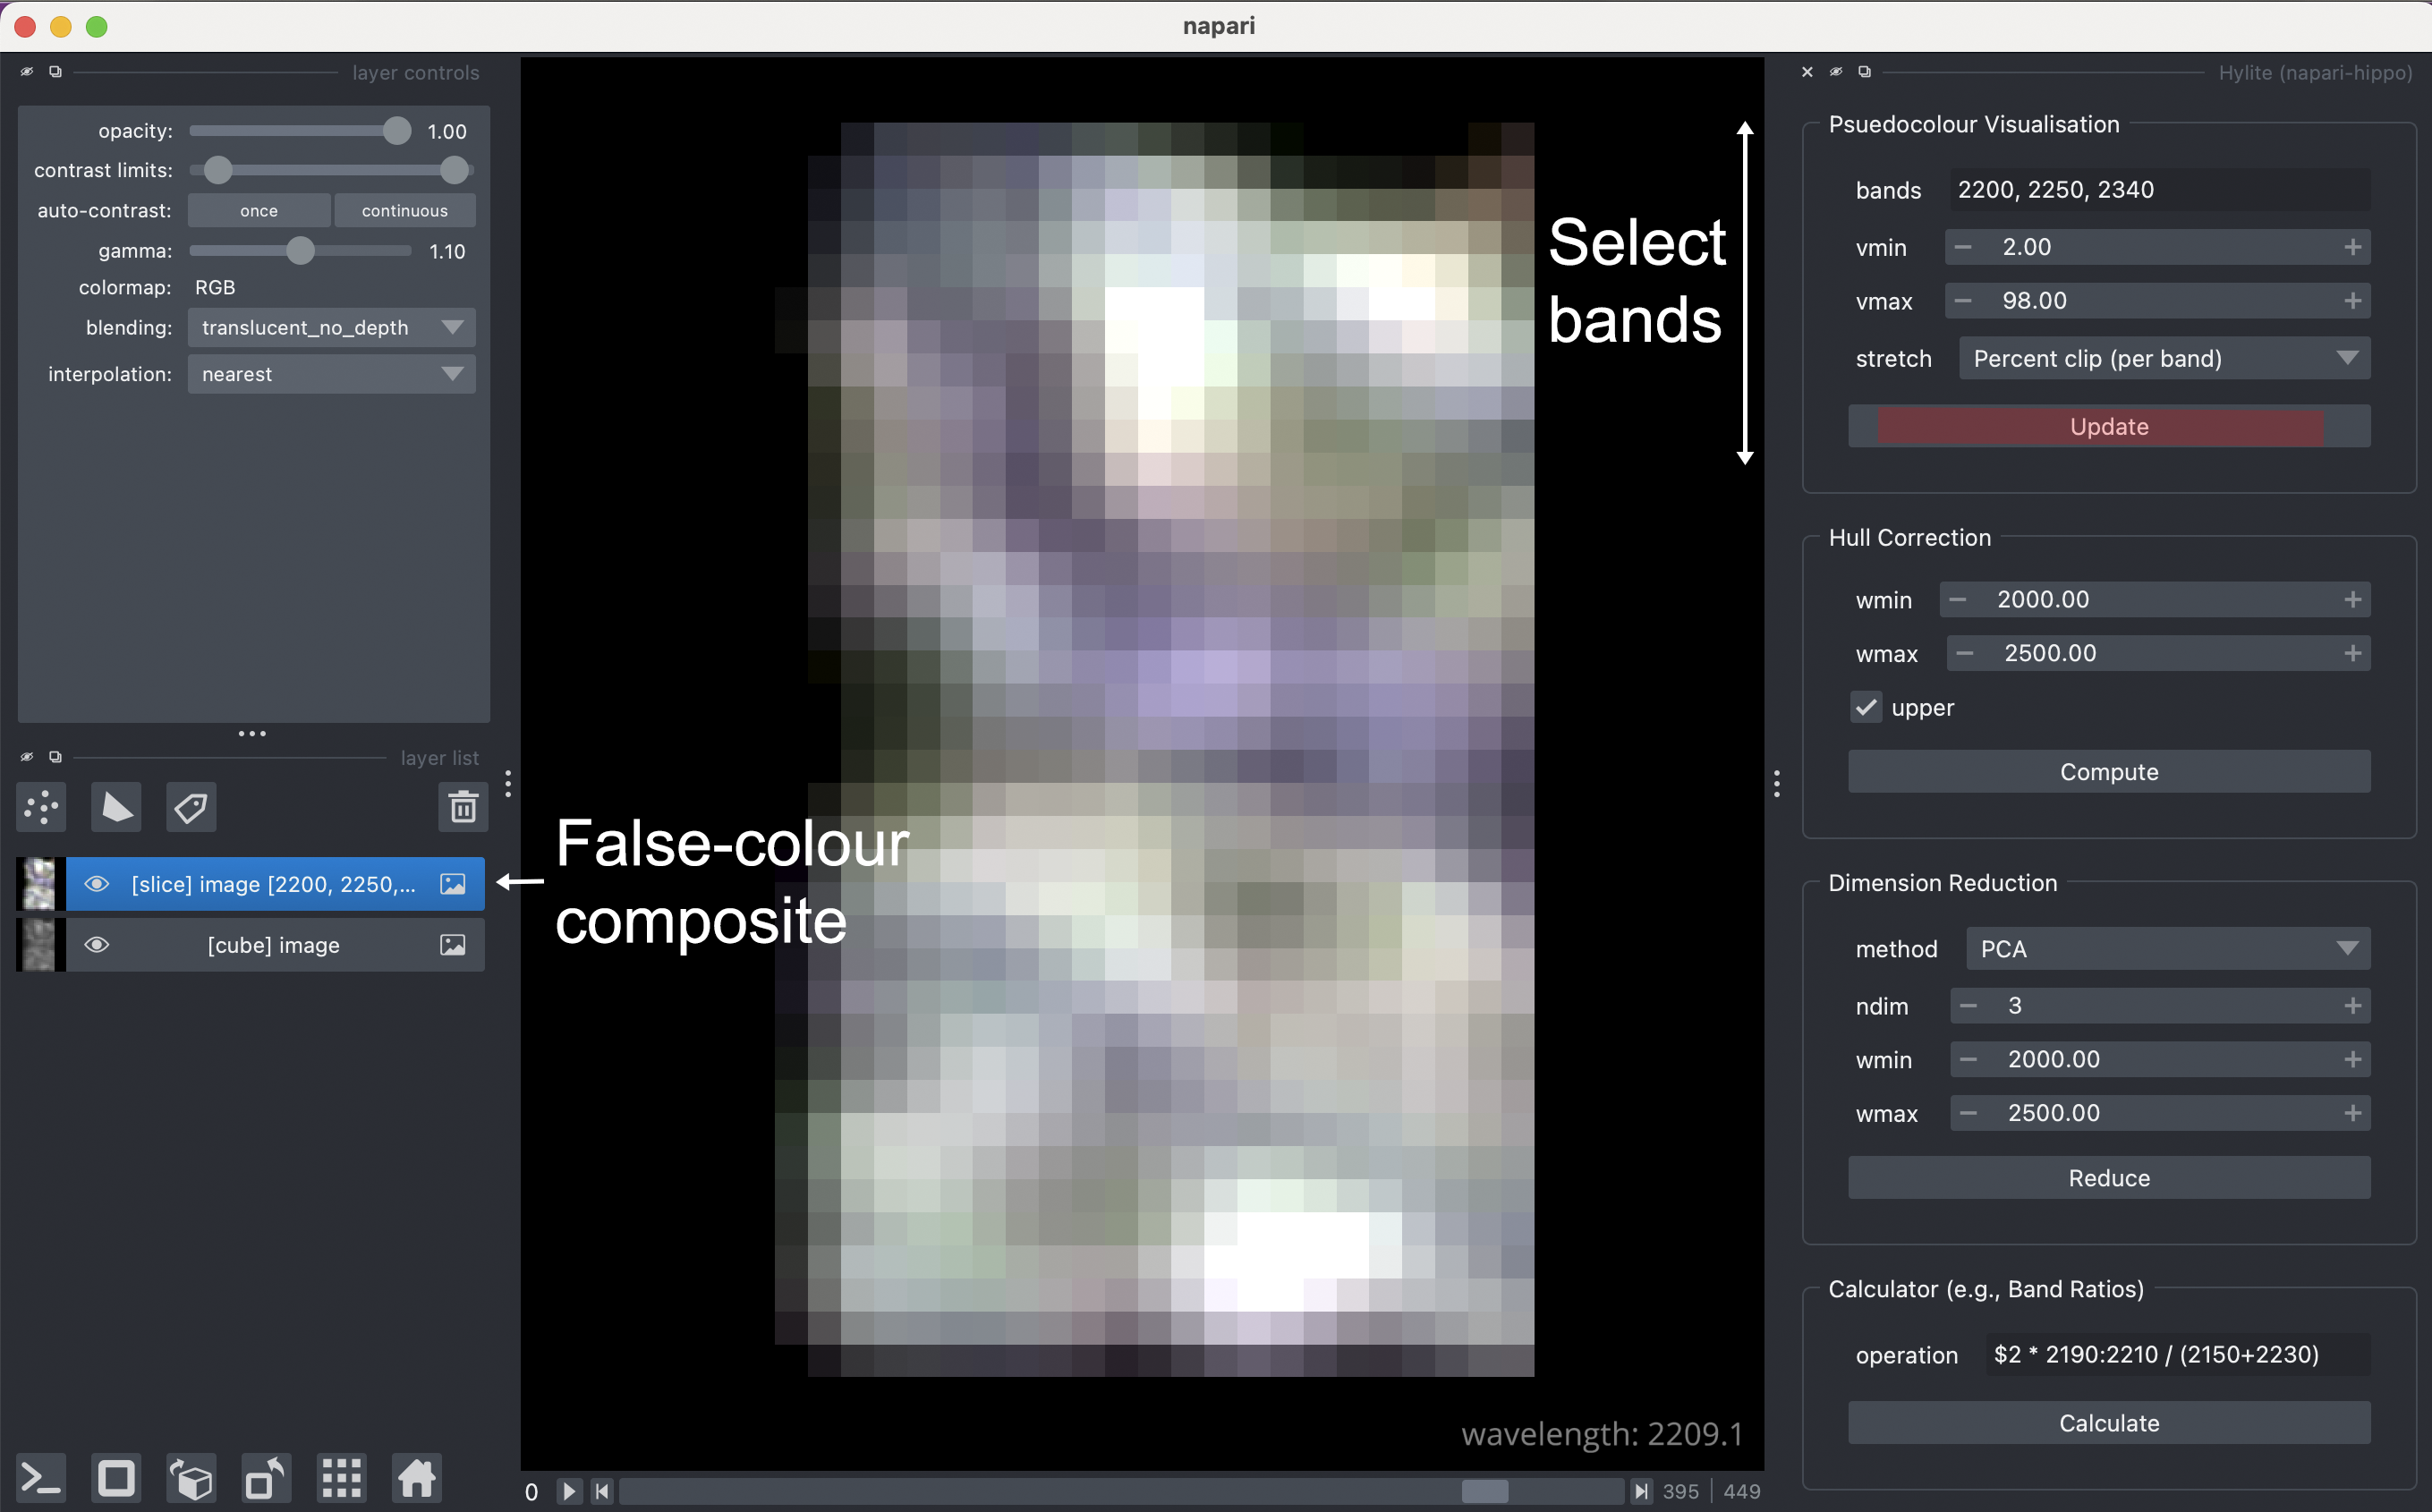
The Hippo->Hylite toolbox can then be used to quickly make a false-colour RGB visualisation of a hyperspectral data cube.
As a final quick step to check napari-hippo is installed correctly, open the hylite toolbox using Plugins->Hippo->Hylite. We can then use the Psuedocolour Visualisation tool to create a Slice of the data cube we've loaded containing only 3-bands, which is viewed as an RGB false-colour composite. Select your bands and click Update to add the slice object to the layer list.