Most applications now require storage and run at scale. In the past we could use tools like blktrace, blkparse and iowatcher to observe how application IO maps to the block devices which provide the storage. This works great on a single node but does not work when the application spans tens or hundreds of servers and disks.
iowatcher-ng connects the blktrace and blkparse approach of a single server to a Prometheus exporter mechanism. We can then use a prometheus server to scrape the target(s) and use Grafana to display interesting metrics in dashboards.
- Use blktrace to gather IO information on the target block device.
- Use blkparse to convert the binary output into human readable form and perform some basic filtering and formatting.
- Write iowatcher-ng-exporter in Python to take the output of blkparse and generate the exported statistics.
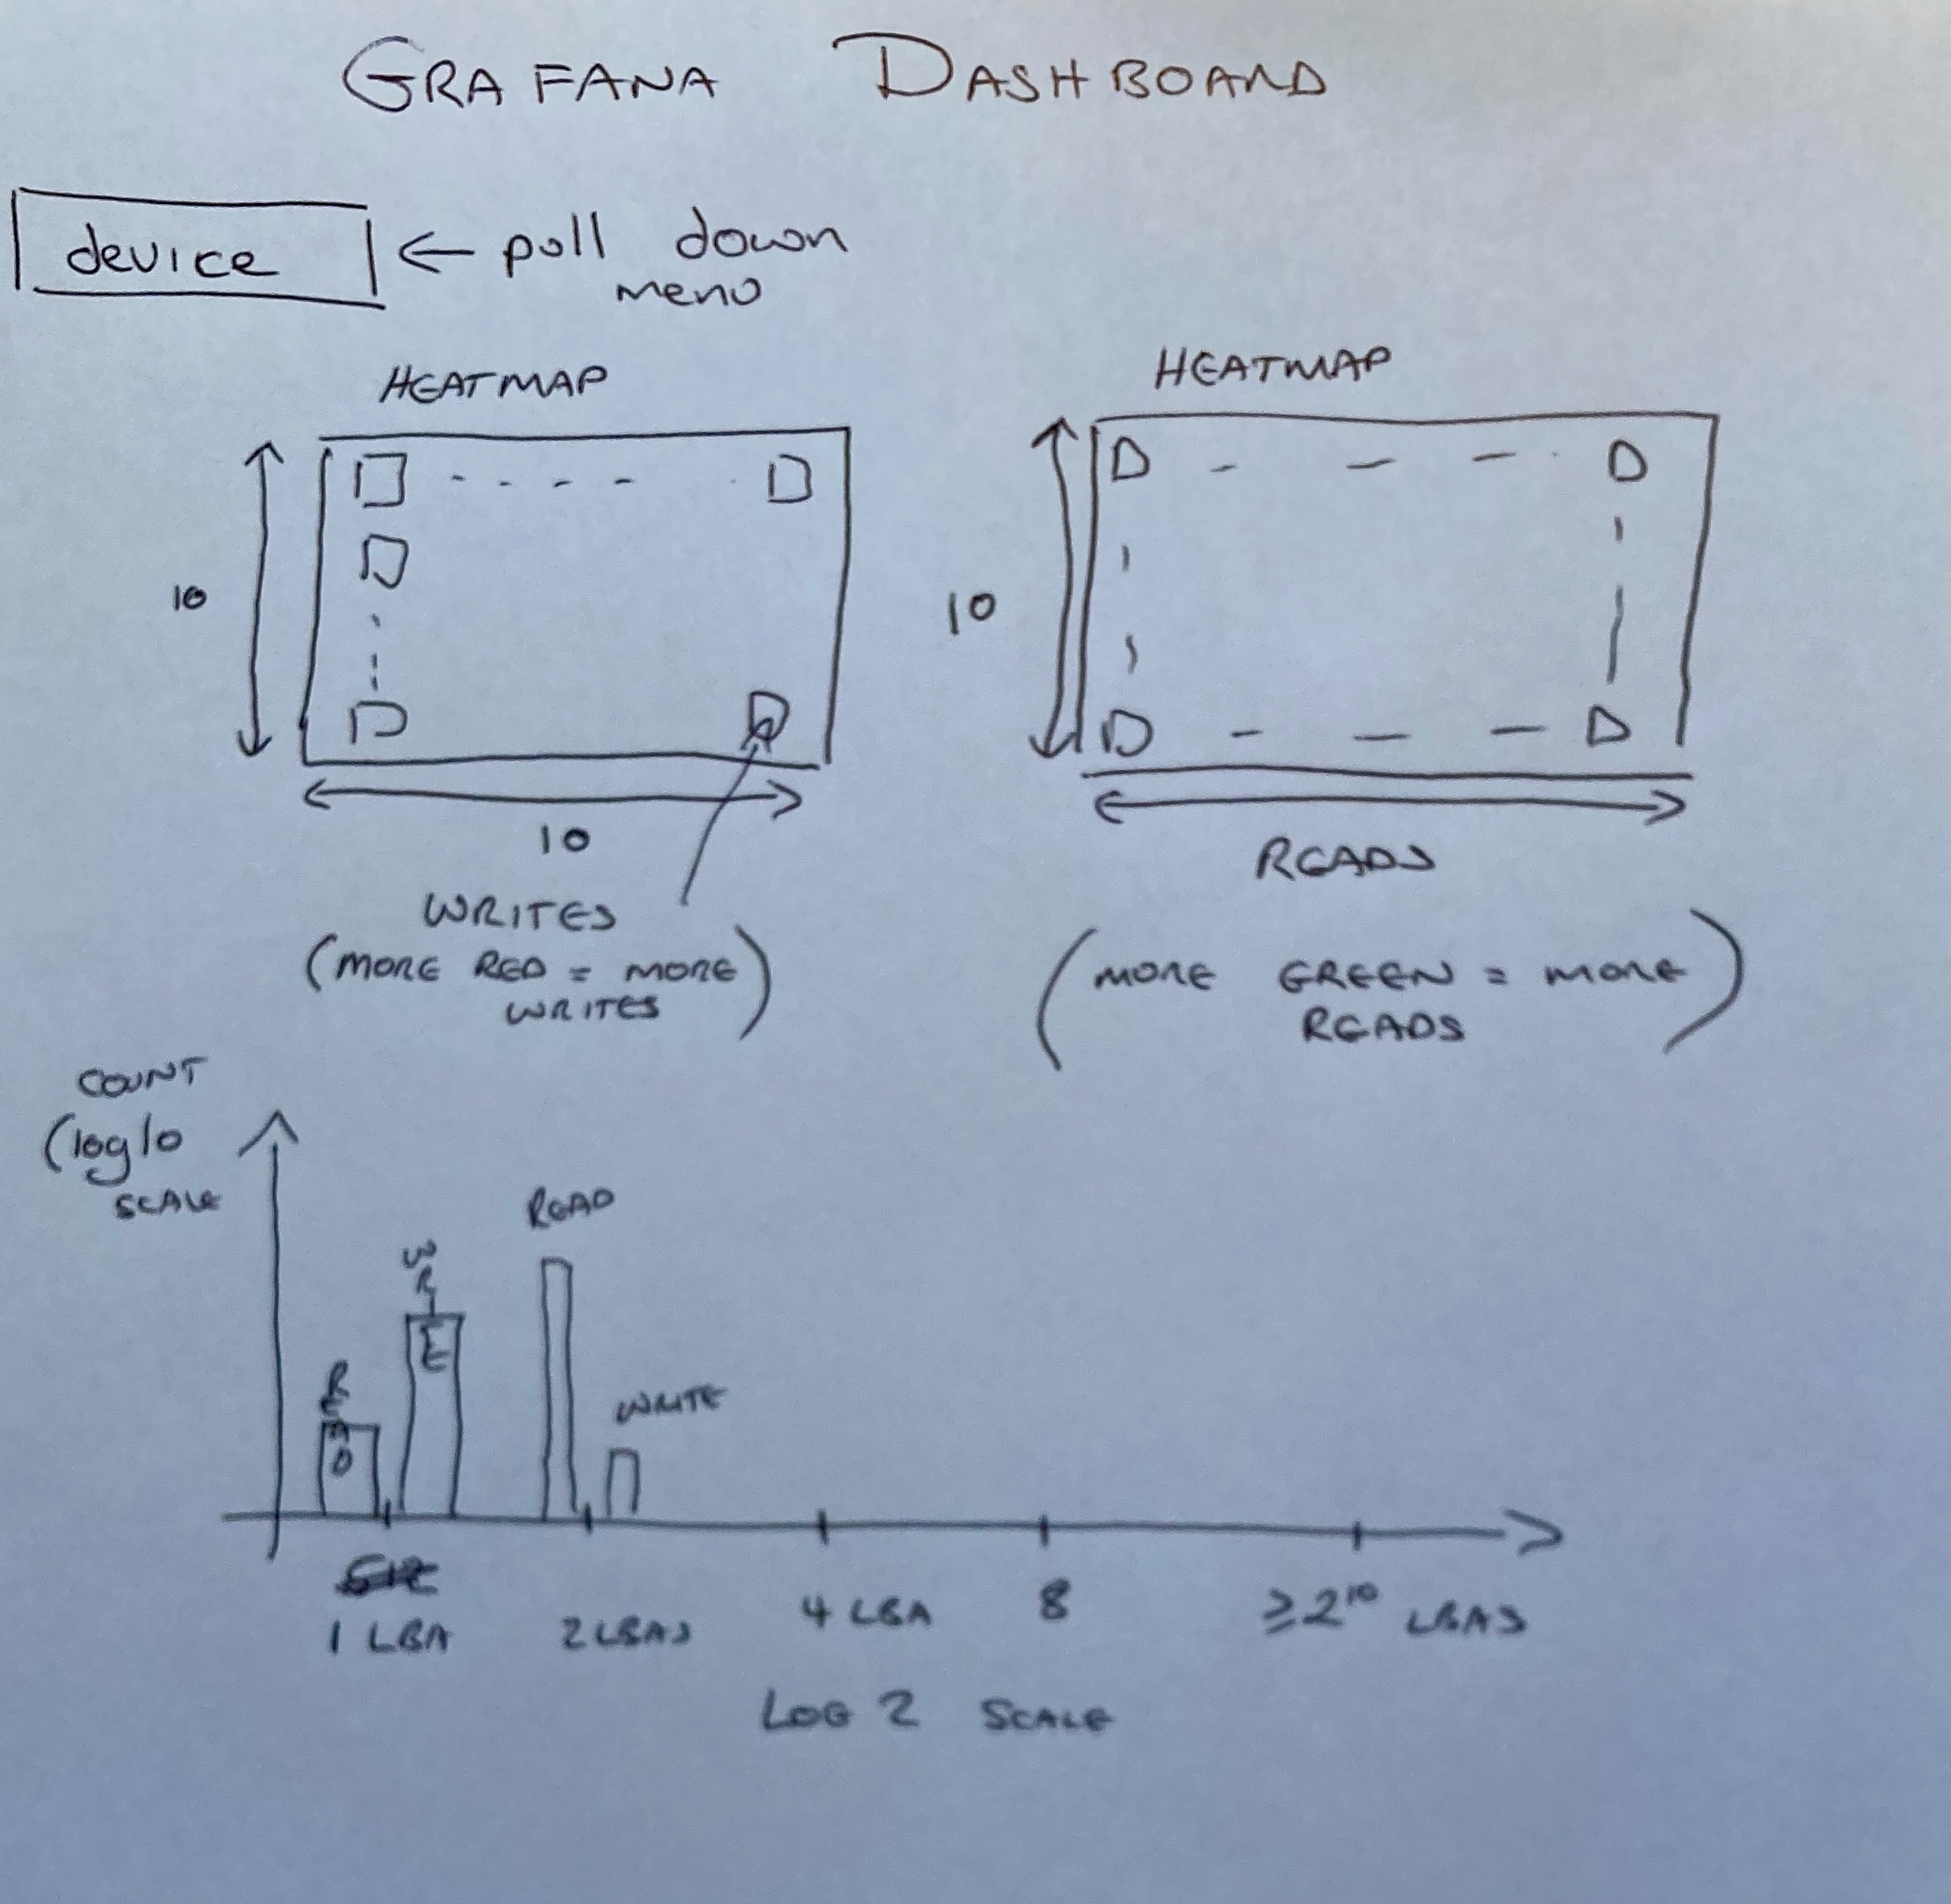
- Write a Grafana dashboard (in JSON) to display the metrics from iowatcher-ng-exporter in a nice form.
- A heatmap (one for reads and one for writes) that shows 100 bins across the block device and indicates which 100th have been accessed the most.
- A bargraph for a historgram of IO sizes as seen by blktrace. We would want seperate graphs for reads and writes.
- How do we export the interesting block IO metrics? I think we need to decide on which metrics to export and then work from there. Since we want to generate a heat-map I think we need the following.
- Divide the target disk(s) into 100 bins and do a running count of the number of write and read IO to each of those bins.
- Use the Prometheus [historgram library code][hist-ref] for this.
- Write the Promotheus exporter in Python or Go (because it has good support) and have it process data streaming in from blkparse. 1.. How do we determine which block devices to gather this data on?
- I think for the first version we just target a single NVMe SSD on the target(s). Then we can see how well that scales as we add more devices.