

A dot panel for Grafana.
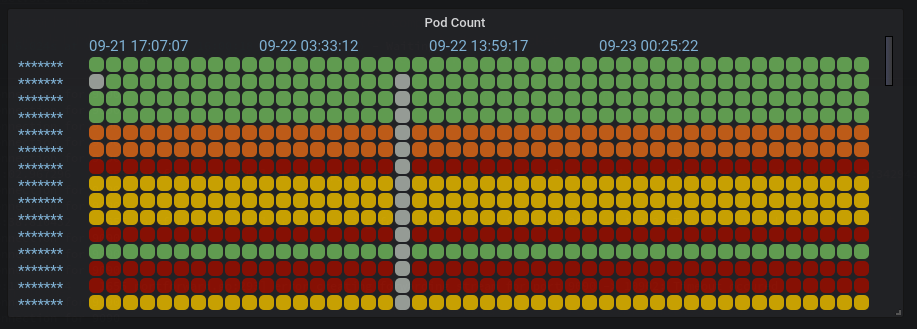
This panel show one row for every time series. Every dot represents a time window of this time series. This is especially useful if you want to monitor how the values of your time series evolve. There are several compaction algorithms available to calculate how the value for this time window should be populated.
The Options tab allows you to customize several aspects of the dot panel.
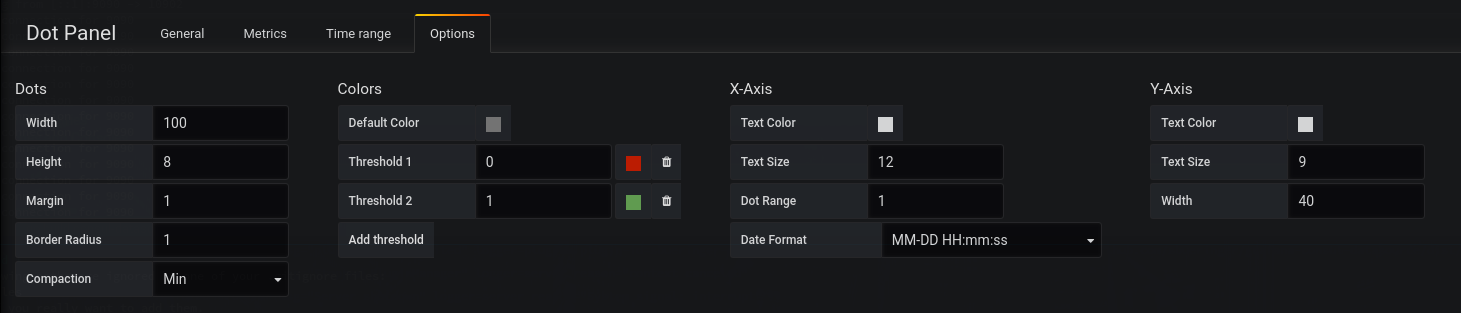
The following options are available:
- Dots:
- Width: Width of the dots
- Height: Height of the dots
- Margin: Margin between the dots
- Border Radius: Border Radius of the dots
- Compaction: Algorithm by which the value of a time window is chosen: Last, First, Min, Max or Average
- Color:
- Configures the thresholds for the dot colors
- X-Axis:
- Text color and size
- Dot Range: Every which dots a column header should be placed
- Date Format: Date format of the column header
- Y-Axis:
- Text color and size
- Width: Width of the row header and offset after which the dots are placed
- This plugin is based on: