Skip to content
New issue

Have a question about this project? Sign up for a free GitHub account to open an issue and contact its maintainers and the community.

By clicking “Sign up for GitHub”, you agree to our terms of service and privacy statement. We’ll occasionally send you account related emails.

Already on GitHub? Sign in to your account

Phase cross correlation : uncorrect shift in some conditions #5460

Closed
patquem opened this issue Jul 7, 2021 · 8 comments · Fixed by #5461
Closed

Phase cross correlation : uncorrect shift in some conditions #5460

patquem opened this issue Jul 7, 2021 · 8 comments · Fixed by #5461

Comments

@patquem
Copy link
Contributor

patquem commented Jul 7, 2021

Hello,

Here is a simple case that illustrates problems that I meet in a more complicated one.
In some "conditions" (?), the calculated shift is not correct.
In the pseudo 1D example below, I play with 2 parameters:
length : which is the length of my trench of my 'profile'
shift : which is the shift applied between the 2 'profiles'

with length=20, the calculated shifts are correct in the both cases
with length=10, the calculated shift is not correct in the case of shift=20.

length = 10 / shift = 15 : OK
image

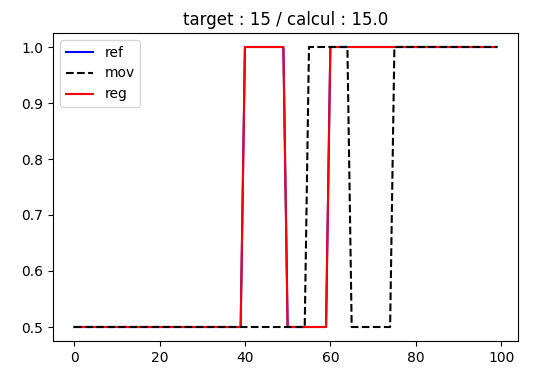
length = 10 / shift = 20 : NOK
image

What the reason of this ?
Thanks

Patrick

import numpy as np
import matplotlib.pyplot as plt

from skimage.registration import phase_cross_correlation as cross_correl
from skimage.transform import EuclideanTransform, warp


def test(length, shift):
    img = np.ones((2, 100, 10))
    img[0, 0:40, :] = 0.5
    img[0, 50:50 + length, :] = 0.5
    img[1, 0:40 + shift, :] = 0.5
    img[1, 50 + shift:50 + length + shift, :] = 0.5

    shift_calc = cross_correl(img[0], img[1],
                              upsample_factor=1,
                              overlap_ratio=0.3)[0]

    tform = EuclideanTransform(translation=[-shift_calc[1], -shift_calc[0]])
    img_reg = warp(img[1], tform, mode='edge')

    plt.figure(figsize=(8, 6))
    plt.title(f"target : {shift} / calcul : {-shift_calc[0]}")
    plt.plot(img[0, :, 0], 'b-', label='ref')
    plt.plot(img[1, :, 0], 'k--', label='mov', zorder=10)
    plt.plot(img_reg[:, 0], 'r-', label='reg')
    plt.legend()

# TESTS OK
test(length=20, shift=15)
test(length=20, shift=20)
plt.show()

# TESTS NOT OK
test(length=10, shift=15)
test(length=10, shift=20)    # UNCORRECT CALCULATED SHIFT
plt.show()
@grlee77
Copy link
Contributor

grlee77 commented Jul 7, 2021

The recently opened #5459 indicated that there is a bug in the function. I have not yet tested this example to see if making the change suggested there helps here

@grlee77
Copy link
Contributor

grlee77 commented Jul 7, 2021

Indeed, it seems making the fix suggested in #5459 results in the expected result for both cases here

@patquem
Copy link
Contributor Author

patquem commented Jul 8, 2021

Hi,
thanks a lot @grlee77 and @JulesScholler for your bugfix.

Indeed, now the test case above returns good results (the same for my more complicated one :) )
Unfortunatly, the fix (lines (221-22) in _phase_cross_correlation) engenders bad results in another case.

BEFORE introducing the bugfix :

image

AFTER introducing the bugfix :

image

Note that when commenting the gausssian filter operation, the shift recovers a correct value.
Maybe the eps value in the fix is too strict or not enough when working with data in range [0, 1] ??

import numpy as np
import matplotlib as mpl
import matplotlib.pyplot as plt
from scipy import ndimage as ndi
from scipy.ndimage import gaussian_filter

from skimage.registration import phase_cross_correlation
from skimage.transform import EuclideanTransform, warp
from skimage.data import binary_blobs

ref = binary_blobs(300,
                   blob_size_fraction=0.05,
                   volume_fraction=0.7,
                   seed=0)
ref = gaussian_filter(ref.astype(float), 3)

shift = [5, 3]
mov = ndi.shift(ref, shift, order=1)

shift_calc = phase_cross_correlation(ref, mov,
                                     upsample_factor=1,
                                     overlap_ratio=0.3)[0]

tform = EuclideanTransform(translation=[-shift_calc[1], -shift_calc[0]])
reg = warp(mov, tform)

plt.figure()
plt.title(f"target : -{str(shift)} / calcul : {str(shift_calc)}")
mpl.rcParams['lines.linewidth'] = 0.5
ct1 = plt.contour(np.flipud(ref), levels=[0.5], colors='b')
ct2 = plt.contour(np.flipud(mov), levels=[0.5], colors='k', linestyles='dotted')
ct3 = plt.contour(np.flipud(reg), levels=[0.5], colors='r')
plt.legend((ct1.collections[0], ct2.collections[0], ct3.collections[0]),
           ('ref.', 'mov.', 'reg.'), loc=4)
plt.axis("equal")
plt.show()

@grlee77
Copy link
Contributor

grlee77 commented Jul 8, 2021

I could not reproduce the failure in your example when using the branch corresponding to #5461. Can you maybe try the following variant, and see if it helps?

(It adds a multiple of eps only to extremely small values, but doesn't modify the rest)

    image_product = src_freq * target_freq.conj()
    eps = np.finfo(image_product.real.dtype).eps
    image_product /= np.maximum(np.abs(image_product), 100 * eps)

@patquem
Copy link
Contributor Author

patquem commented Jul 8, 2021

hmmm .. embarrassing.
previously, I just modified the 2 lines in my _phase_cross_correlation, with the result you know.
For the present test, I copy/paste the whole _phase_cross_correlation.py from your branch :
https://github.com/scikit-image/scikit-image/blob/e79fa4b694e5ceb52cfff28f13e57c519272e6ea/skimage/registration/_phase_cross_correlation.py
I have always the same behaviour in my case (the calculated shift stays [0, 0])
The same with your last proposal :(

What could be wrong ?

@patquem
Copy link
Contributor Author

patquem commented Jul 8, 2021

I have performed test with different seed.
In some case, the shift is correctly calculated.
It seems to be really "blob distribution" sensitive

@JulesScholler
Copy link

I am experiencing the same thing, depending on the seed the phase correlation can either fail or succeed whereas the cross correlation is always good in this case.

Now, this type of image is really a texture where most of the information is contained in the frequencies amplitude. If you remove the gaussian filter the phase correlation does not fail because on the blobs edges all the frequencies are in phase. In my opinion it is the user responsibility to use a registration algorithm accordingly to a given problem, in this case the function is named phase cross correlation and it should do so or maybe it should be renamed (with an optional argument to return the phase correlation?).

@patquem
Copy link
Contributor Author

patquem commented Jul 9, 2021

I agree with you @JulesScholler
you confirm what I was thinking : Binarization on such images seems to be necessary to adress the "phase" problem.
Thanks for your message.

Sign up for free to join this conversation on GitHub. Already have an account? Sign in to comment
Labels
None yet
Projects
None yet
Development

Successfully merging a pull request may close this issue.

3 participants