Skip to content
New issue

Have a question about this project? Sign up for a free GitHub account to open an issue and contact its maintainers and the community.

By clicking “Sign up for GitHub”, you agree to our terms of service and privacy statement. We’ll occasionally send you account related emails.

Already on GitHub? Sign in to your account

Issues using HDBSCAN #91

Closed
leesteinberg opened this issue May 23, 2018 · 5 comments
Closed

Issues using HDBSCAN #91

leesteinberg opened this issue May 23, 2018 · 5 comments

Comments

@leesteinberg
Copy link

Hi there,

When using HDBSCAN (from hdbscan library, as suggested in Issue #68), the code terminates with :
ValueError: k must be less than or equal to the number of training points

This is with the default behaviour (i.e. using mapper.map(projected_X=projected_data, inverse_X=data, clusterer=hdbscan.HDBSCAN())

The same data and projection work fine with DBSCAN(), so I assume its an issue with the interaction with hdbscan. Maybe you know something about this?

@sauln
Copy link
Member

sauln commented May 23, 2018

HDBSCAN has a parameter min_cluster_size that I believe eventually gets passed down to other functions under the name k. The default for this is 5. It's possible that the cover element that is being passed to HDBSCAN has less than 5 and then the clusterer is balking.

I just added some code to the master branch that will only try to cluster data that is larger than min_cluster_size. We had something similar for K-means clustering also.

Could you try installing from the library from master and see if that fixes the problem for you?

git clone https://github.com/mlwave/kepler-mapper
cd kepler-mapper
pip install -e .

@leesteinberg
Copy link
Author

leesteinberg commented May 24, 2018

This seems to work now - thanks.

I think there might be issues with the visualizer on master - particularly with IE (which is not surprising). Unfortunately, I am very restricted to using IE - is it safe to use an old version of visuals.py (the version of the library on pip seemed to work)?

Edit:
To go into more detail, the Cluster Details and other drop down(?) menus don't seem to work. Replacing visuals.py is not the simple solution - I think the KeplerMapper.visualize() now requires a format_mapper_data() function which is not present in the older version

Edit 2:
It's definitely an IE issue, as I have now applied for special permission to use Chrome and it is working fine in that browser. Can I request a feature where the node_id is visible in the Cluster Details menu [I have slightly modified _format_tooltip() to be passed node_id as an argument, and this seems to work]?

Edit 3:
This is more a general comment
RE: the overlap_perc/perc_overlap variable - its not really clear if this is a percentage (i.e 0-100) or a fraction (0-1)

@sauln
Copy link
Member

sauln commented May 24, 2018

Thanks for your comments! I'm glad the fix worked. I'm sorry it isn't working on IE!

As a temporary solution, you could use the older visuals.py and visualize() method. They're pretty disjoint from the map method, so it would probably work fine. Working with Chrome will probably be more reliable in the long run though.

Any idea what's going wrong with IE? I'll try to take a look later tonight. Definitely need to get that resolved before we update pypi.

Your modified _format_tooltip() is correctly showing the node_id? If you want to submit a pull request, we can work together to integrate it. I'd also like having that feature. You might have seen in the code, I've left a TODO to add it at some point.

perc_overlap is a fraction between 0 and 1. I can see how that can be confusing and we should add documentation about it. Please don't hesitate to submit a PR!

@leesteinberg
Copy link
Author

I've made a pull request modifying _format_tooltip

perc_overlap can be set > 1. Is there a reason why someone might want to do this?

@sauln
Copy link
Member

sauln commented May 30, 2018

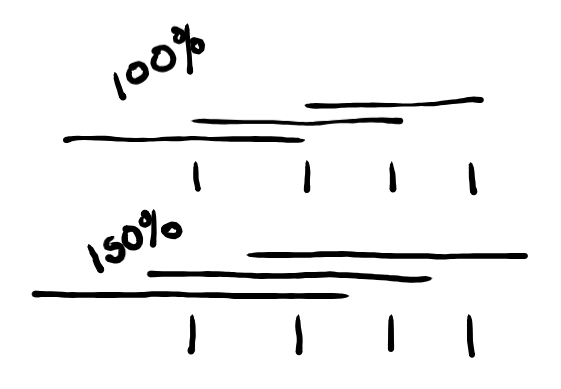
Hi @leesteinberg, the PR looks good. I'll merge it as soon as I have time to actually run the code.

The way the bin width is calculated is a little confusing at first. The amount of percentage of overlap is calculated as a percentage of the distance between bins, not the percent the bins overlap. If it was actual overlap, then we could never have finite bin length and perc_overlap==1.

Suppose you wanted the bins to interact with bins that are not directly adjacent. Maybe the little drawing below helps.

drawing

@sauln sauln closed this as completed Jun 5, 2018
Sign up for free to join this conversation on GitHub. Already have an account? Sign in to comment
Labels
None yet
Projects
None yet
Development

No branches or pull requests

2 participants