Problems running what seems a perfectly valid example #2980
Comments
|
Perhaps the code on the web page is not what produced the figures? I get the same results as you on all Scipy versions starting from 0.7, so there is no change of behavior on our side. |
|
@Juanlu001: you seem to have read the blog post in question a long time ago --- do you know if there's something wrong with it? |
|
Well, I didn't run the code back then, and doing it now actually produces what Mike reported. I submitted a comment (now awaiting moderation) about the issue just in case the author can give some insight. |
|
Just a side note, even if the code hasn't changed I'm pretty sure that a Butterworth filter wouldn't have a 10^-5 passband so something seems broken to me, even if he generated the output some other way. Also, here's the code in question: So signal.buttord is saying that this should be a 10th order filter in order to achieve the requirements of a 2dB (max) loss in the passband and a 30dB attenuation is the stopband. What comes out of that is "the lowest order for a Butterworth filter to meet spec" (http://docs.scipy.org/doc/scipy/reference/generated/scipy.signal.buttord.html) but when the design actually happens using the N from signal.buttord I'm seeing a passband of 10^-5 (so either -50dB or -100dB) and a stopband of 10^-20 which would be either -200dB or -400dB (I can never keep track of when it's 10log(x) or 20log(x)). Any thoughts as to why buttord and butter would seem to be in such disagreement about theory and implementation? |
|
I'm unfamiliar with the subject here, so I can't say much. The source code is available however, and is not terribly complicated. |
|
So I've made a little progress to understanding this problem. I've found that moving the stopband frequency to 3x the cutoff instead of 1.5x the cutoff makes the filter design program behave much more appropriately. Yields this: Furthermore if I want to get a tighter filter, I need to rescale things in order to keep the passband gain around 1. So if I run this: I get this: I'm still not exactly sure why this is. I've also seen this example on S.O. before so I'm taking a crack at it: It's got a cutoff frequency of 1250 Hz and for a 9th order filter it rolls off REALLY fast. I've modified the code there slightly to show not just the -3dB point but also -10dB, -20dB and -30dB. Running that code gives me this: The roll-off from -3dB at 1250 Hz to -30dB at maybe 1400Hz is really severe, just like we'd expect for a 9th order filter. I'm starting to think that this is a problem with having the 3dB breakpoint being much, much smaller than the nyquist frequency as referenced in #2140 as the above example shows that a Buttworth filter can absolute meet the requirements. |


|
Some additional investigation. I've tried changing the sample rate in the original example. It was originally 20 and I'll post some examples of lower sample rates. Here's a sample rate of 2. The filter looks OK but there's aliasing in the sampled data because the frequency of 4 is exceeding the nyquist rate of 1 (1/2 the sample rate) and it's showing up in the filtered output. Here's a sample rate of 3. Filter still looks good and now the signal at 4 is aliasing onto another signal and getting filtered out. It's still wrong but it looks OK by luck. Sample rate of 4. Filter no longer looks right, it's got a passband of 1e-3 when it should be no smaller than around 0.7 so the bilinear transform has started to muck things up if the analysis in #2140 is correct. It's still nice and flat in the passband like a Butterworth should be, though. Output is still not right as there's still aliasing during sampling. Now a sample rate of 8. There shouldn't be any aliasing because none of our signals are above the nyquist rate anymore. The filter still has a decent shape, but it's got 30dB of attenuation in the passband when it should have no more than 2dB of attenuation. Because of that attenuation in the passband the output looks to have the right shape but it's 1000 times too small. In order to correct that I've scaled b (the numerator) by 1000 and that yields this output. Shapes are right and so are the amplitudes. Moving to a sample rate of 12 we're well into the range of no risk of aliasing. The shape of the filter is starting to suffer in addition to the passband attenuation being 30dB too great. The output is highly attenuated. Let's make up a ratio between the Nyquist rate and the 3dB breakpoint of the filter (0.1). I can't explain why that happens the way it does but I am digging into this in the hopes that someone else will see all the examples and they'll understand where in the code things are going wrong. |


|
Maybe also ping the mailing list, there must be a few people there who know this stuff well. |
|
The answer of the author of the article has been that he is of no help anymore because he moved away from that line of work a while ago. Maybe someone can help on the mailing list. |
|
I think I have some idea what’s going on here. There are a few aspects to this. The fundamental problem is that it’s generally not a good idea to represent higher order IIR filters in transfer function form ([b, a] form). According to Mathworks [1] this can happen as low as order 8. The example computes that a 10th order filter is needed to meet the specs. The reason is that higher order filters may need extremely precise tap coefficients to get the desired performance. Therefore, numerical error in the calculation of the tap coeffs can destroy the performance, which is what we see here, I believe. In fact, the computed filter is unstable, which can be seen in the “filter output – time domain” graph, and is apparent if you check the poles of computed transfer function; i.e. np.roots(a) contains values with magnitude greater than 1, meaning there are poles outside the unit circle. Because of the required precision of high order IIR coefficients, high order IIR filters are generally implemented in practice as cascaded second order filters. This relaxes the required precision while maintaining the performance desired. Scipy.signal doesn’t contain this functionality as it currently stands. There are some people who have implemented this in python out there on github, if you look around. Incorporating this into scipy.signal could be a nice improvement. The general scheme is that you design your filter using z,p,k output and then convert that to second order sections by grouping pole pairs and zero pairs to form biquads. So seemingly we could do that with scipy.signal, but there is one remaining problem. Changing the signal.butter output to ‘zpk’ produces unstable poles. Running the same input in matlab produces a stable filter. So I checked into the differences in scipy and Matlab’s butter functions. The butter function works by calling iirfilter, which in turn works by computing an analog prototype in zpk form with cutoff frequency at 1 rad/s. This is then converted to ba form, still as an analog filter. That filter is then fed to lp2lp (or lp2hp, etc) to transform the cutoff frequency to the requested one. Finally the new b,a coefficients are fed to bilinear to transform the analog filter into a digital one. I checked and it is at this point that the filter becomes unstable. Converting to zpk form, if requested, is the last step. So consequently, if the filter is unstable already, converting to zpk doesn’t help us. I checked Matlab’s butter code and it’s very similar. They describe the approach in the online help [1]. They first design and analog, zpk form filter, same as scipy, but instead of converting to ba form, they convert to state space form to do the cutoff frequency transformation. They then use the state space bilinear transform to convert to digital and then convert to the desired output form. I don’t understand exactly why using the state space representation doesn’t result in numerical errors. Does anyone have any insight there? In any case, it seems like this would be the approach to adopt to avoid these problems and allow high order zpk design to work properly. [1] http://www.mathworks.com/help/signal/ref/butter.html, see ‘Limitations’ and ‘More About: Algorithms’ |
|
Thanks for the comment, it's very useful information. The proper fix then seems to be to compute zpk form filters without unstable intermediate steps. The code already gives warning about numerical instability --- after the ba issue is fixed, the message could perhaps be clarified to recommend to use a stabler representation. |
|
I just saw that unstable intermediate step issue I brought up in my comment is already listed under #2443. I'll see if I can get the discussion started again there, looks like it petered out a few months back. I have an idea that might bypass the issues they ran into. |
|
Ok, closing as duplicate of gh-2443 |
|
In the original example I posted the sample rate was 20, the filter passband was up to 0.1 and the stopband was supposed to start at 0.15 both of which are well below the sample rate. If I move the passband up to 0.4 and the stopband to 0.6 keeping a sample rate of 20 then I get a perfectly well behaved 10th order Butterworth filter. See below: Furthermore if you look at the examples I posted here: #2980 (comment) you'll see that as the filter gets to be closer to the nyquist frequency by virtue of reducing the sample rate that the filter behaves much better. And if you look at #2140 you'll see that he mentions the "instability" of the bilinear transform as causing the errors to get large. What he's referring to there is numerical instability, meaning the inability of the computer to preserve precision through the calculations, not "unstable" in the sense that the filter is no longer BIBO stable. It's definitely BIBO stable as it attenuates quite heavily. BIBO stability just requires that the ROC includes the unit circle. http://en.wikipedia.org/wiki/Radius_of_convergence I'm not trying to re-open this, I just wanted to get some comments in myself and I didn't get the chance to before it was closed. |

|
By the way, see #1175 and https://gist.github.com/endolith/4525003 for second-order sections implementation that would allow you to run high-order filters (but that is not compatible with scipy license and still needs work) |
|
I've checked that with gh-3085 the sample rates of 8 and 12 still work, no attenuation at all in the low-pass area. |
|
I'm setting the Milestone for this issue to 0.14.0 because gh-3085 should be merged before that release. |
I'm doing some work in filtering and having a bit of a rough time. I went looking for some examples and I found this:
http://azitech.wordpress.com/2011/03/15/designing-a-butterworth-low-pass-filter-with-scipy/
It looks to me like a perfectly valid set of examples, and he's even generated some example output. It looks reasonable.
So I download the code and try running it on my machine. I see this error:
/usr/lib/python2.7/dist-packages/scipy/signal/filter_design.py:288: BadCoefficients: Badly conditioned filter coefficients (numerator): the results may be meaningless
"results may be meaningless", BadCoefficients)
b=[ 1.50249921e-18], a=[ 1. -9.78671066 43.10310124 -112.50164481 192.7084543
-226.36430741 184.66074807 -103.30140929 37.92528936 -8.25143211
0.80791132]
And then the graph looks substantially different:
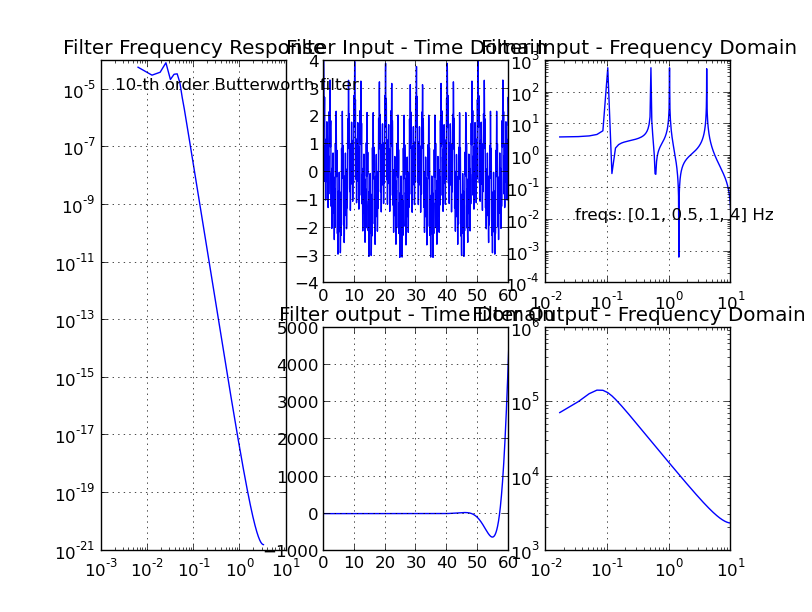
The thing that strikes me is that in the filter passbands are HUGELY different. The example output he shows has a passband gain of 1. My passband gain is 10^-5 so it's all attenuation.
I found this ticket #2140 and it mentioned problems with the "small enough to zero out" number. I'm running a newer version of scipy which already has the 1e-14 threshold so that doesn't seem to be the problem.
This is really puzzling me.
The text was updated successfully, but these errors were encountered: