by Scott Prahl


![]()

pypolar is a python module to model and visualize the polarization state of light as it travels through polarizers and birefringent elements. Some ellipsometry support is also included.
There are four numeric modules:
- pypolar.fresnel - reflection and transmission calculations
- pypolar.jones - management of polarization using the Jones calculus
- pypolar.mueller - management of polarization using the Mueller calculus
- pypolar.ellipsometry - ellipsometry support
A module for visualization:
- pypolar.visualization - Routines to support visualization
and three modules that support symbolic algebra:
- pypolar.sym_fresnel - Fresnel reflection and transmission
- pypolar.sym_jones - Jones calculus
- pypolar.sym_mueller - Mueller calculus
Detailed documentation is available at Read the Docs.
Use pip:
pip install pypolar
or conda:
conda install -c conda-forge pypolar
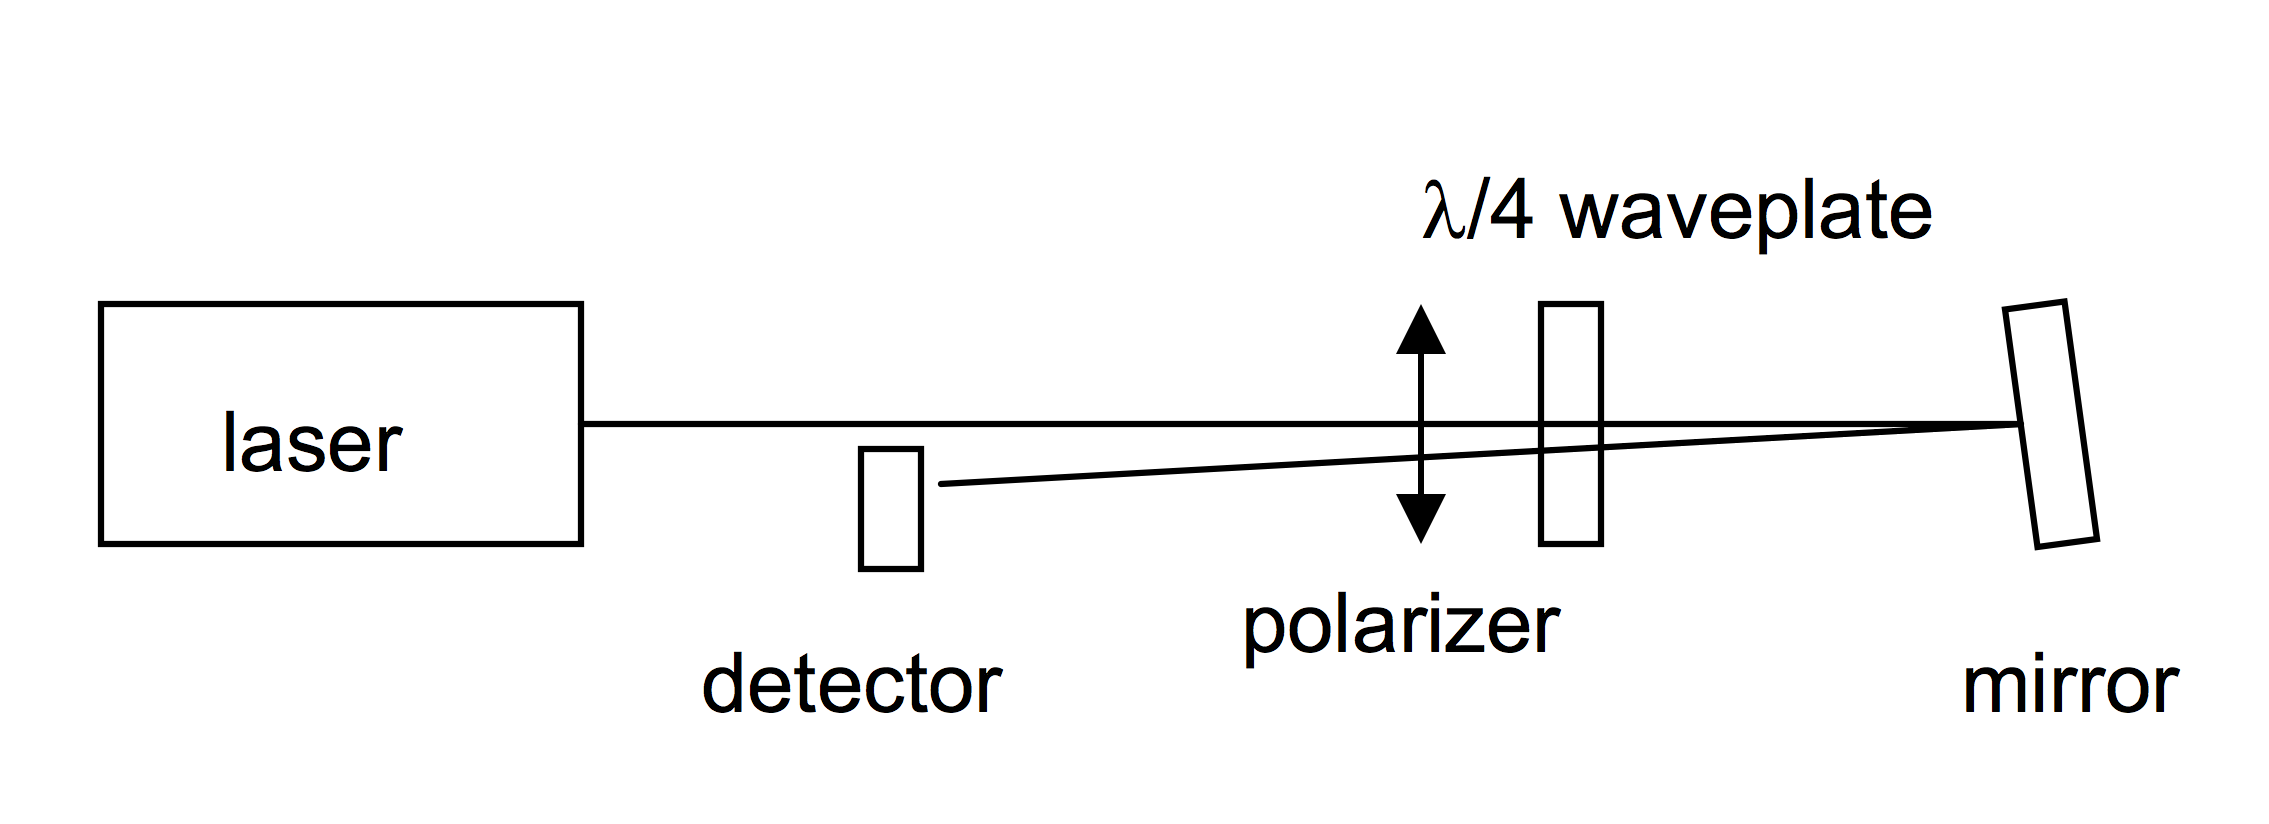
Consider modeling an optical isolator.
import numpy as np
import matplotlib.pyplot as plt
import pypolar.jones as jones
import pypolar.visualization as vis

J1 = jones.field_elliptical(np.pi/6,np.pi/6)
J2 = jones.op_linear_polarizer(0) @ J1
J3 = jones.op_quarter_wave_plate(np.pi/4) @ J2
J4 = jones.op_mirror() @ J3
J5 = jones.op_quarter_wave_plate(-np.pi/4) @ J4

fig = plt.figure(figsize=(8, 8))
ax = fig.add_subplot(111, projection='3d')
vis.draw_empty_sphere(ax)

vis.draw_jones_poincare(J1, ax, label='  start', color='red', va='center')
vis.draw_jones_poincare(J2, ax, label='  after Polarizer', color='blue', va='center')
vis.draw_jones_poincare(J3, ax, label='  after QWP', color='blue', va='center')
vis.draw_jones_poincare(J4, ax, label='  after mirror', color='blue', va='center')
vis.draw_jones_poincare(J5, ax, label='  final', color='red', va='center')

vis.join_jones_poincare(J1, J2, ax, color='blue', lw=2, linestyle=':')
vis.join_jones_poincare(J2, J3, ax, color='blue', lw=2, linestyle=':')
vis.join_jones_poincare(J3, J4, ax, color='blue', lw=2, linestyle=':')
vis.join_jones_poincare(J4, J5, ax, color='blue', lw=2, linestyle=':')
plt.show()
will produce

import numpy as np
import pypolar.mueller as mueller

A = mueller.stokes_right_circular()       # incident light
B = mueller.op_linear_polarizer(np.pi/4)  # polarizer at 45°
C = mueller.op_quarter_wave_plate(0)      # QWP with fast axis horizontal
D = mueller.op_mirror()                   # first surface mirror
E = mueller.op_quarter_wave_plate(0)      # QWP still has fast axis horizontal
F = mueller.op_linear_polarizer(-np.pi/4) # blocks at -45° travelling backwards
F @ E @ D @ C @ B @ A
produces
array([0., 0., 0., 0.])pypolar is licensed under the terms of the MIT license.