cassandra-stress starts to timeout and fail after ~20min with GCE local disks #7341
Comments
|
so we have the reason, the nodes run with mq and share cpus with OS, so NIC traffic and SIs interfere btw. neither of the tuning runs by default: |
as for CPU scaling, I don't seem to be able to turn it on, I'm not even sure we can do that on GCE, didn't found any information regarding that. |
|
talking offline with @vladzcloudius he mentioned this issue: and this rule of thumb, base on the number of cpu might work better: I'll give it a try too |
|
hmm and looking at my comment I wanted to say it's about so basically /etc/scylla.d/cpuset.conf https://github.com/scylladb/seastar/blob/master/scripts/perftune.py#L1355 |
|
that command on your GCP does: |
|
after which is also not what we want |
|
dry run of perftune: so we just lock to all cpus |
|
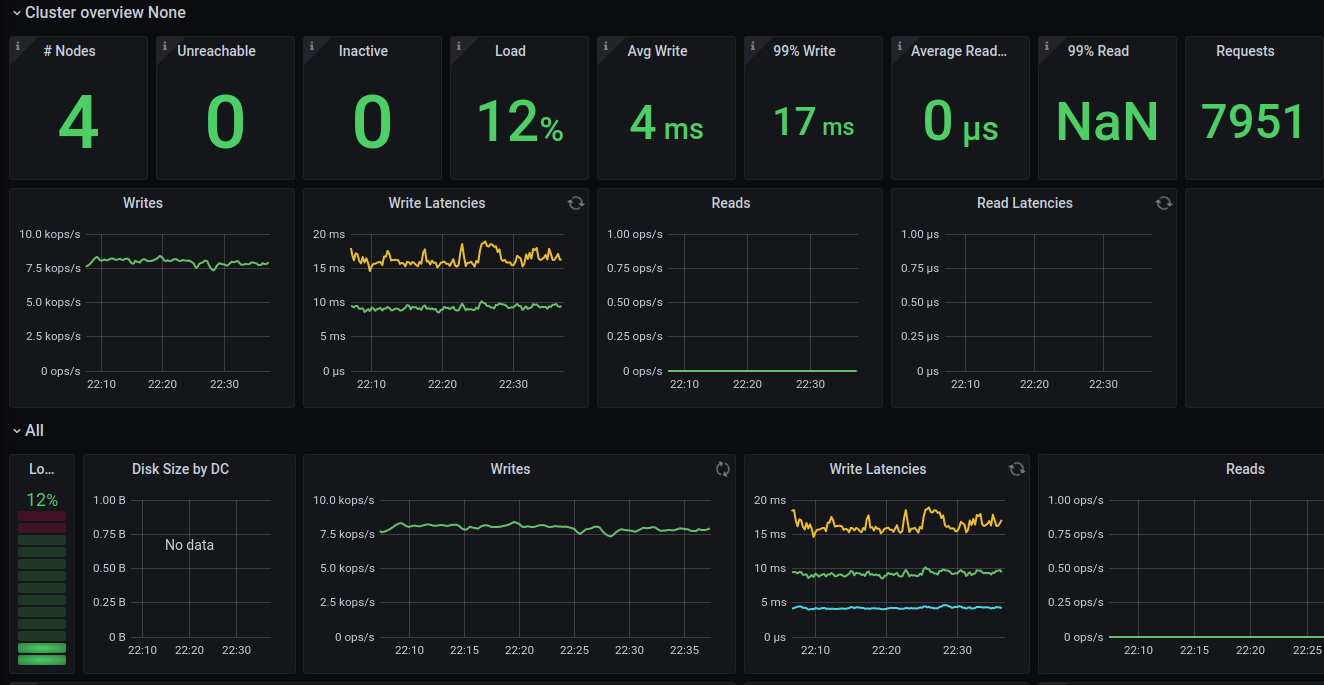
As wrong as the configuration might have been, @fruch, I don't think that's the root cause of timeouts. The reason is that you are pushing the rate to the maximum (since you don't set the rate target in the c-s command line) which gets the I/O to its limit pretty fast (see the amount of background writes). On top of that LCS kicks in and starts consuming a lot of I/O budget (rates get as high as 1GB/sec in the compaction class):
Which adds to the insult. I think you need to pace the c-s down here or not get offended by a few timeouts:
|
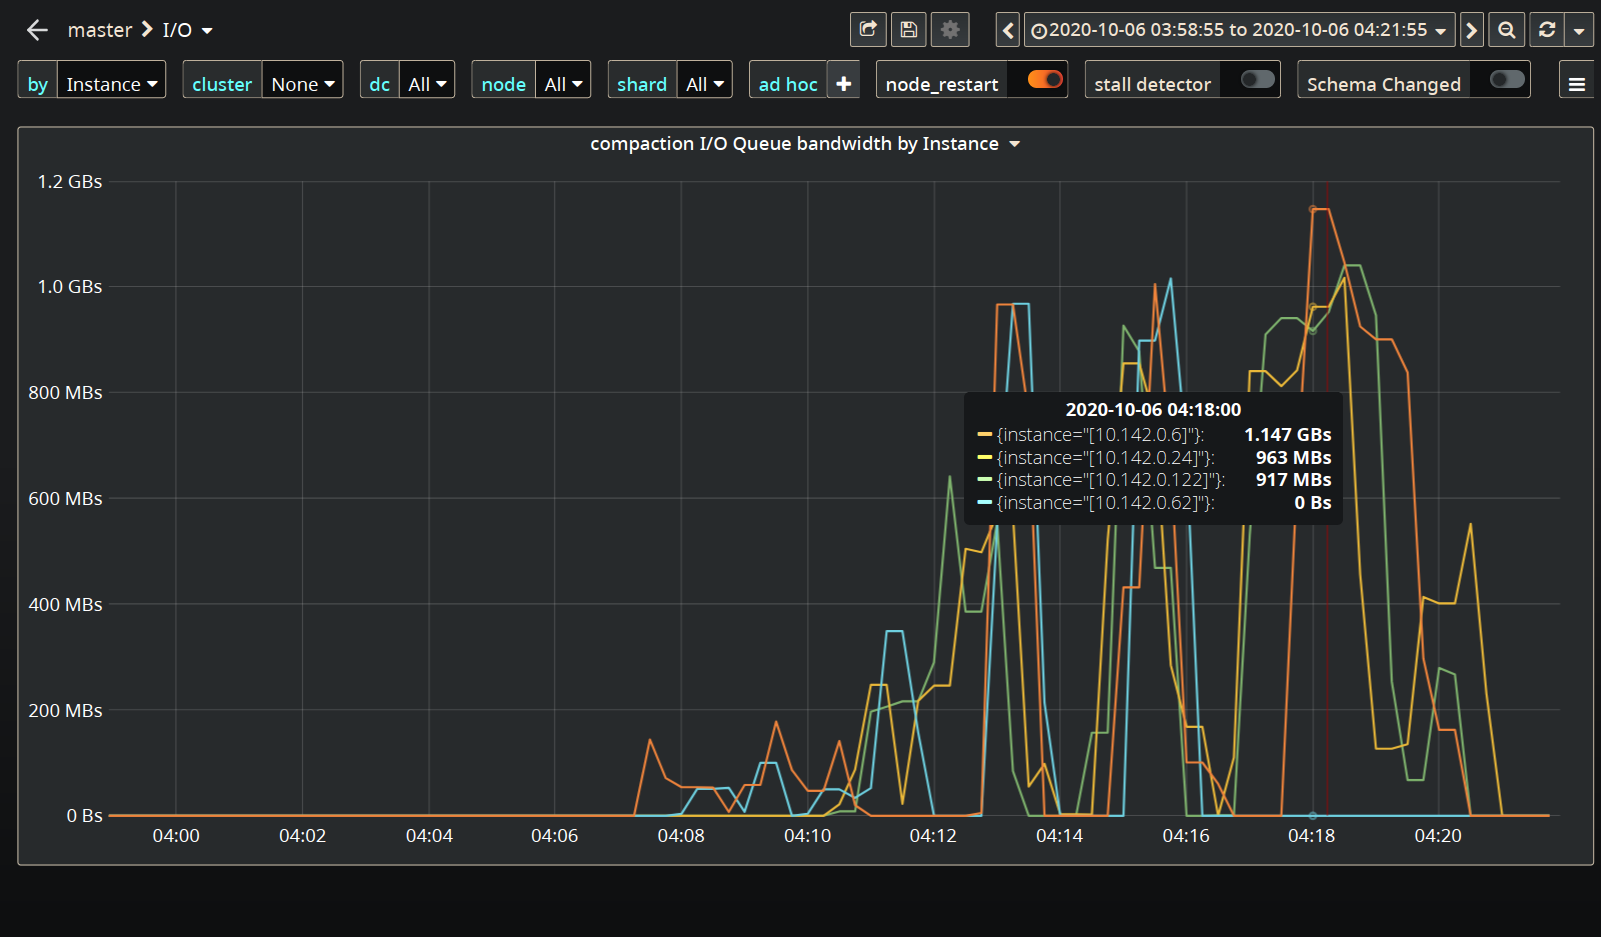
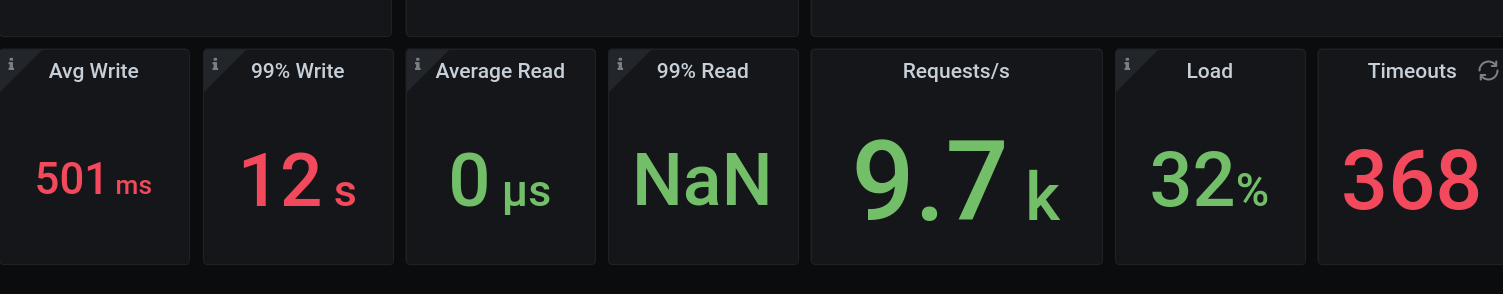
1.2Gbs is much better then before, we failed at ~600Mbs Also I don't know if I can call those a few timeouts @tarzanek |
|
I opened #7350 since running tools used to work, now it's not, scripts will break, automation scripts will too |
|
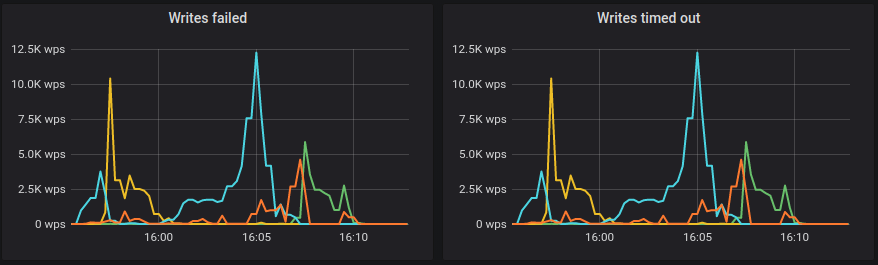
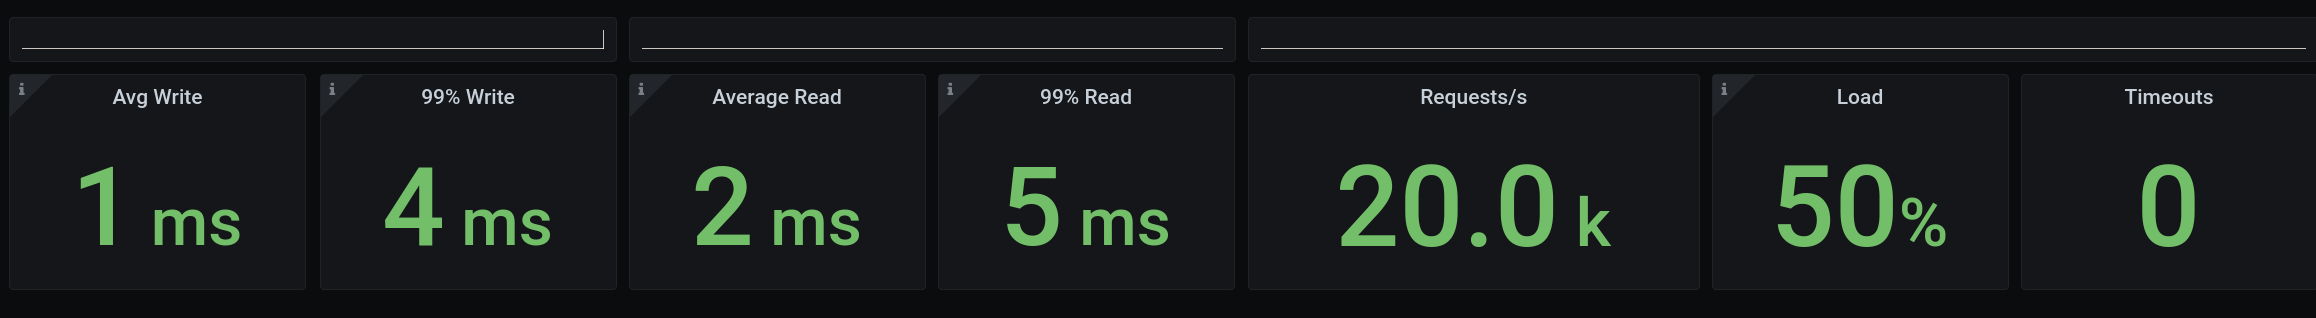
I've playing around with it yesterday I've change the command limit the load from c-s end, One surge of timeouts have seen at the begining, but after that is stable for a while: again compared to run on our AMIs in AWS, 40K is around half of what I remember we can get, downloaded the monitor to take a peak from out runs of 4.1 with 1Tb http://3.216.132.220:3000/d/manager-2-2/scylla-manager-metrics?orgId=1&refresh=30s Latency is 15-40ms, but scylla seem to be throttling it quite fine, out of the box. the bottle neck is just in a different place ? i.e. in AWS seem like it's the CPU, and in GCE it's the disk ? |
|
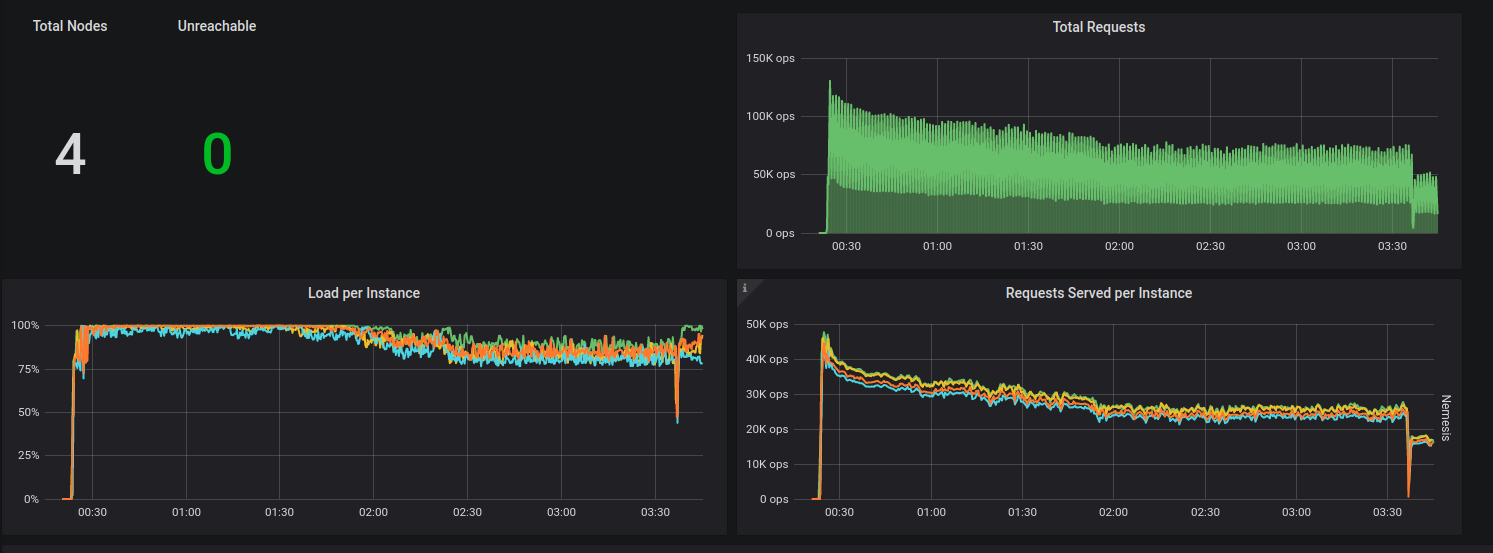
It was holding for ~3 hours, but reach ~360Gb on each node, and started failing. |
|
@israel Fruchter <fruch@scylladb.com> which kernel are you using we know
that in the tobe gcp image we use a different kernel then whats shipped in
cenots7 / centos8
…On Wed, Oct 7, 2020 at 2:09 PM Israel Fruchter ***@***.***> wrote:
It was holding for ~3 hours, but reach ~360Gb on each node, and started
failing.
—
You are receiving this because you are subscribed to this thread.
Reply to this email directly, view it on GitHub
<#7341 (comment)>,
or unsubscribe
<https://github.com/notifications/unsubscribe-auth/AA2OCCGOEBPGNMIYDWGW2LLSJRD5HANCNFSM4SFUGCQQ>
.
|
|
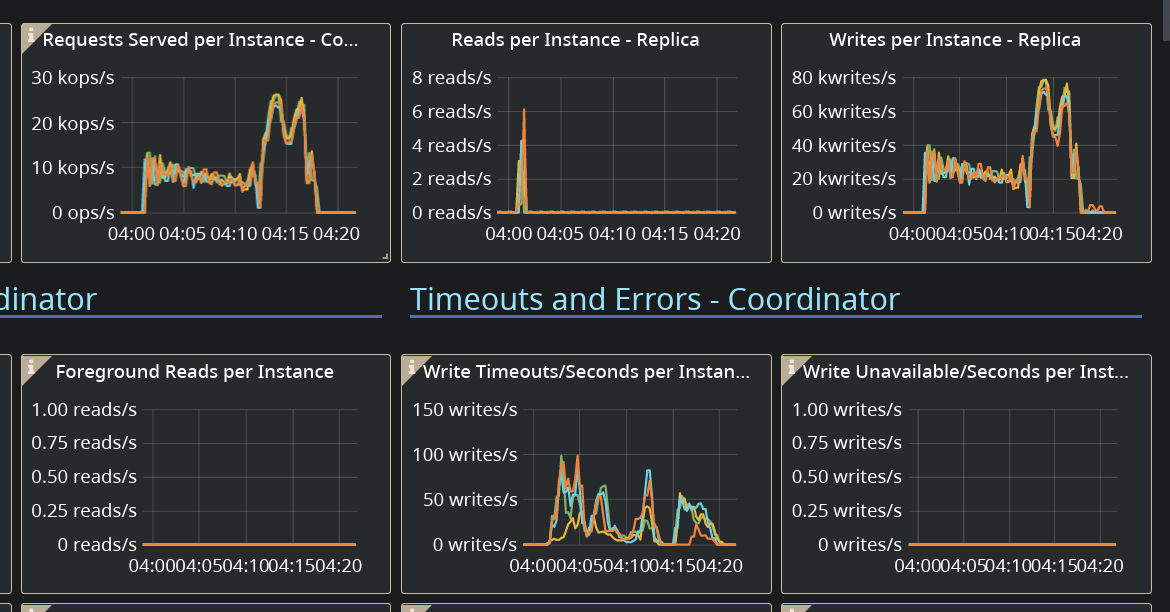
SIs after using sq_split : so far most writes were retried, almost no time outs |
|
after patching the cpuset to: for compering we had one run without throttling , it lasted ~1.5 hours, and did got to 60K-70K ops, as @tarzanek estimated both case compaction was starting to raise when the "storm" starts. a note c-s, is ignoring timeouts, and retry 10 times, it fails when a request is failing 10 times in a row. in our test we rarely ignore all errors in c-s. |
|
so next step is using just 56 threads, ev. try to increase limit to 50k the only other optimization would be kernel |
|
@fruch which kernel version - we know that the gce image is not using the centos8 provided one - we had to change it to get a better support for the local drives |
|
@bentsi ^^ |
That kernel contains the google nvme fixes. |
|
@avi @slivne Should I try ubuntu18 or ubuntu20 ? or try out the GCE image with the ml-kernel ? (or both, or all 3 options 😭 ) One more question:
|
|
@fruch If you see timeouts - this means you are overloading the cluster. The system is able to pull out as much as it can. AWS and GCE are not the same. You see timeout later in the process because of heavier compactions - you use LCS, which has a heavy write amplification. Unless you try to estimate the performance of LCS on GCE you should take this into an account and apply lower rates. |
|
I've took the initial image we have for GCE (after we fixed a few SCT issues) it has kernel: 5.8.2-1.el8.elrepo.x86_64 but it seems to be much much worse the new monitor (branch-3.5) is cooler, but we get only ~8K writes: this one doesn't have the patches for the hard coded |
I've ditched LCS, it help a bit. but still compaction take a toll. |
|
Update: Trying out Ubuntu 20.04, I've run into this small issue: #7383 |
|
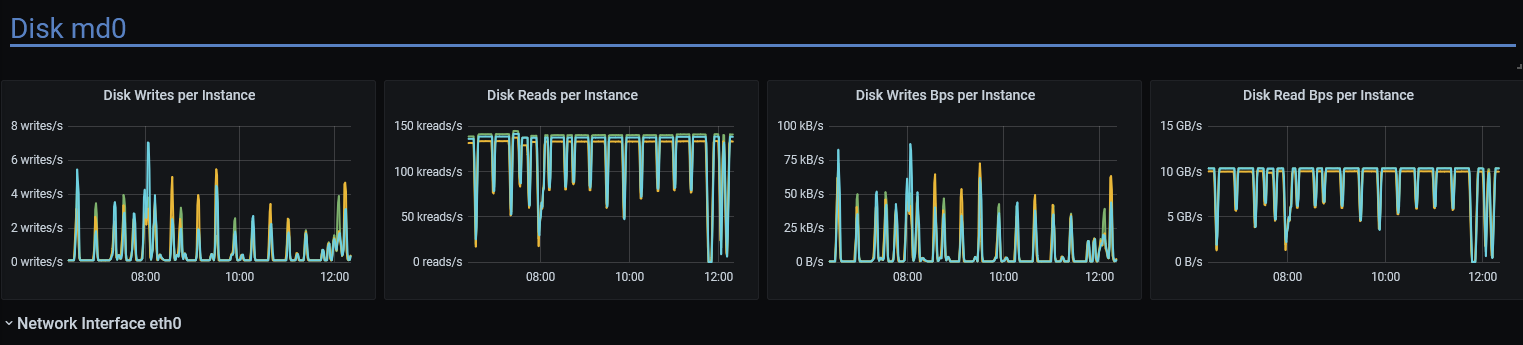
I tried one approach, of stopping compaction all together using it's almost done writing the 1Tb: I'm writing from 2 loader at 80K rate-limit, and writes to disk are at 130-190 MB/s, (When compaction was on, we go to almost 1.2 GB/s writes to disk, each time timeouts started) something in scylla limits/throttle of the disk isn't working as we expect... (and used to see in AWS) |

|
The hardcoded values you take from the patch I've sent should be what Google guarantees |
|
Its not the first time we have issues with google local drives / drivers. Lets try to verify if the bandwidth shown holds for a long duration not io_tune duration and if there is a bug. @roydahan / @avikivity which tool should we use to verify the local disks provide the guarantees on a long duration (a coupld of days). |
|
@vladzcloudius , no this time it was ubuntu 20.04 default one. |
And do we have a "rate hole" with |
scylladb/seastar#881 |
@vladzcloudius , yes. I've seen it on pretty much every kernel except for some ancient one, where the performance was just bad (this "hole" spaned all the time). |
Please add podman support in SCT to the roadmap. |
|
Asked to share this from Scylla Slack. Chiming in due to running into similar timeout issues that were experienced in this thread that may have causally been solved by the Scylla version: 4.2.3 (due to #8032) Previous setup New setup The n2-highmem-8 GKE instance wasn't detected and was tuned to following. While there were multiple variables changed between the setups (cpu, memory, # disks) such that it's not exactly apples to apples, it's worth further investigating the write cache as having potentially made the major difference. |
|
seastar patch was merged - so there is a way to disable write_back cache but we need now to add the setting when creating the devices in GCE image |
Correct, @penberg |
|
@penberg ping |
This adds support for disabling writeback cache by adding a new
DISABLE_WRITEBACK_CACHE option to "scylla-server" sysconfig file, which
makes the "scylla_prepare" script (that is run before Scylla starts up)
call perftune.py with appropriate parameters. Also add a
"--disable-writeback-cache" option to "scylla_sysconfig_setup", which
can be called by scylla-machine image scripts, for example.

Refs: scylladb#7341
As outlined in scylladb/scylladb#7341, we need to disable writeback cache
on GCE for better performance.
This adds support for disabling writeback cache by adding a new
DISABLE_WRITEBACK_CACHE option to "scylla-server" sysconfig file, which
makes the "scylla_prepare" script (that is run before Scylla starts up)
call perftune.py with appropriate parameters. Also add a
"--disable-writeback-cache" option to "scylla_sysconfig_setup", which
can be called by scylla-machine image scripts, for example.

Refs: scylladb#7341
Tests: dtest (next-gating)
This adds support for disabling writeback cache by adding a new
DISABLE_WRITEBACK_CACHE option to "scylla-server" sysconfig file, which
makes the "scylla_prepare" script (that is run before Scylla starts up)
call perftune.py with appropriate parameters. Also add a
"--disable-writeback-cache" option to "scylla_sysconfig_setup", which
can be called by scylla-machine image scripts, for example.

Refs: #7341
Tests: dtest (next-gating)

Closes #8526
|
just on the testing side of this (since I see the graphs of patched and unpatched systems in front of me)
without the patch the reads maximum seem to be stuck around 7.5G , so this was very good sleuthing Pavel, thank you! |
As outlined in scylladb/scylladb#7341, we need to disable writeback cache
on GCE for better performance.
|
Last run on master looks much better. https://snapshot.raintank.io/dashboard/snapshot/Yyepci6dFyB1XPxbwWad6GbH4uNBHgS7 However, some stress runs still failing, investigating why. |
|
The failing stress commands are not related. @slivne FYI |
This adds support for disabling writeback cache by adding a new
DISABLE_WRITEBACK_CACHE option to "scylla-server" sysconfig file, which
makes the "scylla_prepare" script (that is run before Scylla starts up)
call perftune.py with appropriate parameters. Also add a
"--disable-writeback-cache" option to "scylla_sysconfig_setup", which
can be called by scylla-machine image scripts, for example.

Refs: scylladb#7341
Tests: dtest (next-gating)

Closes scylladb#8526

(cherry picked from commit 0ddbed2)

Fixes scylladb#1784.
Installation details
Scylla version (or git commit hash): 4.1.7 (4.1.7-0.20200918.2251a1c577)
Cluster size: 4
OS (RHEL/CentOS/Ubuntu/AWS AMI): Centos8/Ubuntu1804
Hardware details (for performance issues)
Platform (physical/VM/cloud instance type/docker): GCE (n1-highmem-16)
Hardware: sockets= cores= hyperthreading= memory=
Disks: (SSD/HDD, count) Nvme 8/6 disks
Summary
Trying to fill up a GCE setup with 1Tb of data, for testing backup to Google Storage.
This is the stress command we are using:
After ~20min we start getting timeouts that fails the load with the following errors:
Logs (Centos8)
hydra investigate show-monitor 519a5474-7368-4a4d-8ac2-48554092342Further thing we tried
we tried this also with ubuntu1804, suspecting maybe it's a kernel related issue, but got the similar results
talking with @tarzanek, we looking into the io_properties.yaml, he suggested to lower it down, to let scylla throttle it a bit
this is the output of iotune, while measuring:
and this is the io_properties.yaml we overwrite it with: (the parameter that are not part of master, which are calculated base on number of local disks)
After applying the suggested io_properties.yaml, we are still facing those issues
monitor -http://35.196.159.20:3000/d/Z3dCVz5Mk/scylla-per-server-metrics-nemesis-master?orgId=1&from=1601970238340&to=1601972849329
The text was updated successfully, but these errors were encountered: