Python tool to generate simple charts, of calls of spinlocks from logs generated from Ftrace
You must have captured the log of Ftrace with the function-graph option and displaying the timestamp in each record. To do this, configure Ftrace with:
echo /sys/kernel/debug/tracing/duration-proc > trace_optionsEnable the function graph as current tracer
echo function_graph > /sys/kernel/debug/tracing/current_tracerTurn on the tracer and run your tests. Finally, use the result log -avaliable in the directory of Ftrace and use the script as
cp /sys/kernel/debug/tracing/trace data.txt
python SpinLockTracer.py data.txt
passing as argument the source file of data generated with Ftrace.
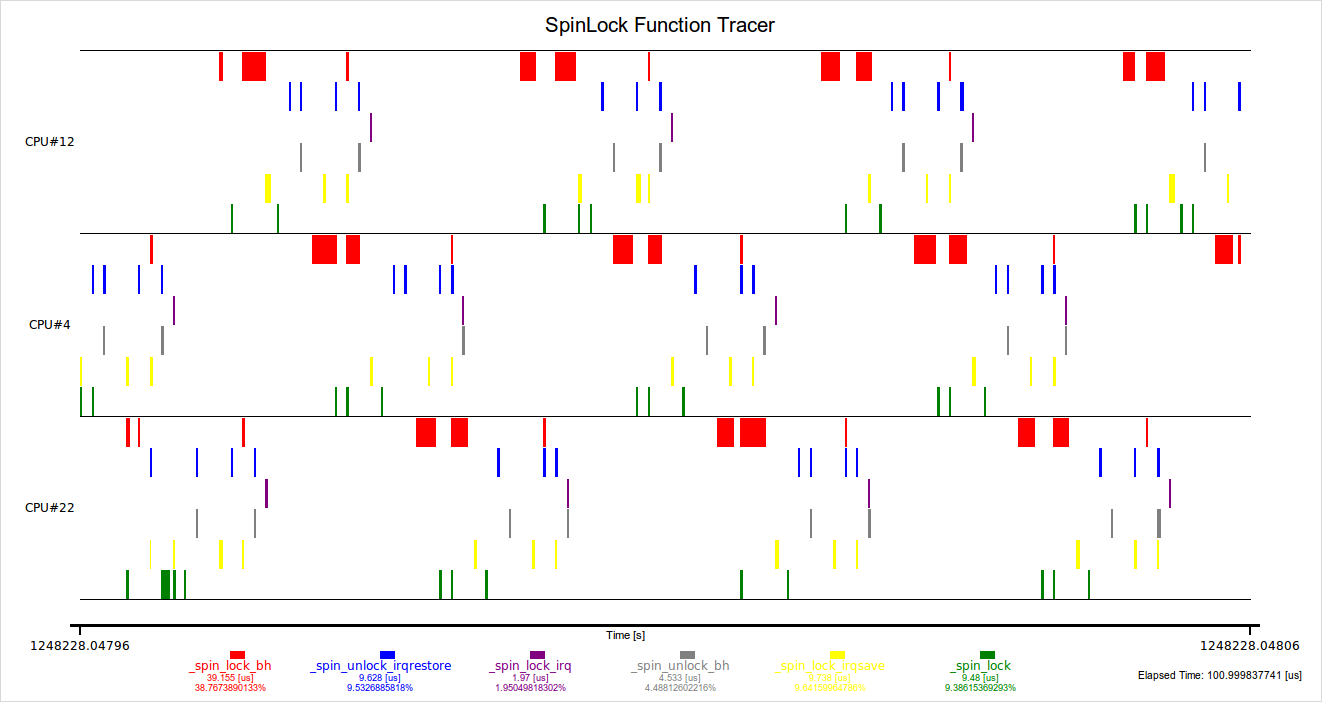
The final result generate a window developed with TKinter, which display the full records from the input file with different colors, total amount of time running the captured functions and a general caption that can be recorded.