Semgrep consume all of the CPU, Possible Regex DoS inside the engine. #827
Comments
|
Forcefully killing throws |
|
@ajinabraham Thank you for filing this. Being sensitive to your project, on what timeline would you like to see a fix? We don't want to block you or your v4 rollout. Depending on how pressing this is, is it acceptable for us to investigate this next week? |
|
This is not blocking me as of now. This was reported by one of the early adopters of nodejsscan cli. For now he can scan the source by ignoring the problematic files.ajinabraham/njsscan#1 |
|
Yes it's probably because of the '...' which right now can be slow on huge files because of the |
|
Yeah it would be ideal to support a configurable depth parameter in semgrep API with a reasonable default. |
This should close #827 and #664

The code to handle foo(); ...; bar(); was very naive
and was doing lots of useless work. This fixes that.

Test plan:
time pipenv run semgrep -f ~/semgrep/tests/PERF/ajin.yaml ~/semgrep/tests/PERF/three.js
3.2s

(was 3min before)

+ /home/pad/github/semgrep/semgrep-core/_build/default/bin/Main.exe -profile -lang py -f tests/PERF/ellipsis-python.sgrep tests/PERF/my_first_calculator.py
---------------------
profiling result
---------------------
Main total                               :      1.670 sec          1 count
Parse_python.parse                       :      0.918 sec          1 count
Parse_python.tokens                      :      0.525 sec          2 count
Semgrep.check                            :      0.458 sec          1 count
Parser_python.main                       :      0.277 sec          1 count
Semgrep.match_sts_sts                    :      0.186 sec      41627 count

(was 85sec before)

+ /home/pad/github/semgrep/semgrep-core/_build/default/bin/Main.exe -profile -lang js -f tests/PERF/ellipsis-js.sgrep tests/PERF/three.js
---------------------
profiling result
---------------------
Main total                               :      2.151 sec          1 count
Parse_js.parse                           :      1.236 sec          1 count
Parse_js.tokens                          :      0.398 sec          2 count
Semgrep.check                            :      0.389 sec          1 count
Semgrep.match_sts_sts                    :      0.239 sec      16824 count
Parser_js.module_item                    :      0.192 sec        609 count

(was a lot more before)
|
no need for -depth parameter yet. The code I wrote was just terribly slow and was doing lots of useless work. With the small fix things seems more tractable. |
* Optimize deep statement matching

This should close #827 and #664

The code to handle foo(); ...; bar(); was very naive
and was doing lots of useless work. This fixes that.

Test plan:
time pipenv run semgrep -f ~/semgrep/tests/PERF/ajin.yaml ~/semgrep/tests/PERF/three.js
3.2s

(was 3min before)

+ /home/pad/github/semgrep/semgrep-core/_build/default/bin/Main.exe -profile -lang py -f tests/PERF/ellipsis-python.sgrep tests/PERF/my_first_calculator.py
---------------------
profiling result
---------------------
Main total                               :      1.670 sec          1 count
Parse_python.parse                       :      0.918 sec          1 count
Parse_python.tokens                      :      0.525 sec          2 count
Semgrep.check                            :      0.458 sec          1 count
Parser_python.main                       :      0.277 sec          1 count
Semgrep.match_sts_sts                    :      0.186 sec      41627 count

(was 85sec before)

+ /home/pad/github/semgrep/semgrep-core/_build/default/bin/Main.exe -profile -lang js -f tests/PERF/ellipsis-js.sgrep tests/PERF/three.js
---------------------
profiling result
---------------------
Main total                               :      2.151 sec          1 count
Parse_js.parse                           :      1.236 sec          1 count
Parse_js.tokens                          :      0.398 sec          2 count
Semgrep.check                            :      0.389 sec          1 count
Semgrep.match_sts_sts                    :      0.239 sec      16824 count
Parser_js.module_item                    :      0.192 sec        609 count

(was a lot more before)

* Adding -debug -profile to semgrep-core and SEMGREP_CORE_DEBUG/PROFILE env var

Those options are useful to debug or profile semgrep-core.
Using the environment variable allows us to pass options to semgrep-core
without having to modify semgrep-python.

Test plan:
pad@yrax:~/github/semgrep/semgrep$ export SEMGREP_CORE_DEBUG=1
pad@yrax:~/github/semgrep/semgrep$ export SEMGREP_CORE_PROFILE=1
pad@yrax:~/github/semgrep/semgrep$ pipenv run semgrep -f ../semgrep-core/tests/PERF/ajin.yaml ../semgrep-core/tests/PERF/three.js
Debug mode On
Executed as: semgrep-core -lang javascript -rules_file /tmp/tmpqfdc1lug -j 8 ../semgrep-core/tests/PERF/three.js
Profile mode On
disabling -j when in profiling mode
PARSING: ../semgrep-core/tests/PERF/three.js
saving rules file for debugging in: /tmp/semgrep_core_rule-4e8afb.yaml
---------------------
profiling result
---------------------
Main total                               :      1.625 sec          1 count
Parse_js.parse                           :      0.724 sec          1 count
Semgrep.check                            :      0.568 sec          1 count
Semgrep.match_sts_sts                    :      0.333 sec     185064 count

* Profiling information for each rule

This allows to see which rules take the most time. Note that
when called from semgrep-python, the rule id are not very readable,
but the generated file is saved in /tmp/ so you can find back
what the rule it corresponds to.

Test plan:
export SEMGREP_CORE_PROFILE=1
export SEMGREP_CORE_DEBUG=1
pad@yrax:~/github/semgrep/semgrep$ pipenv run semgrep -f ../semgrep-core/tests/PERF/ajin.yaml ../semgrep-core/tests/PERF/three.js
Debug mode On
Executed as: semgrep-core -lang javascript -rules_file /tmp/tmpy5pzp3p_ -j 8 ../semgrep-core/tests/PERF/three.js
Profile mode On
disabling -j when in profiling mode
PARSING: ../semgrep-core/tests/PERF/three.js
saving rules file for debugging in: /tmp/semgrep_core_rule-97ae74.yaml
---------------------
profiling result
---------------------
Main total                               :      1.975 sec          1 count
Parse_js.parse                           :      0.828 sec          1 count
Semgrep.check                            :      0.791 sec          1 count
Semgrep.match_sts_sts                    :      0.559 sec     185064 count
Parse_js.tokens                          :      0.335 sec         12 count
Parser_js.module_item                    :      0.083 sec        609 count
Normalize_ast.normalize                  :      0.058 sec          1 count
Common.=~                                :      0.043 sec      51044 count
Common.full_charpos_to_pos_large         :      0.042 sec         12 count
rule:0..0.10                             :      0.035 sec      16824 count
rule:0..0.9                              :      0.031 sec      16824 count
rule:0..0.8                              :      0.030 sec      16824 count
rule:0..0.7                              :      0.029 sec      16824 count
rule:0..0.6                              :      0.029 sec      16824 count
rule:0..0.5                              :      0.029 sec      16824 count
rule:0..0.4                              :      0.029 sec      16824 count
rule:0..0.0                              :      0.029 sec      16824 count
rule:0..0.2                              :      0.029 sec      16824 count
rule:0..0.1                              :      0.029 sec      16824 count
rule:0..0.3                              :      0.029 sec      16824 count
file_type_of_file                        :      0.000 sec          2 count
Semgrep.apply_equivalences               :      0.000 sec         11 count
Common.sort_by_xxx                       :      0.000 sec         11 count
Unix.stat                                :      0.000 sec         12 count

* * docs/development.md: improve doc

Co-authored-by: brendon <brendon.go@gmail.com>
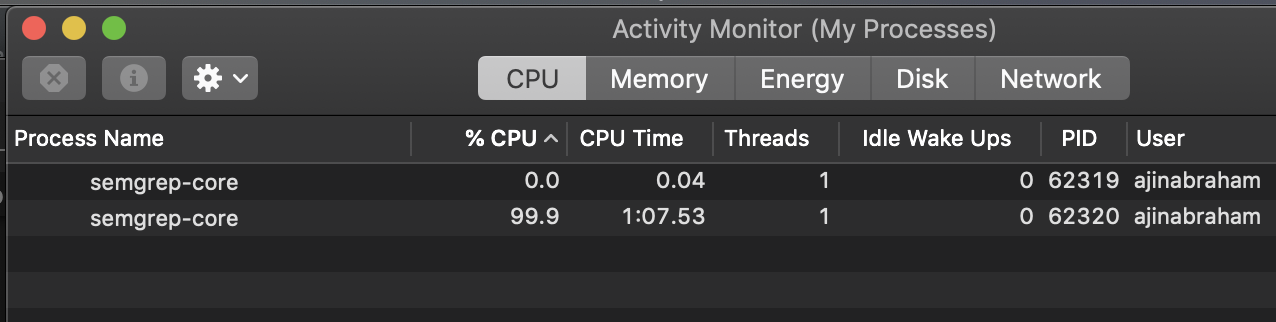
Describe the bug
Certain files and rules cause semgrep to consume all CPU and hangs the process.
To Reproduce
$ semgrep -f foo.yaml ~/Downloads/juice-shop-master/frontend/src/assets/private/three.jsFile: https://github.com/bkimminich/juice-shop/blob/master/frontend/src/assets/private/three.js
Rule: foo.yaml
This issue is present with rules that have ellipsis
...used to match eveything in between, which makes me think that there is Regex dos happening inside semgrep core.Expected behavior
semgrep should have checks against this or timeout on the file if the analysis is taking more than X time.
Screenshots
Environment
semgrep 0.8.0 installed from PyPi
The text was updated successfully, but these errors were encountered: