
Setup | Using the Sensu Go Data Source | Contributing | Code of conduct

Sensu Go Data Source is a Grafana plugin that allows Grafana to connect to the Sensu API. You can use the Sensu Go Data Source to customize your monitoring dashboards with information about Sensu entities and events.
Grab the URL for the latest release zip file.
- Use
grafana-clito install the plugin by providing the plugin zip URL as the value of the--pluginUrlflag:
$ sudo grafana-cli --pluginUrl https://github.com/sensu/grafana-sensu-go-datasource/releases/download/1.0.1/sensu-sensugo-datasource-1.2.1.zip plugins install sensu-sensugo-datasource
installing sensu-sensugo-datasource @
from url: https://github.com/sensu/grafana-sensu-go-datasource/releases/download/1.0.1/sensu-sensugo-datasource-1.2.1.zip
into: /var/lib/grafana/plugins

✔ Installed sensu-sensugo-datasource successfully

Restart grafana after installing plugins . <service grafana-server restart>
-
For Grafana Version >= 8 only!
a) If you use the standalone binaries of Grafana add the plugin to the list of usigned plugins in the configuration file of Grafana:allow_loading_unsigned_plugins = sensu-sensugo-datasource
b) If you use the Docker Image add the following environment variable to the start command:GF_PLUGINS_ALLOW_LOADING_UNSIGNED_PLUGINS=sensu-sensugo-datasource -
Restart
grafana-serverto enable the data source plugin.
In Grafana, select Configuration and Data Sources from the side menu. Select Add data source, and choose Sensu Go.
To configure the Sensu Go Data Source:
-
Add your Sensu backend API URL (default:
http://localhost:8080). When connecting to a Sensu cluster, connect to any single backend in the cluster. For more information about configuring the Sensu API URL, see the Sensu docs. -
Configure the authentification mechanism. Since version 1.1.0 of the data source it is possible to choose between API key and Basic Auth authentication.
-
Basic Auth
- Check the option for Basic Auth.
- Add a Sensu username and password with get and list permissions for entities, events, and namespaces (default admin user: username
admin, passwordP@ssw0rd!). For more information about creating a Sensu cluster role, see the Sensu docs.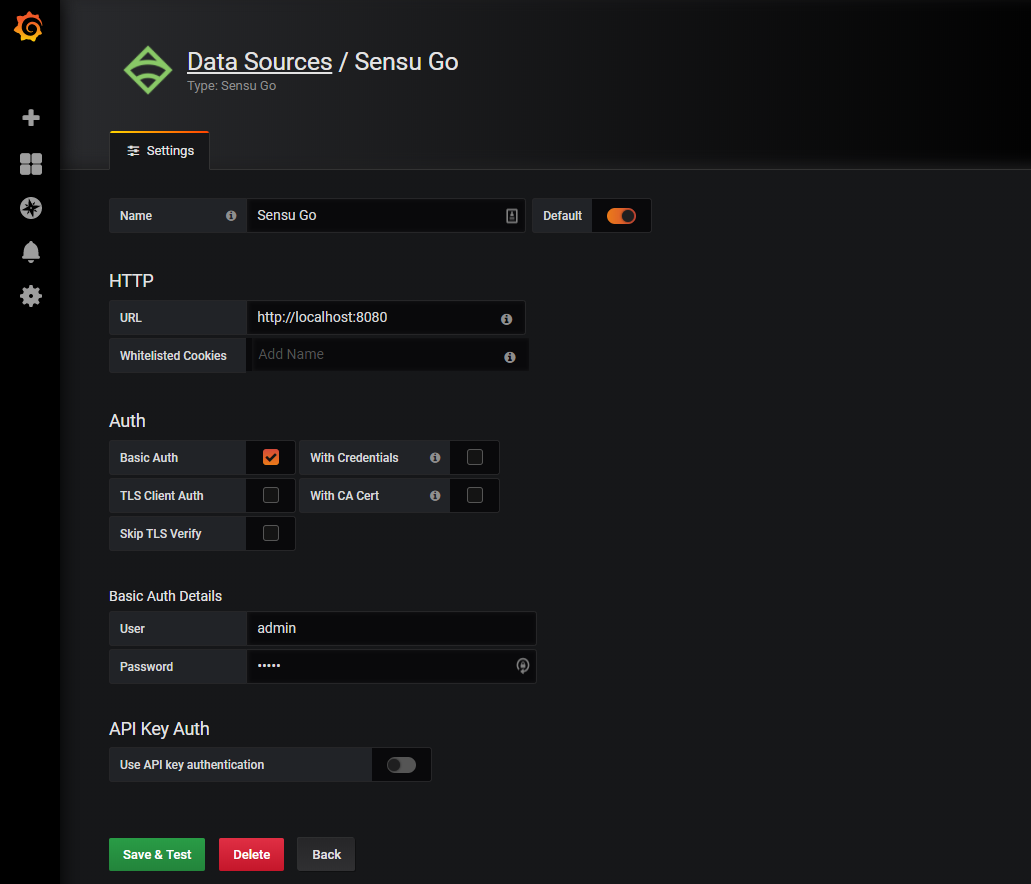
-
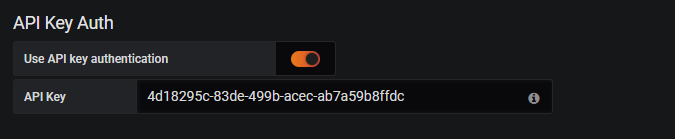
API Key Auth
- Enable the option for the usage of an API key.
- Enter the API key which you want to use. See the Sensu Go documentation for information on how to create an API key.
-
-
Select Save & Test. You should see a banner confirming that Grafana is connected to Sensu Go.

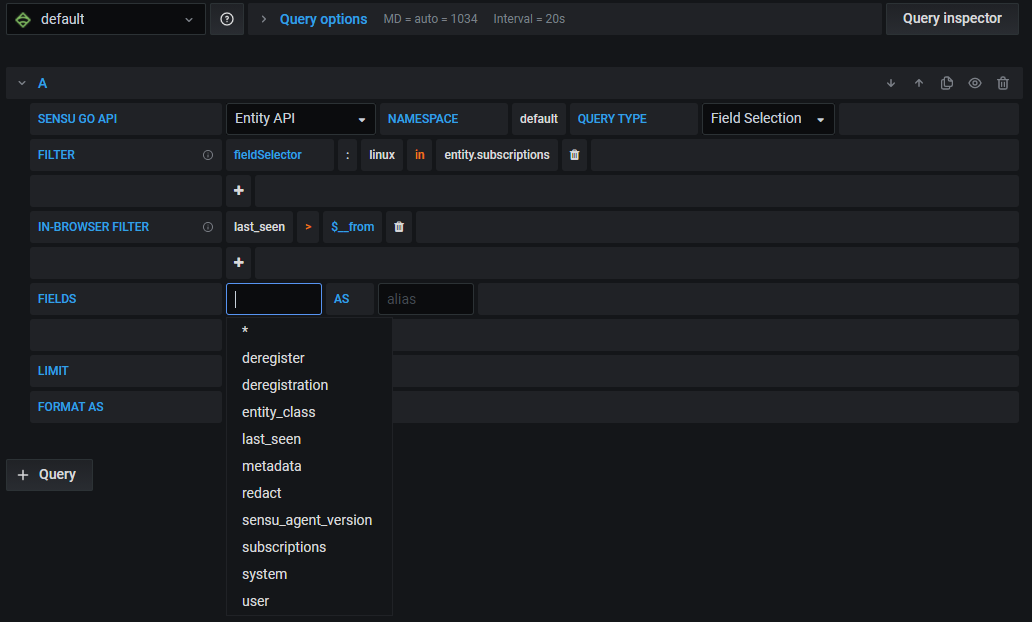
To build a query, select the Sensu Go data source and the Entity, Events, or Namespaces API. See the Sensu docs to learn about available attributes for entities, events, and namespaces. To learn more about building dashboards, see the Grafana docs.
The Sensu Go Data Source supports query strings (e.g. for template variables) with the following structure:
QUERY API (entity|events|namespaces) [IN NAMESPACE (namespace)[|(namespace)]] SELECT (field-key) [WHERE <FILTER|IN_BROWSER_FILTER> [AND <FILTER|IN_BROWSER_FILTER>]] [LIMIT (limit)]
Note: Query keywords are case sensitive.
Filter: (fieldSelector|labelSelector):(filter-key) (==|!=|in|notin|matches) (field-value)

In-Browser Filter: (field-key) (==|!=|=~|!~|<|>) (field-value)
The data source supports the response filter feature of the Sensu Go backend server. With this filter option, the data is filtered by the Sensu Go server before it is transferred to Grafana, reducing the data to be sent. See the Sensu Go documentation for more details.
Using the "In-Browser" filter option, the data returned by the Sensu Go server can be filtered again. It is important to note that this filtering is done in the browser by Grafana. This means that a lot of data could be transferred before the filters are applied. Furthermore, in combination with a limit, it can lead to misleading results, because only a subset of the data is used. For this reason it is recommended to use the "normal" filter option as far as possible.
You can use IN NAMESPACE with the entity and events APIs to restrict queries to a specified namespace.
When omitted, IN NAMESPACE defaults to the default namespace.
The data source provides support for querying from "all namespaces".
For this purpose, the data source accepts * as namespace name resulting in querying all namespaces.
The following query returns hostnames containing the string webserver within the default namespace:
QUERY API entity SELECT system.hostname WHERE system.hostname=~/webserver/
The following query returns all events with a linux subscription within the default namespace:
QUERY API events SELECT * WHERE fieldSelector:"linux" IN event.check.subscriptions
The following query returns 100 entity hostnames with active, non-OK events within the ops namespace:
QUERY API events IN NAMESPACE ops SELECT entity.system.hostname WHERE check.status>0 LIMIT 100
The following query returns all namespaces with names cotnaing other-:
QUERY API namespaces SELECT name WHERE fieldSelector:namespace.name MATCHES "other-"
The following query returns all entity names across all namespaces:
QUERY API entity IN NAMESPACE * SELECT metadata.name
The following query returns all entity names across all namespaces:
QUERY API entity IN NAMESPACE * SELECT metadata.name
The following query returns the total count of entities in the default and other namespace:
QUERY API entity IN NAMESPACE default|other AGGREGATE count
The following query returns all silenced events for all namespaces:
QUERY API events IN NAMESPACE * SELECT * WHERE fieldSelector:event.check.is_silenced == true
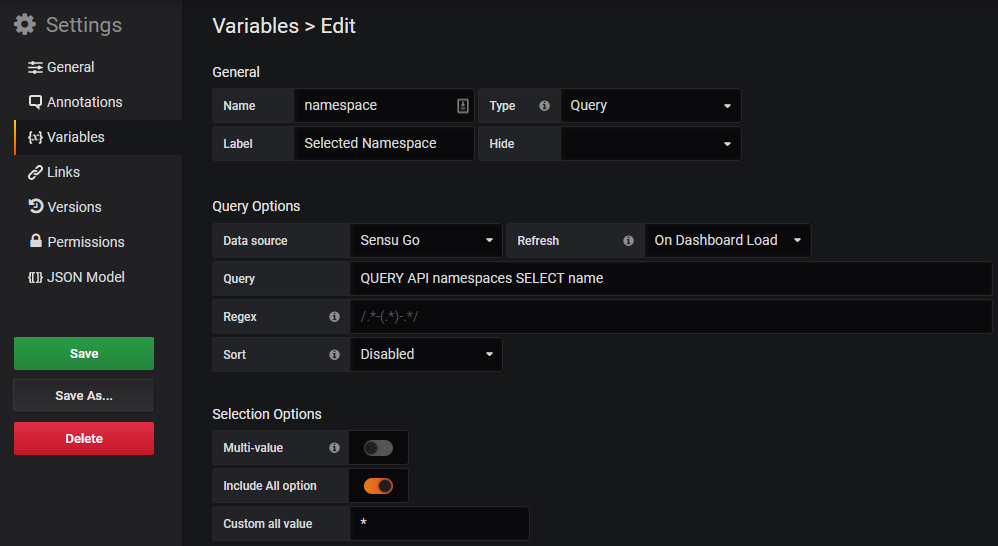
As already mentioned, the data source is able to fetch existing namespaces.
For example, the following query returns all existing namespaces: QUERY API namespaces SELECT name
This is useful in case a template variable should be used to dynamically switch between namespaces.
Since data source version 1.1.0, it is also supported to query all namespaces at once using the data source's special namespace value *.
If it is desired that all namespaces can be queried using a template variable, the variable's "All"-option must be adapted.
This can be achieved by enabling the Include All option option and set the value of the Custom all value option to *.
The data source is able to aggregate the data which is returned by the Sensu Go backend server.
Currently, a count and sum aggregation is supported. The count aggregation counts all elements in the data set, whereas the sum aggregation calculates the sum of a specific attribute.
Note that the aggregation is done in the browser by the data source! In combination with a limit, it can lead to misleading results, because only a subset of the data is used.
Since version 1.1.0 the data source also supports a grouping of the data. Thus an aggregation can be made with respect to a certain attribute. For example, in the following screenshot we get the count of elements in all namespaces, splitted by their entity_class.
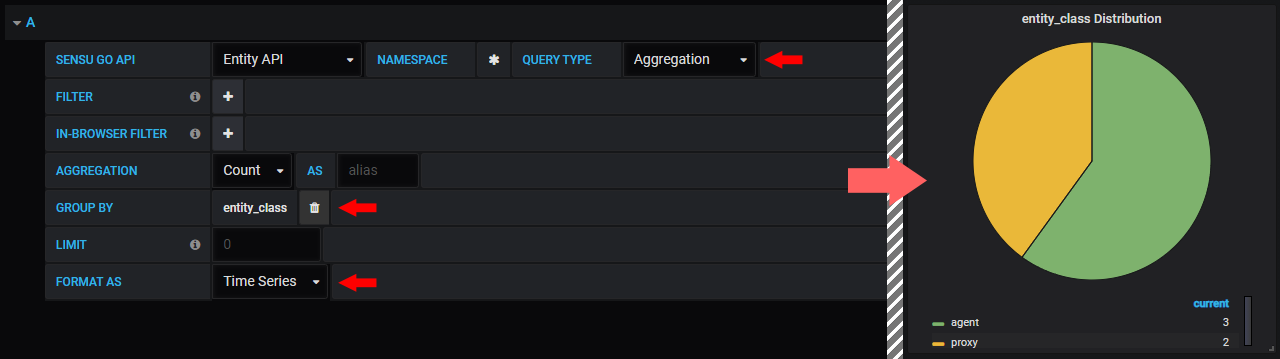
Note that many panels require a time series format.
If you don't want to create your own dashboard or just want to test the data source quickly, you can use one of the sample dashboards. The sample dashboards are located in the "x" folder and can be used with Grafana version 6.0.0 and higher.
Some of the sample dashboards use the pie chart panel, which is only included in Grafana from version 7 on, but can also be installed into an earlier version via the marketplace.
-
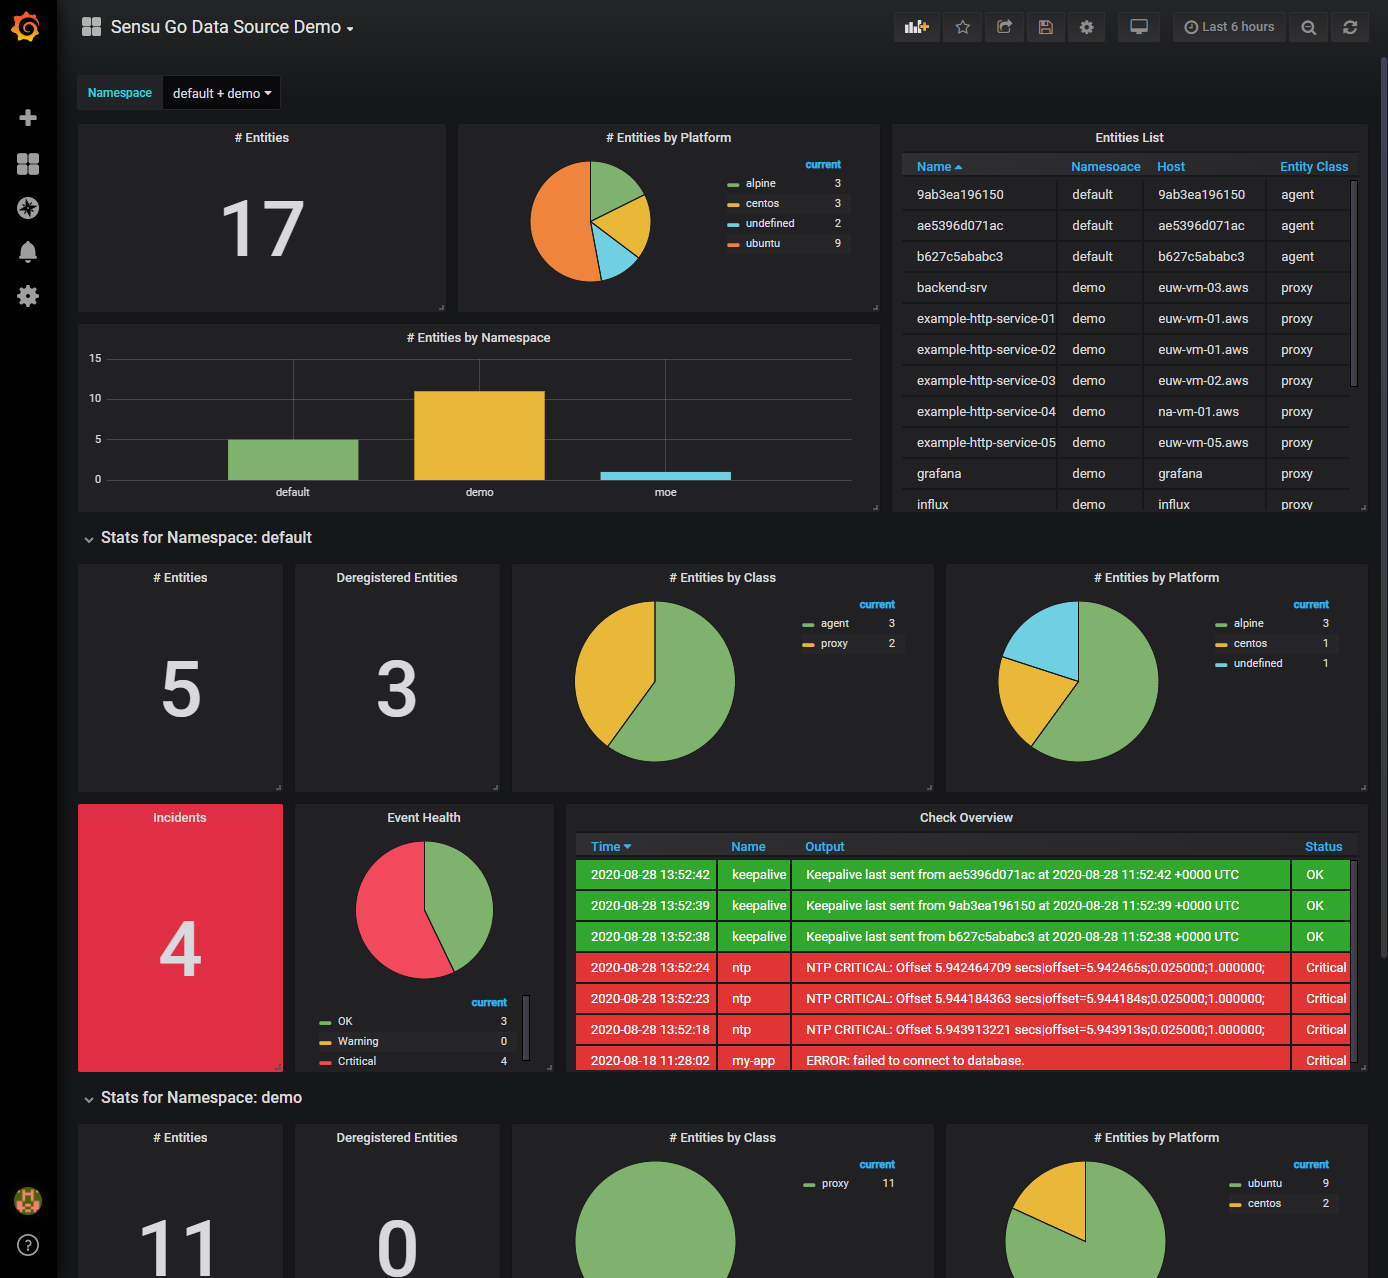
Sample Dashboard 01
-
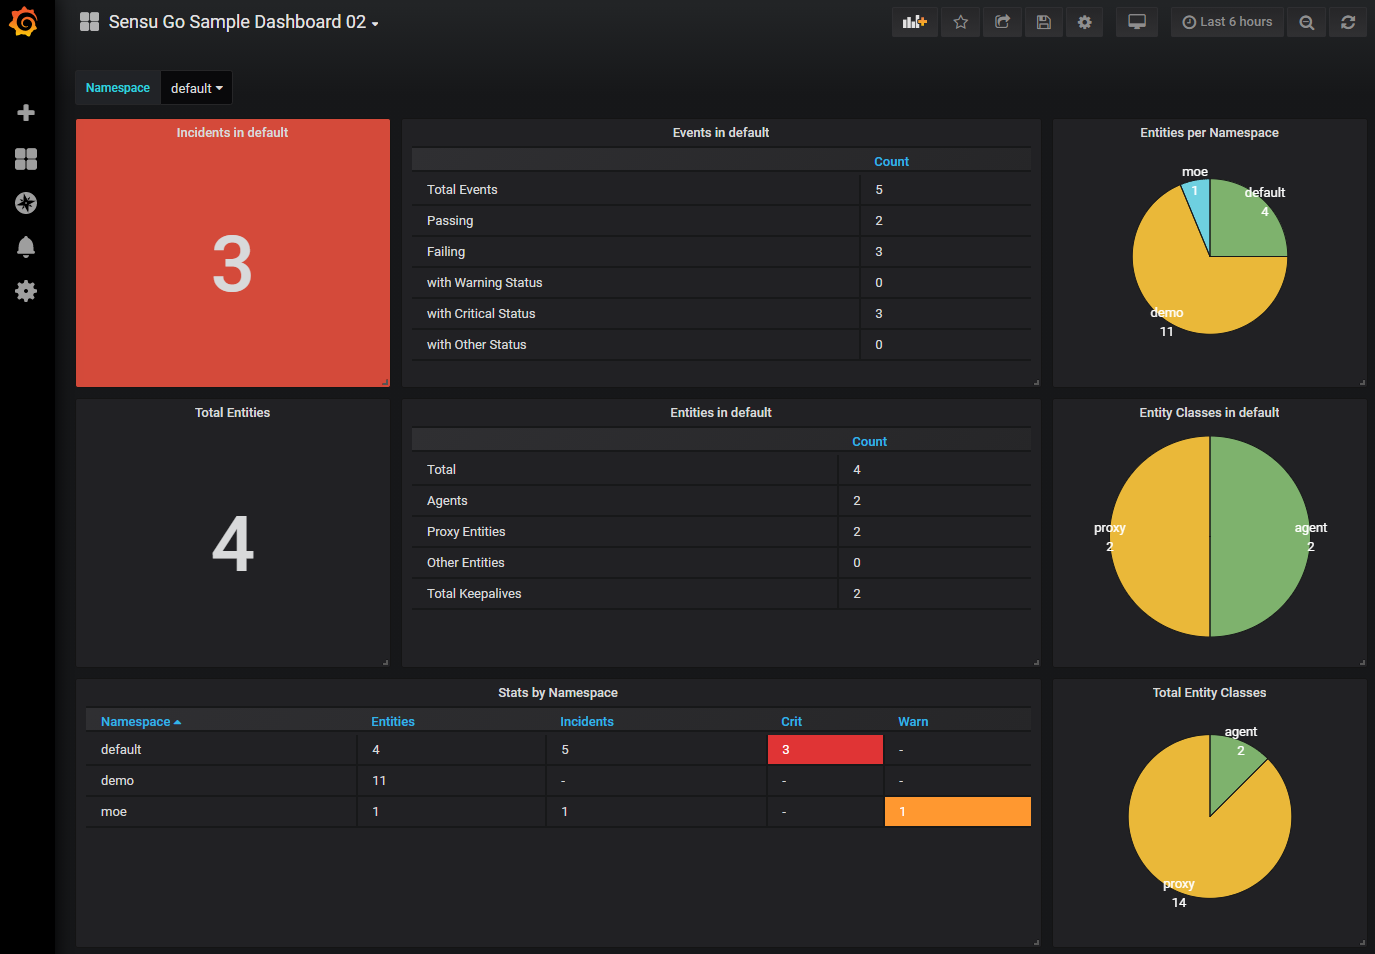
Sample Dashboard 02
-
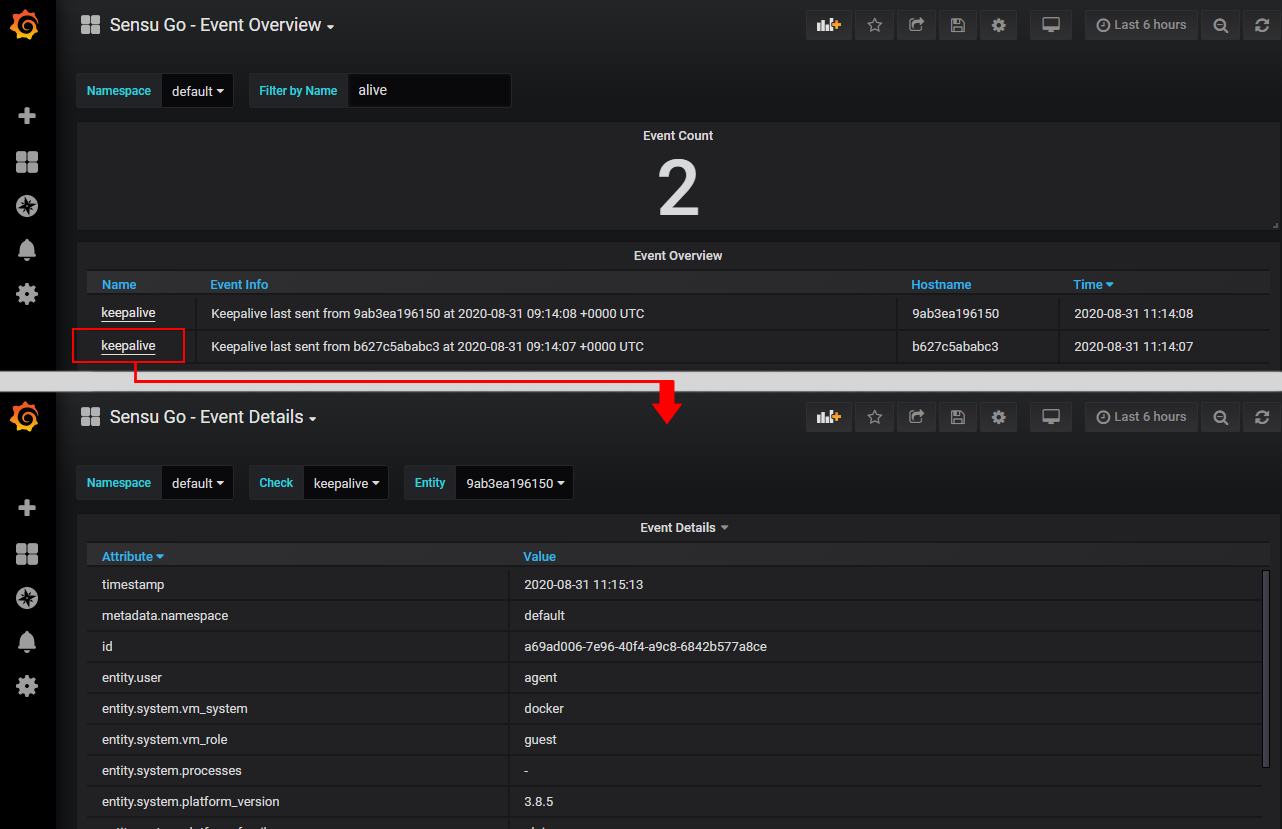
Event Overview & Event Details
These dashboards can be used to visualize events existing in selected namespaces. Furthermore, the dashboards are linked together, thus, from the overview dashboard you can drill down into events and see more information about it. Please note, that the table's link has to be adjusted in case the name or id of the dashboard is changed.
This project requires npm.
To install required dependencies:
npm install
To build the project:
npm run build
You can run npm run watch to start a watch server which rebuilds the source files when a change is detected.
The built files are located in the dist directory.
For an easier development workflow, link the dist directory into Grafana's plugin directory, so Grafana always has the latest version available.
This project uses the release-it plugin to create release bundles: zip archives ready for mounting into Grafana or using in combination with Grafana's provisioning mechanisms.
To create a release bundle, ensure release-it is installed:
npm install --global release-it
To build a release bundle:
release-it [--no-git.requireCleanWorkingDir]
Running release-it creates a releases directory containing the built zip archive.
Please note that this repository contains a built version of the data source in its dist directory which is also a requirement for the Grafana's marketplace. Therefore it is important to keep this folder up to date using the "build" command before committing a change.