These questions are guranteed to be asked in Machine Learning Engineer or ML based interviews for upto 80% of your job interviews. Make sure that you cover and know about machine learning. These questions can Ace your interviews regarding ML even if you are a fresh graduate or upto 5 years of experience.
Helpful for:
-
Machine Learning Engineer
-
Data Scientist
-
Deep Learning Engineer
-
AI Engineer
-
Software Development Engineer (focused on AI/ML)
- Github Profile : Shafaypro ©
- Linkedin Profile : MShafayAmjad
- ML Interview Questions repository : ML interview Repository Link
- The Image references are only for Educational Purposes. These are totally made by the creators, specified in the reference.md file.
Feel Free to Share the Questions/References Link into your blog.
    Supervised learning is when you know the outcome and you are provided with the fully labeled outcome data while in unsupervised you are not
    provided with labeled outcome data. Fully labeled means that each example in the training dataset is tagged with the answer the algorithm should
    come up with on its own. So, a labeled dataset of flower images would tell the model which photos were of roses, daisies and daffodils. When shown
    a new image, the model compares it to the training examples to predict the correct label.

A learning differs from supervised learning in not needing labelled input/output pairs be presented, and in not needing sub-optimal actions to be
explicitly corrected. Instead the focus is on finding a balance between exploration (of uncharted territory) and exploitation (of current
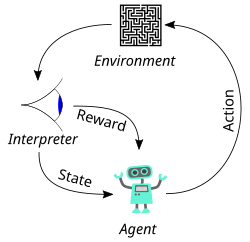
knowledge) .Semisupervised learning is also known as Reinforcment learning, in reinforcment learning each learning steps involved a penalty
criteria whether to give model positive points or negative points and based on that penalizing the model.
    Deep learning is defined as algorithms inspired by the structure and function of the brain called artificial neural networks(ANN).Deep learning
    most probably focuses on Non Linear Analysis and is recommend for Non Linear problems regarding Artificial Intelligence.
    Since DL is a subset of ML and both being subset of AI.While basic machine learning models do become progressively better at whatever their
    function is, they still need some guidance. If an AI algorithm returns an inaccurate prediction, then an engineer has to step in and make
    adjustments. With a deep learning model, an algorithm can determine on its own if a prediction is accurate or not through its own neural network.

    Bias is definned as over simpliciation assumption assumed by the model,
    Variance is definned as ability of a model to learn from Noise as well, making it highly variant.
    There is always a tradeoff between these both, hence its recommended to find a balance between these two and always use cross validation to
    determine the best fit.
    Fitting a Line in the respectable dataset when drawn to a plane, in a way that it actually defines the correlation between your dependent
    variables and your independent variable. Using a simple Line/Slope Formulae. Famously, representing f(X) = M(x) + b.
    Where b represents bias
    X represent the input variable (independent ones)
    f(X) represents Y which is dependent(outcome).

    The working of linear regression is Given a data set of n statistical units, a linear regression model assumes that the relationship between the
    dependent variable y and the p-vector of regressors x is linear. This relationship is modeled through a disturbance term or error variable ε — an
    unobserved random variable that adds "noise" to the linear relationship between the dependent variable and regressors. Thus the model takes the
    form Y = B0 + B1X1 + B2X2 + ..... + BNXN
    This also emplies : Y(i) = X(i) ^ T + B(i)
    Where T : denotes Transpose
    X(i) : denotes input at the I'th record in form of vector
    B(i) : denotes vector B which is bias vector.
    Poisson regression for count data.
    Logistic regression and probit regression for binary data.
    Multinomial logistic regression and multinomial probit regression for categorical data.
    Ordered logit and ordered probit regression for ordinal data.
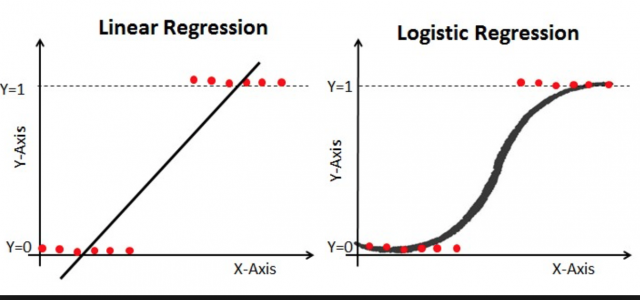
    Logistic regression is a statistical technique used to predict probability of binary response based on one or more independent variables.
    It means that, given a certain factors, logistic regression is used to predict an outcome which has two values such as 0 or 1, pass or fail,
    yes or no etc
    Logistic Regression is used when the dependent variable (target) is categorical.
    For example,
        To predict whether an email is spam (1) or (0)
        Whether the tumor is malignant (1) or not (0)
        Whether the transaction is fraud or not (1 or 0)
    The prediction is based on probabilties of specified classes
    Works the same way as linear regression but uses logit function to scale down the values between 0 and 1 and get the probabilities.
    The sigmoid might be useful if you want to transform a real valued variable into something that represents a probability. While the Logit function
    is to map probaliticvalues from -Inf to +inf to either real numbers representing True or False towards 1 or 0 (real number). This is commonly used
    in Classification having base in  Logistic Regression along with Sigmoid based functions in Deep learning used to find a nominal outcome in a
    layer or output of a layer.
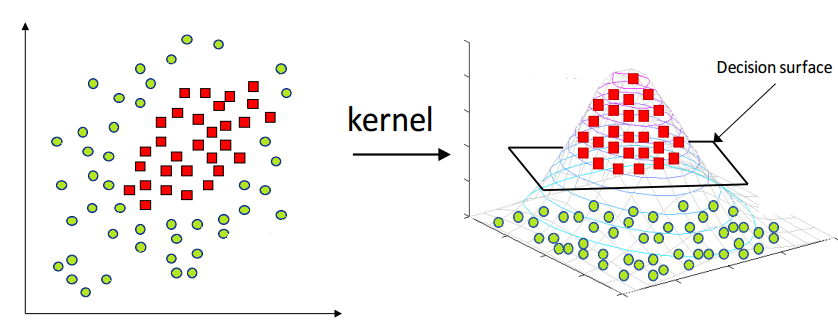
    Support Vector Machine is defineed as a Technique which is classification and regression model. Which uses hyper plan estimation and best hyper plane
    fitting the estimate on linear lines drawn same a linear one. Although it can also work for non Linear using kernal tricks on SVM.
    SVM is totally based on Marginal lines (with difference between two classes in the best way possible).
    One Vs rest is the base classifier concept which is used in all the Ml algorithms which involves classification based on Class A vs Classes REst approach. Since here are only two heuristic approaches which are enhancment of Multiclass classificaton to make the binary classifier perform
    well on multi class problems and solve the problem in hand.

    The algorithms which uses OVO are:
        1) Extreme learning Machines(ELM's)
        2) Support Vector Machine(Classifiers)
        3) K Nearest Neighbours.(for neighbouring classes based on distances)
        4) Naive Bayes (based on MAP : Maximum Posterior )
        5) Decision Trees(decision in subnodes after parent node has one feature)
        6) Neural Networks (different nets)
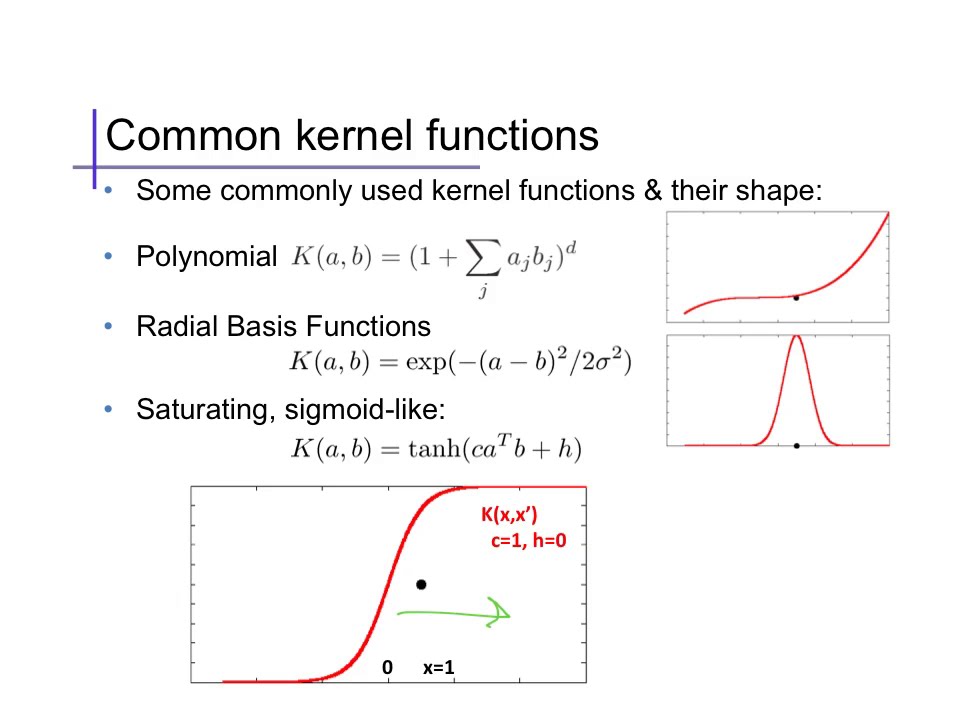
    Think of kernels as definned filters each for their own specific usecases.

    1) Polynomial Kernels (used for image processing)
    2) Gaussian Kernel (When there is no prior knowledge for data)
    3) Gaussian Radial Basis Function(same as 2)
    4) Laplace RBF Kernel ( recommend for higher training set more than million)
    5) Hyperbolic Tangent Kernel (neural network based kernel)
    6) Sigmoid Kernel(proxy for Neural network)
    7) Anova Radial Basis Kernel (for Regression Problems)
    There are multiple evaluation metrics for Regression Analysis
    1) Mean Squared Error ( the average squared difference between the estimated values and the actual value)
    2) Mean Absolute Error (Absolute of the Average difference)

    MAE : Use MAE when you are doing regression and don’t want outliers to play a big role. It can also be useful if you know that your distribution is multimodal, and it’s desirable to have predictions at one of the modes, rather than at the mean of them.
    MSE : use MSE the other way around, when you want to punish the outliers.
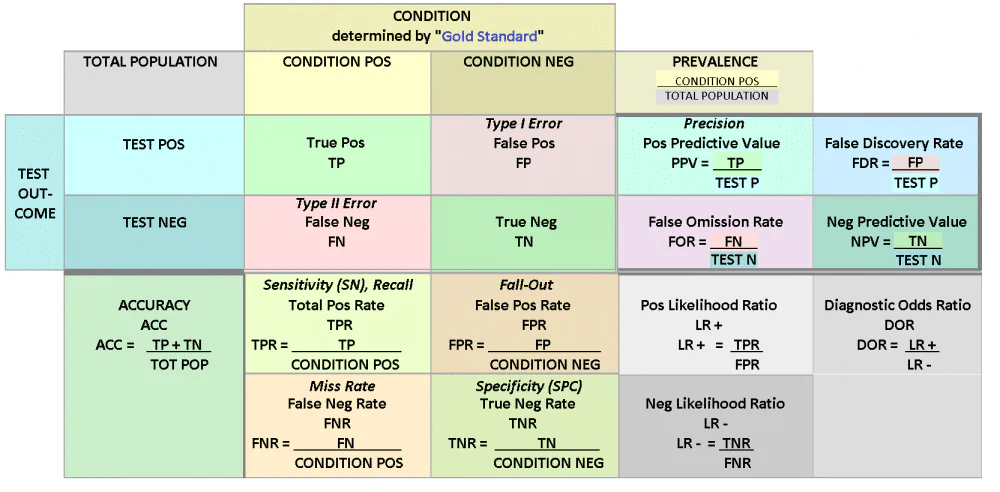
A classifier can be evaluated through multiple case, having the base case around its confusion metrics and its attributes which are TP, TN , FP and FN. Along with the Accuracy metrics which can be derived alongside Precision, Recall scores.
    Classification is defined as categorizing classes or entities based on the specified categories either that category exists or not in the respectable data. The concept is quite common for Image based classification or Data Based Classification. The answer in form of Yes or No;
    alongside answers in form of types of objects/classes.
    A multiclass defines as a classification outcome which can be of multiple classes either A or B or C but not   two or more than one.
    While in MultiLabel classification, An outcome can be of either one or more than two classes i.e A or A and B or A and B and C.

    A confusion matrix, also known as an error matrix, is a specific table layout that allows visualization of
     the performance of an algorithm, typically a supervised learning one (in unsupervised learning it is
      usually called a matching matrix). Each row of the matrix represents the instances in a predicted class
       while each column represents the instances in an actual class (or vice versa).
    The name stems from the fact that it makes it easy to see if the system is confusing two classes
    (i.e. commonly mislabeling one as another).
    Bias is the simplifying assumptions made by the model to make the target function easier to approximate.
    1) High bias algorithms are most probably Linear Algorithm, which are concerned with linear relationships or linear distancing. Examples are
    2) Linear, Logistic or Linear Discrimenant Analysis.
    Variance is the amount that the estimate of the target function will change given different training data

    1) High Variance Algorithms are Decision Trees, K Nearest Neigbours and SVMs
    2) Low Variance Algorithms are Linear Regression, Logistic Regression and LDA's
    Linear machine learning algorithms often have a high bias but a low variance.
    Nonlinear machine learning algorithms often have a low bias but a high variance.
    Possible root causes of prediction bias are:

    1) Incomplete feature set
    2) Noisy data set
    3) Buggy pipeline
    4) Biased training sample
    5) Overly strong regularization
    Gradient Descent is an iterative method to solve the optimization problem. There is no concept of "epoch" or "batch" in classical gradient decent. The key of gradient decent are
    * Update the weights by the gradient direction.
    * The gradient is calculated precisely from all the data points.
    Stochastic Gradient Descent can be explained as:
    * Quick and dirty way to "approximate gradient" from one single data point.
    * If we relax on this "one single data point" to "a subset of data", then the concepts of batch and epoch come.

A decision tree is a decision support tool that uses a tree-like model of decisions and their possible consequences, including chance event
outcomes, resource costs, and utility. It is one way to display an algorithm that only contains conditional control statements.
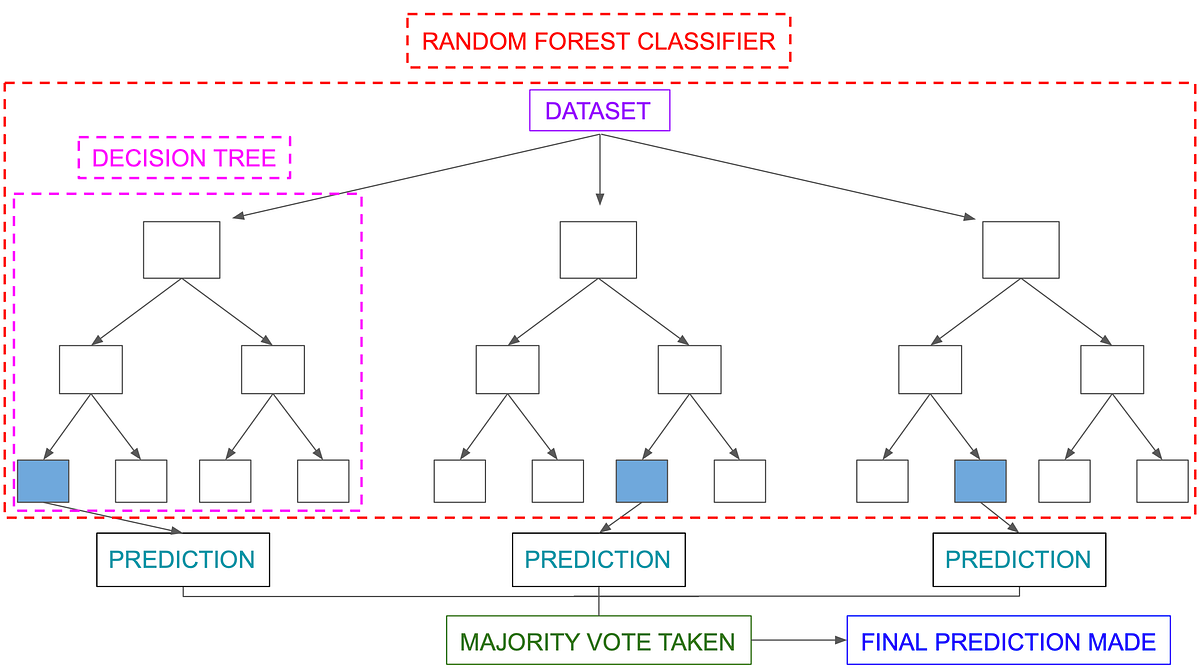
Random forests or random decision forests are an ensemble learning method for classification, regression and other tasks that operate by
constructing a multitude of decision trees at training time and outputting the class that is the mode of the classes (classification) or mean
prediction (regression) of the individual trees. Used to remove the Overfitting occured due to single Decision Trees.
Splitting up your data in to subsets based on provided data facts. (can come in handy for decision Trees)
    The Shortening of branches of Decision Trees is termed as Prunning. The process is done in case to reach the decision quite earlier than
    expected. Reducing the size of the tree by turning some branch nodes into leaf nodes, and removing the leaf nodes under the original branch.
    Tree selection is mainly done from the following
    1) Entropy
            A decision tree is built top-down from a root node and involves partitioning the data into subsets that contain instances with similar
            values (homogeneous). ID 3 algorithm uses entropy to calculate the homogeneity of a sample. If the sample is completely homogeneous the
            entropy is zero and if the sample is an equally divided it has entropy of one.
            Entropy(x) -> -p log(p) - qlog(q)  with log of base 2
    2) Information Gain
            The information gain is based on the decrease in entropy after a dataset is split on an attribute. Constructing a decision tree is all about finding attribute that returns the highest information gain (i.e., the most homogeneous branches).

            2.1) Calculate entropy of the target.
            2.2) The dataset is then split on the different attributes. The entropy for each branch is calculated. Then it is added proportionally, to get total entropy for the split. The resulting entropy is subtracted from the entropy before the split. The result is the Information Gain, or decrease in entropy.
            2.3) Choose attribute with the largest information gain as the decision node, divide the dataset by its branches and repeat the same process on every branch.
    '''
    from math import log

    def calculateEntropy(dataSet):
    number = len(dataSet)
    labelCounts = {}
    for featureVector in dataSet:
        currentLabel = featureVector[-1]
        if currentLabel not in labelCounts.keys():
        labelCounts[currentLabel] = 0
        labelCounts[currentLabel] +=1
    entropy = 0
    for i in labelCounts:
        probability = float(labelCounts[keys])/number
        entropy -=probability*log(probability,2)
    return entropy
    '''
    -* Decision Tree *- A Simple Tree compromising of the process defined in selection of Trees.
    -* RandomForest *- Combination of Multiple N number of Decision Trees and using the aggregation to determine the final outcome.
    The classifier outcome is based on Voting of each tree within random forest while in case of regression it is based on the
    averaging of the tree outcome.
    The Gini Index is calculated by subtracting the sum of the squared probabilities of each class from one. It favors larger partitions.
    Imagine, you want to draw a decision tree and wants to decide which feature/column you should use for your first split?, this is probably defined
    by your gini index.
    Gini Index:
    for each branch in split:
        Calculate percent branch represents .Used for weighting
        for each class in branch:
            Calculate probability of class in the given branch.
            Square the class probability.
        Sum the squared class probabilities.
        Subtract the sum from 1. #This is the Ginin Index for branch
    Weight each branch based on the baseline probability.
    Sum the weighted gini index for each split.
    Favors larger partitions.
    Uses squared proportion of classes.
    Perfectly classified, Gini Index would be zero.
    Evenly distributed would be 1 – (1/# Classes).
    You want a variable split that has a low Gini Index.
    The algorithm works as 1 – ( P(class1)^2 + P(class2)^2 + … + P(classN)^2)
    Probability defines the percentage of Succes occured. or Success of an event. Can be described Chance of having an event is 70% or etc.
    We suppose that the event that we get the face of coin in success, so the probability of success now is 0.5 because the probability of face and back of a coin is equal. 0.5 is the probability of a success.

    Likelihood is the conditional probability. The same example, we toss the coin 10 times ,and we suppose that we get 7 success ( show the face) and
    3 failed ( show the back). The likelihood is calculated (for binomial distribution, it can be vary depend on the distributions).


    Likelihood(Event(success)) - > L(0.5|7)= 10C7 * 0.5^7 * (1-0.5)^3 = 0.1171

    L(0.5 | 7) : means event likelihood of back( given number of successes)
    10C7 -> Combination based on total 10 Events, and having the success outcome be 7 events
    In general:
        Event(X | Y)  -> C(Total Event| Success Event) * [(Prob of X) ^ (Success Event X)] * [(1 - Prob of X) ^ (1 - Success Event X)]
    Entropy: Randomness of information being processed.

    Information Gain multiplies the probability of the class times the log (base=2) of that class probability.  Information Gain favors smaller partitions with many distinct values.  Ultimately, you have to experiment with your data and the splitting criterion.
    IG depends on Entropy Change (decrease represent increase in IG)
Kullback-Leibler divergence calculates a score that measures the divergence of one probability distribution from another

    Entropy: Randomness of information being processed.

    Cross Entropy: A measure from the field of information theory, building upon entropy and generally calculating the difference between two
    probability distributions. It is closely related to but is different from KL divergence that calculates the relative entropy between two
    probability distributions, whereas cross-entropy can be thought to calculate the total entropy between the distributions.

    Cross-entropy can be calculated using the probabilities of the events from P and Q, as follows:
            H(P, Q) = – sum x in X P(x) * log(Q(x))
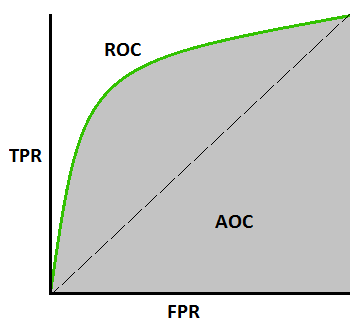
    ROC is a probability curve and AUC represents degree or measure of separability. AUC - ROC curve is a performance measurement for classification problem at various thresholds settings.

    It tells how much model is capable of distinguishing between classes. Mainly used in classification problems for measure at different thresholds.
    Higher the AUC, better the model is at predicting 0s as 0s and 1s as 1s. By analogy, Higher the AUC, better the model is at distinguishing between patients with disease and no disease.
    False positive : A false positive is an outcome where the model incorrectly predicts the positive class.(was A but got predicted B) aka Type I error.

    False Negative : A false negative is an outcome where the model incorrectly predicts the negative class. (was not A but predicted A) aka Type II error.
    Take a simple Classification example of "Classifying email messages as spam or not spam"

    Precision measures the percentage of emails flagged as spam that were correctly classified—that is, the percentage of dots to the right of the threshold line, it is also defined as % of event being Called at positive rates e.g
            Precision = True Positive / (True Positive + False positive)

    Recall measures the percentage of actual spam emails that were correctly classified
            Recall = True Postives / (True Positive + False Negative)

    There is always a tradeoff between precision and Recall same is the case of Bias and Variance.
    This totally depends on Business Usecase or SME usecase. In case of Fraud Detection Business domains such as banks, online ecommerce websites
    recommends of better recall score than precision. While in other cases such as word suggestions or Multi label Categorization it can be precision.
    In general, totally dependent on your use case.
    The F1 score is the harmonic mean of the precision and recall, where an F1 score reaches its best value at 1 (perfect precision and recall).
    Also known as Dice Similarity Coefficent.

    David (Scientist Statistician): The widespread use of the F1 score since it gives equal importance to precision and recall. In practice, different types of mis-classifications incur different costs. In other words, the relative importance of precision and recall is an aspect of the problem
    The major practical difference between a (kernel) perceptron and SVM is that perceptrons can be trained online (i.e. their weights can be updated
    as new examples arrive one at a time) whereas SVMs cannot be. Perceptron is no more than hinge loss (loss function) + stochastic gradient descent (optimization).

    SVM has almost the same goal as L2-regularized perceptron.
    SVM can be seen as hinge loss + l2 regularization (loss + regularization) + quadratic programming or other fancier optimization algorithms like SMO (optimization).
    LogR is Classifier, LR is Regression.
    LogR values are between 0 and 1 and probabilty in between as well.
    LR values are in realnumbers from 1 to postive N (where N is known)
An outlier is an observation that lies an abnormal distance from other values in a random sample from a population.

    Outliers can be removed by following:
        1) Use Inter Quantile Range (IQR * 1.5)
        2) Use Z-score Scale removal (so that any point much away from mean gets removed)
        3) Combination of Z Score and IQR (custom scores)
    Regularizations are techniques used to reduce the error by fitting a function appropriately on the given training set and avoid overfitting.
    Add Lambda * Biasness value at the end.
    1) L1 Regulization (Lasso Regression)
        (Least Absolute Shrinkage and Selection Operator) adds “absolute value of magnitude” of coefficient as penalty term to the loss function.

    2) L2 Regulization (Ridge Regression)
        (adds “squared magnitude” of coefficient as penalty term to the loss function. Here the highlighted part represents L2 regularization element.)

    The key difference between these techniques is that Lasso shrinks the less important feature’s coefficient to zero thus, removing some feature
    altogether. So, this works well for feature selection in case we have a huge number of features.
    Data Sampling statistical analysis technique used to select, manipulate and analyze a representative subset of data points to identify patterns and trends in the larger data set being examined.
    There are different techniques of sampling your data
    1) Simple Random Sampling (records are picked at random)
    2) Stratified Sampling (subsets based on common factor with equal ratio distribution)
    3) Cluster Sampling (largest set is breaken down in form of clusters based on defined factors and SRS is applied)
    4) MultiStage Sampling (cluster on Cluster sampling)
    5) Symentaic Sampling (Sample created by setting interval)
    Undersampling is the concept of downsizing the class based sample from a Bigger range to smaller range i.e 1Million records to 0.1 Million records,
    keeping the ratio of information intact

    Oversampling represents the concept of using a smaller class sample i.e 100K to scale upto million keeping the trend and the property to make up
    datasets.
    Imbalancment is when you don't have balance in between classes.
    Imabalnced class is when the normal distribution/support count of multiple classes or classes being considered are not the same or almost same.
    E.G:
        Class A has 1 Million Record
        Class B has 1000 Record
    This is imbalanced data set and Class B is UnderBalanced Class.
    The techniques such as
        1) OverSampling
        2) UnderSampling
        3) Smote combination of both
        4) bringing in more dataset
        5) doing more trend analysis
    can resolve the issue of Imbalancment dataset
    A incremental increase of Moving Average having a Weighted Multiple to keep the values which gets repeated during a certain time with High
    priority/ Impact.
    A Regressive and Moving Average Model combination is termed as ARIMA. To be exact, Auto Regressive Intergerated Moving Avearges.
    A techniques which does regression analysis along with moving averages which fits time series analysis and gets trend analysis with
    acceptable scores.
    Bagging : A way to decrease the variance in the prediction by generating additional data for training from dataset using combinations with repetitions to produce multi-sets of the original data.
            Example : Random Forest  (uses random Sampling subsets)
    Boosting: An iterative technique which adjusts the weight of an observation based on the last classification
            Example: AdaBoost, XGboost  (using gradient descent as main method)
    IQR is interquantile range which specifies the range between your third quantile and the first one.
    Quantile are 4 points of your data represented by percentage(should be four equal parts )
        Q1: 0-25%
        Q2: 25-50%
        Q3: 50-75%
        Q4: 75- 100%
    IQR :- Q3 - Q1
    Synthetic Minority Over-sampling TEchnique also known as SMOTE.
    A very popular oversampling method that was proposed to improve random oversampling but
    its behavior on high-dimensional data has not been thoroughly investigated.
    KNN algorithm gets benefits from SMOTE.
    Underfitting
        1) Increase complexity of model
        2) Increasing training time
        3) decrease learning rate
    Overfitting:
        1) Cross Validation
        2) Early Stops
        3) increased learning rates(hops)
        4) Ensembling
        5) Bring in More data
        6) Remove Features
    1) Cross Validation
    2) Early Stops
    3) increased learning rates(hops)
    4) Ensembling
    5) Bring in More data
    6) Remove Features
    A "neuron" in an artificial neural network is a mathematical approximation of a biological neuron.
    It takes a vector of inputs, performs a transformation on them, and outputs a single scalar value.
     It can be thought of as a filter. Typically we use nonlinear filters in neural networks.
What are Hidden Layers and Input layer?

    1) Input Layer: Initial input for your neural network
    2) Hiddent layers: a hidden layer is located between the input and output of the algorithm,
    in which the function applies weights to the inputs and directs them through an activation function as the output.
    In short, the hidden layers perform nonlinear transformations of the inputs entered into the network.
    Hidden layers vary depending on the function of the neural network, and similarly, the layers may vary depending
    on their associated weights.
    Output layer in ANN determines the final layer which is responsible for the final outcome, the outcome totally depends
    on the usecase provided and the function which is being used to scale the values. By default, Linear, Sigmoid and Relu are
    most common choices.
    Linear for Regression.
    Sigmoid/Softmax for Classification.
    Activation functions perform a transformation on the input received, in order to keep values within a manageable range depending
    on the limitation of the activation function. Its more of a mathematical scale filter applied to a complete layer (Vector)
    to scale out values.
    Some common examples for AF are:
        1) Sigmoid or SoftMax Function (has Vanish Gradient problem)
            Softmax outputs produce a vector that is non-negative and sums to 1. It's useful when you have mutually exclusive categories
            ("these images only contain cats or dogs, not both"). You can use softmax if you have 2,3,4,5,... mutually exclusive labels.

        2) Tanh function (has Vanish Garident problem)
            if the outputs are somehow constrained to lie in [−1,1], tanh could make sense.
        3) Relu Function
            ReLU units or similar variants can be helpful when the output is bounded above or below.
            If the output is only restricted to be non-negative, it would make sense to use a ReLU
            activation as the output function. (0 to Max(x))

        4) Leaky Relu Function (to fix the dying relu problem in the Relu function within hidden layers)
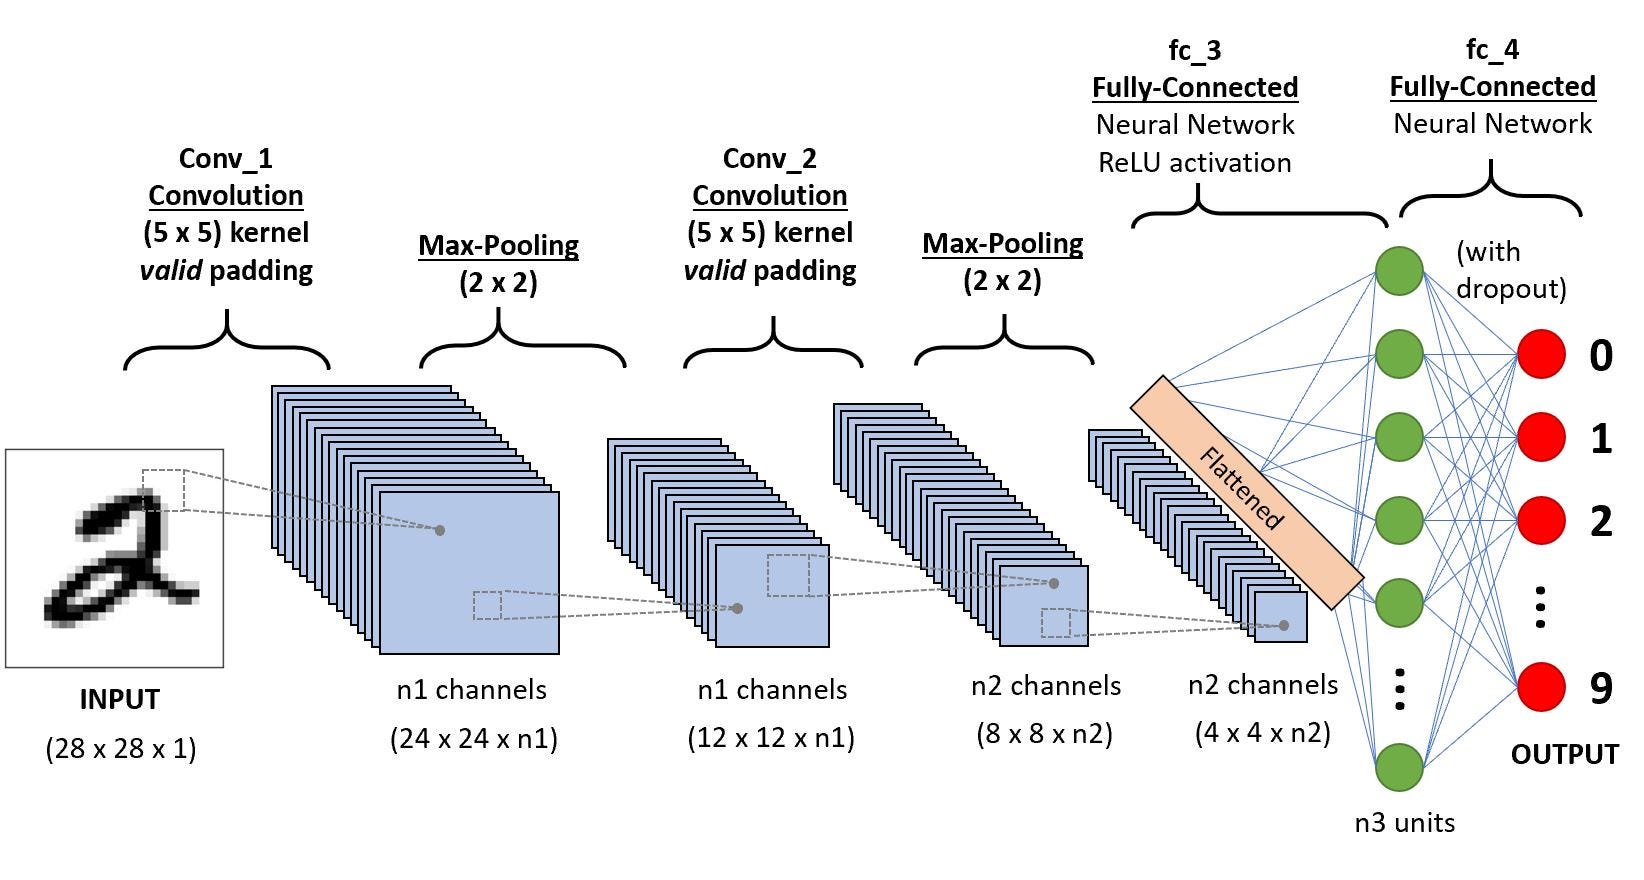
    convolutional-neural-network is a subclass of neural-networks which have at least one convolution layer.
    They are great for capturing local information (e.g. neighbor pixels in an image or surrounding words in a text)
    as well as reducing the complexity of the model (faster training, needs fewer samples, reduces the chance of overfitting).
    . A convolution unit receives its input from multiple units from the previous layer which together create a proximity.
    Therefore, the input units (that form a small neighborhood) share their weights.
    A class of artificial neural networks where connections between nodes form a directed graph along a temporal sequence.
    This allows it to exhibit temporal dynamic behavior. Derived from feedforward neural networks, RNNs can use their
    internal state (memory) to process variable length sequences of inputs. This makes them applicable to tasks such
    as unsegmented, connected handwriting recognition or speech recognition.

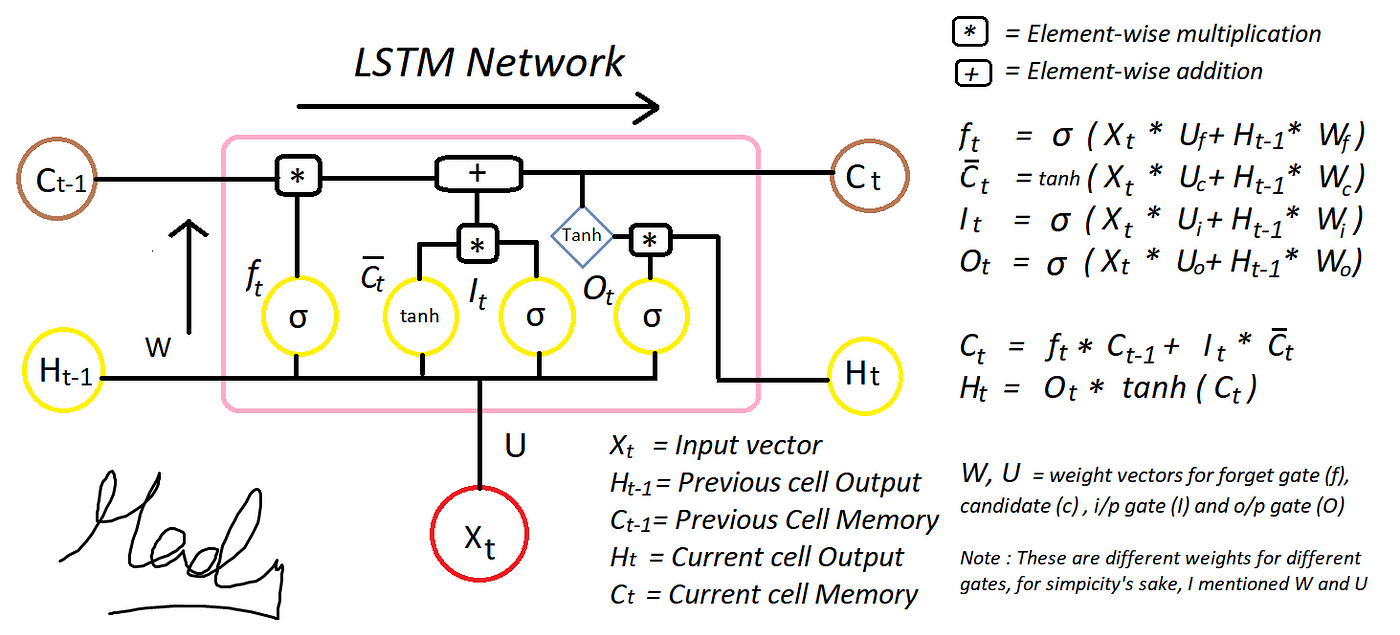
    Long short-term memory (LSTM) is an artificial recurrent neural network (RNN) architecture.
    Unlike standard feedforward neural networks, LSTM has feedback connections. It can not only process single
    data points (such as images), but also entire sequences of data (such as speech or video).
    For example, LSTM is applicable to tasks such as unsegmented, connected handwriting recognition, Anomly detection in network
    traffic or IDS.
    A convolution is the simple application of a filter to an input that results in an activation. Repeated application of the
    same filter to an input results in a map of activations called a feature map, indicating the locations and strength of a
    detected feature in an input, such as an image.
    You can use Filters which are based on Horizental Lines or Verticial Lines or Gray Scale conversion or other conversion filters.

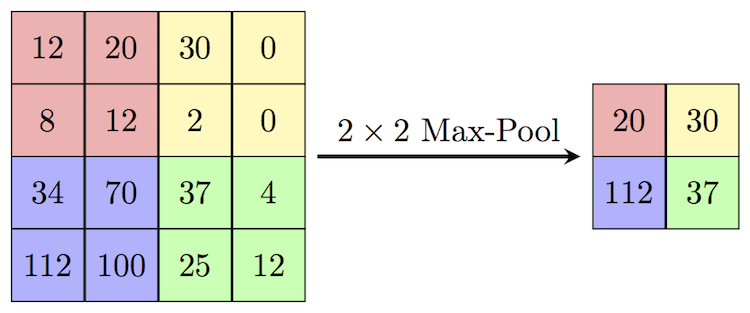
    Pooling layers provide an approach to down sampling feature maps by summarizing the presence of features in patches of the feature map.
    Two common pooling methods are average pooling and max pooling that summarize the average presence of a feature and the most activated
    presence of a feature respectively.

    This is required to downsize your feature scale (e.g You have detected vertical lines, now remove some of the feature to go in grain)

Max polling uses the Maximum value found in a considered size metrics. Maximum pooling, or max pooling, is a pooling operation that calculates the maximum, or largest, value in each patch of each feature map.in a way.
    kernel methods are a class of algorithms for pattern analysis, whose best known member is the support vector machine (SVM)
    Kernel functions have been introduced for sequence data, graphs, text, images, as well as vectors.
    A Kernel is used to solve Non- Linear problem by Linear Classifiers in a way that its useable.
    The process of partitioning a digital source into multiple segments.
    If you refer Image, Imagine Image source being converted into multiple segments such as Airplane object.
    The goal of segmentation is to simplify and/or change the representation of an image into something that
     is more meaningful and easier to analyze.
Detection of poster from an Image is represented as Post Estimation.
    The input data is fed in the forward direction through the network. Each hidden layer accepts the input data,
    processes it as per the activation function and passes to the successive layer.
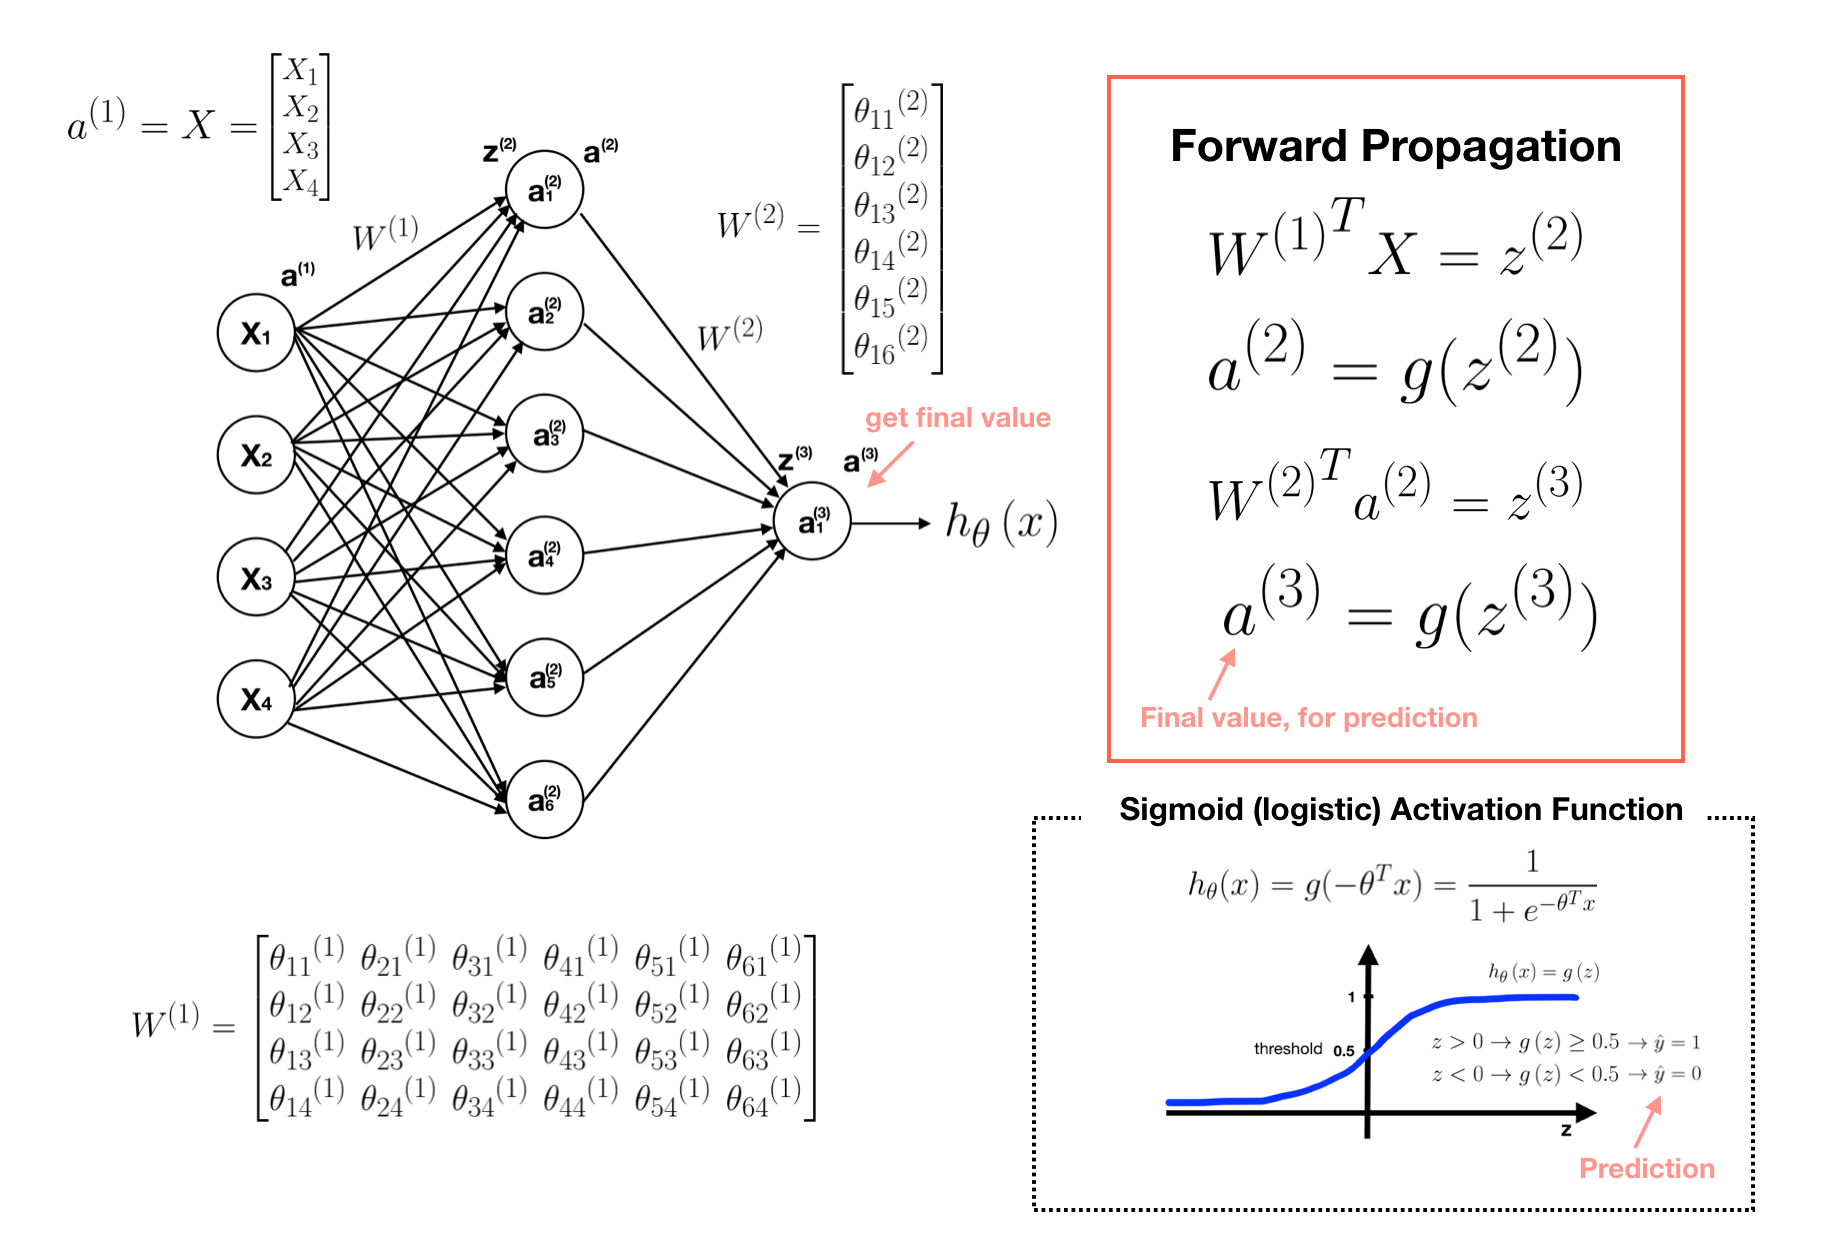
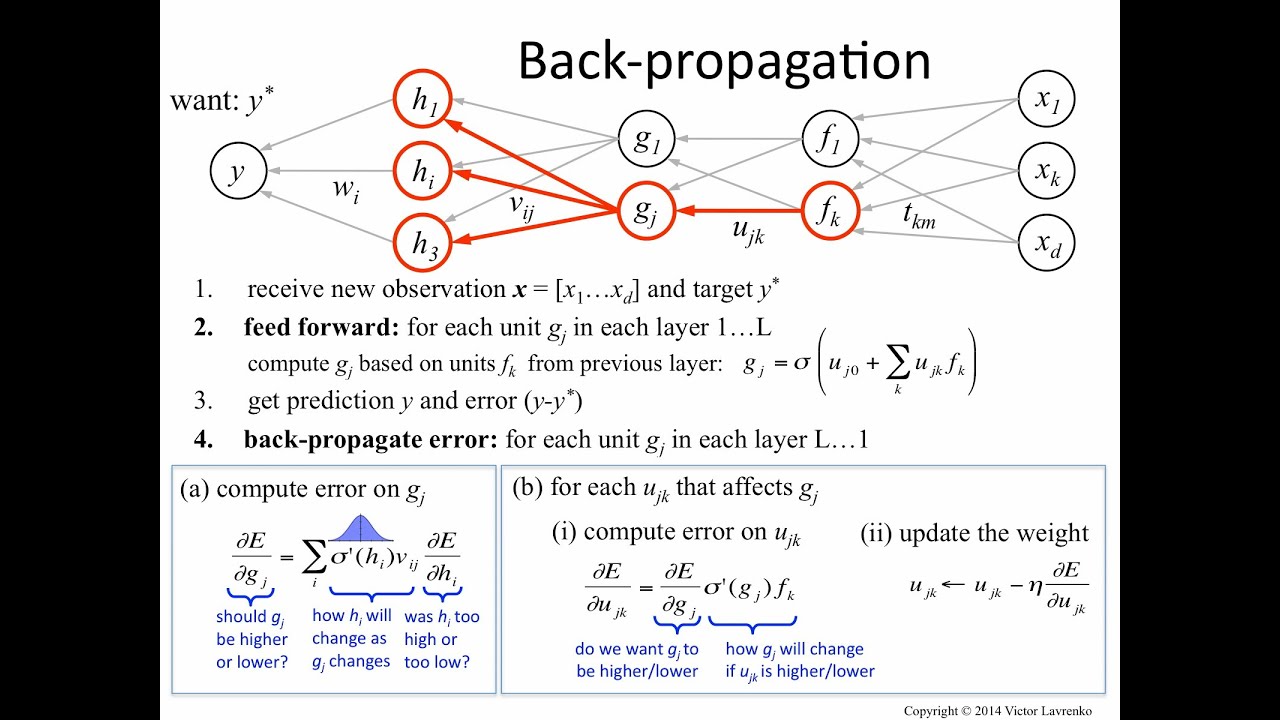
    Back-propagation is the essence of neural net training. It is the practice of fine-tuning the weights
    of a neural net based on the error rate (i.e. loss) obtained in the previous epoch (i.e. iteration).
    Proper tuning of the weights ensures lower error rates, making the model reliable by increasing its generalization
    The term “dropout” refers to dropping out units (both hidden and visible) in a neural network.
    Simply put, dropout refers to ignoring units (i.e. neurons) during the training phase of certain
    set of neurons which is chosen at random. By “ignoring”, I mean these units are not considered during
    a particular forward or backward pass.
    More technically, At each training stage, individual nodes are either dropped out of the net with
    probability 1-p or kept with probability p, so that a reduced network is left; incoming and
    outgoing edges to a dropped-out node are also removed.
    A flatten layer collapses the spatial dimensions of the input into the channel dimension.
    For example, if the input to the layer is an H-by-W-by-C-by-N-by-S array (sequences of images),
    then the flattened output is an (H*W*C)-by-N-by-S array.
    practice of fine-tuning the weights of a neural net based on the error rate (i.e. loss)
    obtained in the previous epoch (i.e. iteration). Proper tuning of the weights ensures lower error rates,
    making the model reliable by increasing its generalization
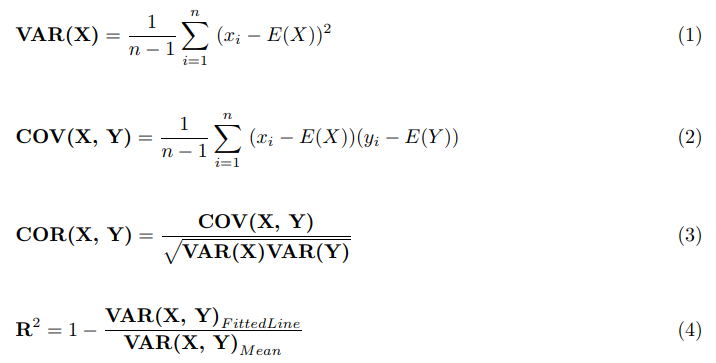
    “Covariance” indicates the direction of the linear relationship between variables.
    “Correlation” on the other hand measures both the strength and direction of the linear relationship between two variables.

    When comparing data samples from different populations, covariance is used to determine how much two random variables
    vary together, whereas correlation is used to determine when a change in one variable can result in a change in another.
    Both covariance and correlation measure linear relationships between variables.
    Analysis of variance (ANOVA) is a collection of statistical models and their associated estimation procedures
    (such as the "variation" among and between groups) used to analyze the differences among group means in a sample.

    Use a one-way ANOVA when you have collected data about one categorical independent variable and
    one quantitative dependent variable. The independent variable should have at least three levels
     (i.e. at least three different groups or categories)
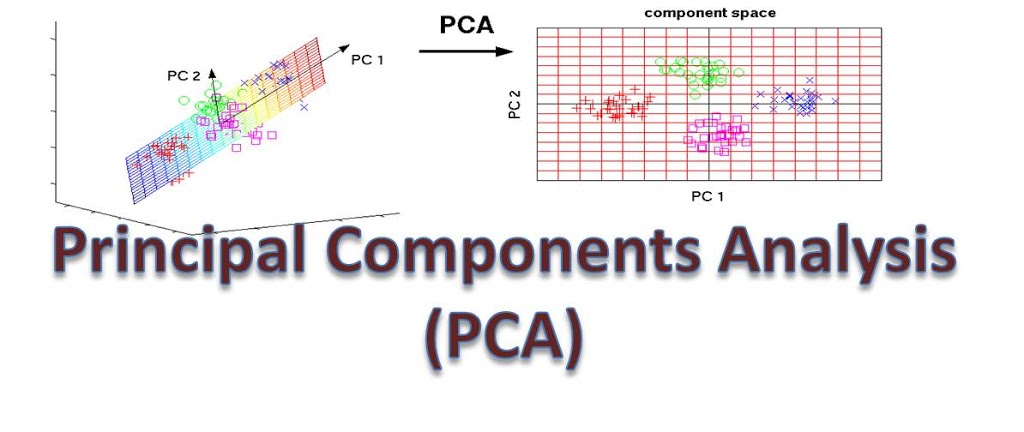
    Dimensionality reduction or dimension reduction is the process of reducing the number of random variables
    under consideration by obtaining a set of principal variables. Approaches can be divided into feature
    selection and feature extraction.
    The reason we use it is because
            1) Immensive dataset
            2) Longer Trainnig time/gathering time
            3) Too much complex assumptions/ Model overfitting
    Types of Dimentionality reductions are
            1) Feature Selection
            2) Feature Projection( transform data from higher dimention to lower space of fewer dimention)
            3) Principle component Analysis
                    Linear Technique for DR, performs linear mapping of data to lower dimention
                    space in such a way variance is maximized.
            4) Non Negative Metrics Factorization
            5) Kernel PCA ( Non linear way of utilization of Kernel Trick)
            6) Graph Based Kernel PCA ( locally linear embedding, Eigen Embeddings)

            7) Linear Discrimenant Analysis
                    A method used in statistics, pattern recognition and machine learning to find a
                    linear combination of features that characterizes or separates two or more
                    classes of objects or events.
            8) Generalized Discrimenant Analysis
            8) TSNE (is a non-linear dimensionality reduction technique useful for visualization of high-dimensional datasets.)
            9) U-Map
                    Uniform manifold approximation and projection (UMAP) is a nonlinear dimensionality reduction technique.
                    Visually, it is similar to t-SNE, but it assumes that the data is uniformly distributed on a locally
                    connected Riemannian manifold and that the Riemannian metric
                    is locally constant or approximately locally constant.
            10) Autoencoders (can learn from Non Linear dimention reduction function)
    The main linear technique for dimensionality reduction, principal component analysis, performs
     a linear mapping of the data to a lower-dimensional space in such a way that the variance of
     the data in the low-dimensional representation is maximized. In practice, the covariance (and
     sometimes the correlation) matrix of the data is constructed and the eigenvectors on this
     matrix are computed. The eigenvectors that correspond to the largest eigenvalues (the
     principal components) can now be used to reconstruct a large fraction of the variance of the
     original data. The original space (with dimension of the number of points) has been reduced
     (with data loss, but hopefully retaining the most important variance) to the space spanned by
     a few eigenvectors
    Maximum likelihood estimation is a method that determines values for the parameters of a model.
    The parameter values are found such that they maximise the likelihood that the process described by the model
    produced the data that were actually observed.
    A method of estimating the parameters of a probability distribution by maximizing a likelihood function,
    so that under the assumed statistical model the observed data is most probable


The probability of an event, based on prior knowledge of conditions that might be related to the event.
    Probability is a number between 0 and 1, where, roughly speaking, 0 indicates impossibility and 1 indicates certainty.
    The higher the probability of an event, the more likely it is that the event will occur.
    Example:
    A simple example is the tossing of a fair (unbiased)
    coin. Since the coin is fair, the two outcomes ("heads" and "tails") are both equally probable; the probability of "heads" equals the probability
    of "tails"; and since no other outcomes are possible, the probability of either "heads" or "tails" is 1/2 (which could also be written as 0.5 or
    50%).
    Joint probability is a statistical measure that calculates the likelihood of two events occurring together and at the same point in time.
            P(A and B) or P (A ^ B) or P(A & B)
            The joint probability is detremeinded as :
            P(A and B) = P(A given B) * P(B)
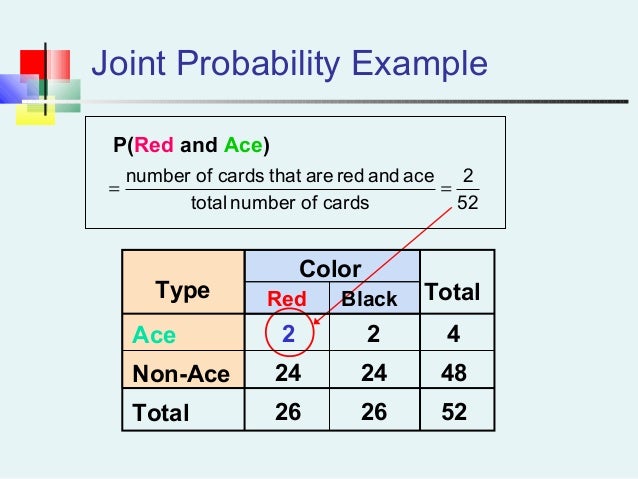
    Probability of event X=A given variable Y. Single Random event probability
    P(A) , A single probability of an independent event.
Probability of event A given event B is termed as Conditional Probability.
    Z score (also called the standard score) represents the number of standard deviations with which the
    value of an observation point or data differ than the mean value of what is observed
    KNN is dependent on distancing estimation from the points of a Class to respectable points in class, thus acting as a Vote Based Neigbouring
    Classifier, where you conclude the outcome of your input to be predicted by measuring which points come close to it.
    You can have as much as neigbours you want, the more you specify neigbours the more classes it will use to evaluate the final outcome.

    Working is quite similar than a distancing algorithm, although you draw the point and calculate all the neigbouring by looking which
    are close, when you are done with it you go with as votes, E.g Class A were 5 classes and Class B were 2 classes in that neigbour hood.
    Hence the vote would be class A.
    Recommended is low FN's, the reason is because if you consider Fraudly Transaction being occured and counting it as not being occured
    This has huge impact on the Business model.
    KMean: Unsupervised, Random points drawn, each uses distance based averages for prediction.
    KNN: Supervised, neigbouring, C values , Voting
    A neural attention mechanism equips a neural network with the ability to focus on a subset of its inputs (or features).
    1) Hard Attention (Image Cropping)
    2) Soft Attention (Highlight attentional area keeping the image size same)

Autoencoders take input data, compress it into a code, then try to recreate the input data from that summarized code. It’s like starting with Moby Dick, creating a SparkNotes version and then trying to rewrite the original story using only SparkNotes for reference. While a neat deep learning trick, there are fewer real-world cases where a simple autocoder is useful. But add a layer of complexity and the possibilities multiply: by using both noisy and clean versions of an image during training, autoencoders can remove noise from visual data like images, video or medical scans to improve picture quality.
    Image Captioning is the process of generating textual description of an image. It uses both Natural Language Processing and Computer Vision to
    generate the captions

    Summarization is the task of condensing a piece of text to a shorter version, reducing the size of the initial text while preserving the meaning.
    Some examples are :
            1) Essay Summarization
            2) Document Summarization
            etc
    Image Segmentation : In digital image processing and computer vision, image segmentation is the process of partitioning a digital image into
    multiple segments (sets of pixels, also known as image objects). The goal of segmentation is to simplify and/or change the representation of
    an image into something that is more meaningful and easier to analyze.

    Pose Analysis:
            The process of determining the location and the orientation of a Human Entity (pose).

Semantic Segmentation is the Segmentation of an image based on Type of Objects

Same as Semantic, although with Objects (with respectable ID's)

    Text classification also known as text tagging or text categorization is the process of categorizing text into organized groups.
    By using Natural Language Processing (NLP), text classifiers can automatically analyze text and then assign a set of pre-defined
    tags or categories based on its content.
    UseCases:
            1) Document Classification
            2) Document Categorization
            3) Point of Interest in Document
            4) OCR
            etc

REFERENCED FROM : https://github.com/andrewekhalel/MLQuestions
1) What's the trade-off between bias and variance? [src]
If our model is too simple and has very few parameters then it may have high bias and low variance. On the other hand if our model has large number of parameters then it’s going to have high variance and low bias. So we need to find the right/good balance without overfitting and underfitting the data. [src]
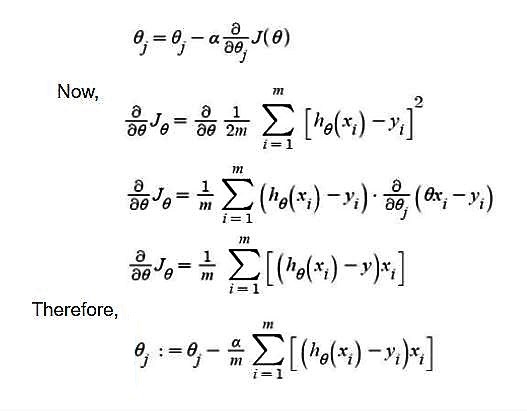
2) What is gradient descent? [src]
Gradient descent is an optimization algorithm used to find the values of parameters (coefficients) of a function (f) that minimizes a cost function (cost).
Gradient descent is best used when the parameters cannot be calculated analytically (e.g. using linear algebra) and must be searched for by an optimization algorithm.
3) Explain over- and under-fitting and how to combat them? [src]
ML/DL models essentially learn a relationship between its given inputs(called training features) and objective outputs(called labels). Regardless of the quality of the learned relation(function), its performance on a test set(a collection of data different from the training input) is subject to investigation.
Most ML/DL models have trainable parameters which will be learned to build that input-output relationship. Based on the number of parameters each model has, they can be sorted into more flexible(more parameters) to less flexible(less parameters).
The problem of Underfitting arises when the flexibility of a model(its number of parameters) is not adequate to capture the underlying pattern in a training dataset. Overfitting, on the other hand, arises when the model is too flexible to the underlying pattern. In the later case it is said that the model has “memorized” the training data.
An example of underfitting is estimating a second order polynomial(quadratic function) with a first order polynomial(a simple line). Similarly, estimating a line with a 10th order polynomial would be an example of overfitting.
4) How do you combat the curse of dimensionality? [src]
- Feature Selection(manual or via statistical methods)
- Principal Component Analysis (PCA)
- Multidimensional Scaling
- Locally linear embedding
[src]
5) What is regularization, why do we use it, and give some examples of common methods? [src]
A technique that discourages learning a more complex or flexible model, so as to avoid the risk of overfitting. Examples
- Ridge (L2 norm)
- Lasso (L1 norm)
The obvious disadvantage of ridge regression, is model interpretability. It will shrink the coefficients for least important predictors, very close to zero. But it will never make them exactly zero. In other words, the final model will include all predictors. However, in the case of the lasso, the L1 penalty has the effect of forcing some of the coefficient estimates to be exactly equal to zero when the tuning parameter λ is sufficiently large. Therefore, the lasso method also performs variable selection and is said to yield sparse models. [src]
6) Explain Principal Component Analysis (PCA)? [src]
Principal Component Analysis (PCA) is a dimensionality reduction technique used in machine learning to reduce the number of features in a dataset while retaining as much information as possible. It works by identifying the directions (principal components) in which the data varies the most, and projecting the data onto a lower-dimensional subspace along these directions.
7) Why is ReLU better and more often used than Sigmoid in Neural Networks? [src]
- Computation Efficiency: As ReLU is a simple threshold the forward and backward path will be faster.
- Reduced Likelihood of Vanishing Gradient: Gradient of ReLU is 1 for positive values and 0 for negative values while Sigmoid activation saturates (gradients close to 0) quickly with slightly higher or lower inputs leading to vanishing gradients.
- Sparsity: Sparsity happens when the input of ReLU is negative. This means fewer neurons are firing ( sparse activation ) and the network is lighter.
8) Given stride S and kernel sizes for each layer of a (1-dimensional) CNN, create a function to compute the receptive field of a particular node in the network. This is just finding how many input nodes actually connect through to a neuron in a CNN. [src]
The receptive field are defined portion of space within an inputs that will be used during an operation to generate an output.
Considering a CNN filter of size k, the receptive field of a peculiar layer is only the number of input used by the filter, in this case k, multiplied by the dimension of the input that is not being reduced by the convolutionnal filter a. This results in a receptive field of k*a.
More visually, in the case of an image of size 32x32x3, with a CNN with a filter size of 5x5, the corresponding recpetive field will be the the filter size, 5 multiplied by the depth of the input volume (the RGB colors) which is the color dimensio. This thus gives us a recpetive field of dimension 5x5x3.
9) Implement connected components on an image/matrix. [src]
10) Implement a sparse matrix class in C++. [src]
11) Create a function to compute an integral image, and create another function to get area sums from the integral image.[src]
12) How would you remove outliers when trying to estimate a flat plane from noisy samples? [src]
Random sample consensus (RANSAC) is an iterative method to estimate parameters of a mathematical model from a set of observed data that contains outliers, when outliers are to be accorded no influence on the values of the estimates. [src]
[Answer] Content-based image retrieval is the concept of using images to gather metadata on their content. Compared to the current image retrieval approach based on the keywords associated to the images, this technique generates its metadata from computer vision techniques to extract the relevant informations that will be used during the querying step. Many approach are possible from feature detection to retrieve keywords to the usage of CNN to extract dense features that will be associated to a known distribution of keywords.
With this last approach, we care less about what is shown on the image but more about the similarity between the metadata generated by a known image and a list of known label and or tags projected into this metadata space.
14) How does image registration work? Sparse vs. dense optical flow and so on. [src]
15) Describe how convolution works. What about if your inputs are grayscale vs RGB imagery? What determines the shape of the next layer?[src]
In a convolutional neural network (CNN), the convolution operation is applied to the input image using a small matrix called a kernel or filter. The kernel slides over the image in small steps, called strides, and performs element-wise multiplications with the corresponding elements of the image and then sums up the results. The output of this operation is called a feature map.
When the input is RGB(or more than 3 channels) the sliding window will be a sliding cube. The shape of the next layer is determined by Kernel size, number of kernels, stride, padding, and dialation.
16) Talk me through how you would create a 3D model of an object from imagery and depth sensor measurements taken at all angles around the object. [src]
There are two popular methods for 3D reconstruction:
SfM is better suited for creating models of large scenes while MVS is better suited for creating models of small objects.
17) Implement SQRT(const double & x) without using any special functions, just fundamental arithmetic. [src]
The taylor series can be used for this step by providing an approximation of sqrt(x):
18) Reverse a bitstring. [src]
If you are using python3 :
data = b'\xAD\xDE\xDE\xC0'
my_data = bytearray(data)
my_data.reverse()
19) Implement non maximal suppression as efficiently as you can. [src]
Non-Maximum Suppression (NMS) is a technique used to eliminate multiple detections of the same object in a given image. To solve that first sort bounding boxes based on their scores(N LogN). Starting with the box with the highest score, remove boxes whose overlapping metric(IoU) is greater than a certain threshold.(N^2)
To optimize this solution you can use special data structures to query for overlapping boxes such as R-tree or KD-tree. (N LogN) [src]
20) Reverse a linked list in place. [src]
21) What is data normalization and why do we need it? [src]
Data normalization is very important preprocessing step, used to rescale values to fit in a specific range to assure better convergence during backpropagation. In general, it boils down to subtracting the mean of each data point and dividing by its standard deviation. If we don't do this then some of the features (those with high magnitude) will be weighted more in the cost function (if a higher-magnitude feature changes by 1%, then that change is pretty big, but for smaller features it's quite insignificant). The data normalization makes all features weighted equally.
22) Why do we use convolutions for images rather than just FC layers? [src]
Firstly, convolutions preserve, encode, and actually use the spatial information from the image. If we used only FC layers we would have no relative spatial information. Secondly, Convolutional Neural Networks (CNNs) have a partially built-in translation in-variance, since each convolution kernel acts as it's own filter/feature detector.
23) What makes CNNs translation invariant? [src]
As explained above, each convolution kernel acts as it's own filter/feature detector. So let's say you're doing object detection, it doesn't matter where in the image the object is since we're going to apply the convolution in a sliding window fashion across the entire image anyways.
24) Why do we have max-pooling in classification CNNs? [src]
for a role in Computer Vision. Max-pooling in a CNN allows you to reduce computation since your feature maps are smaller after the pooling. You don't lose too much semantic information since you're taking the maximum activation. There's also a theory that max-pooling contributes a bit to giving CNNs more translation in-variance. Check out this great video from Andrew Ng on the benefits of max-pooling.
25) Why do segmentation CNNs typically have an encoder-decoder style / structure? [src]
The encoder CNN can basically be thought of as a feature extraction network, while the decoder uses that information to predict the image segments by "decoding" the features and upscaling to the original image size.
26) What is the significance of Residual Networks? [src]
The main thing that residual connections did was allow for direct feature access from previous layers. This makes information propagation throughout the network much easier. One very interesting paper about this shows how using local skip connections gives the network a type of ensemble multi-path structure, giving features multiple paths to propagate throughout the network.
27) What is batch normalization and why does it work? [src]
Training Deep Neural Networks is complicated by the fact that the distribution of each layer's inputs changes during training, as the parameters of the previous layers change. The idea is then to normalize the inputs of each layer in such a way that they have a mean output activation of zero and standard deviation of one. This is done for each individual mini-batch at each layer i.e compute the mean and variance of that mini-batch alone, then normalize. This is analogous to how the inputs to networks are standardized. How does this help? We know that normalizing the inputs to a network helps it learn. But a network is just a series of layers, where the output of one layer becomes the input to the next. That means we can think of any layer in a neural network as the first layer of a smaller subsequent network. Thought of as a series of neural networks feeding into each other, we normalize the output of one layer before applying the activation function, and then feed it into the following layer (sub-network).
28) Why would you use many small convolutional kernels such as 3x3 rather than a few large ones? [src]
This is very well explained in the VGGNet paper. There are 2 reasons: First, you can use several smaller kernels rather than few large ones to get the same receptive field and capture more spatial context, but with the smaller kernels you are using less parameters and computations. Secondly, because with smaller kernels you will be using more filters, you'll be able to use more activation functions and thus have a more discriminative mapping function being learned by your CNN.
29) Why do we need a validation set and test set? What is the difference between them? [src]
When training a model, we divide the available data into three separate sets:
- The training dataset is used for fitting the model’s parameters. However, the accuracy that we achieve on the training set is not reliable for predicting if the model will be accurate on new samples.
- The validation dataset is used to measure how well the model does on examples that weren’t part of the training dataset. The metrics computed on the validation data can be used to tune the hyperparameters of the model. However, every time we evaluate the validation data and we make decisions based on those scores, we are leaking information from the validation data into our model. The more evaluations, the more information is leaked. So we can end up overfitting to the validation data, and once again the validation score won’t be reliable for predicting the behaviour of the model in the real world.
- The test dataset is used to measure how well the model does on previously unseen examples. It should only be used once we have tuned the parameters using the validation set.
So if we omit the test set and only use a validation set, the validation score won’t be a good estimate of the generalization of the model.
30) What is stratified cross-validation and when should we use it? [src]
Cross-validation is a technique for dividing data between training and validation sets. On typical cross-validation this split is done randomly. But in stratified cross-validation, the split preserves the ratio of the categories on both the training and validation datasets.
For example, if we have a dataset with 10% of category A and 90% of category B, and we use stratified cross-validation, we will have the same proportions in training and validation. In contrast, if we use simple cross-validation, in the worst case we may find that there are no samples of category A in the validation set.
Stratified cross-validation may be applied in the following scenarios:
- On a dataset with multiple categories. The smaller the dataset and the more imbalanced the categories, the more important it will be to use stratified cross-validation.
- On a dataset with data of different distributions. For example, in a dataset for autonomous driving, we may have images taken during the day and at night. If we do not ensure that both types are present in training and validation, we will have generalization problems.
31) Why do ensembles typically have higher scores than individual models? [src]
An ensemble is the combination of multiple models to create a single prediction. The key idea for making better predictions is that the models should make different errors. That way the errors of one model will be compensated by the right guesses of the other models and thus the score of the ensemble will be higher.
We need diverse models for creating an ensemble. Diversity can be achieved by:
- Using different ML algorithms. For example, you can combine logistic regression, k-nearest neighbors, and decision trees.
- Using different subsets of the data for training. This is called bagging.
- Giving a different weight to each of the samples of the training set. If this is done iteratively, weighting the samples according to the errors of the ensemble, it’s called boosting. Many winning solutions to data science competitions are ensembles. However, in real-life machine learning projects, engineers need to find a balance between execution time and accuracy.
32) What is an imbalanced dataset? Can you list some ways to deal with it? [src]
An imbalanced dataset is one that has different proportions of target categories. For example, a dataset with medical images where we have to detect some illness will typically have many more negative samples than positive samples—say, 98% of images are without the illness and 2% of images are with the illness.
There are different options to deal with imbalanced datasets:
- Oversampling or undersampling. Instead of sampling with a uniform distribution from the training dataset, we can use other distributions so the model sees a more balanced dataset.
- Data augmentation. We can add data in the less frequent categories by modifying existing data in a controlled way. In the example dataset, we could flip the images with illnesses, or add noise to copies of the images in such a way that the illness remains visible.
- Using appropriate metrics. In the example dataset, if we had a model that always made negative predictions, it would achieve a precision of 98%. There are other metrics such as precision, recall, and F-score that describe the accuracy of the model better when using an imbalanced dataset.
33) Can you explain the differences between supervised, unsupervised, and reinforcement learning? [src]
In supervised learning, we train a model to learn the relationship between input data and output data. We need to have labeled data to be able to do supervised learning.
With unsupervised learning, we only have unlabeled data. The model learns a representation of the data. Unsupervised learning is frequently used to initialize the parameters of the model when we have a lot of unlabeled data and a small fraction of labeled data. We first train an unsupervised model and, after that, we use the weights of the model to train a supervised model.
In reinforcement learning, the model has some input data and a reward depending on the output of the model. The model learns a policy that maximizes the reward. Reinforcement learning has been applied successfully to strategic games such as Go and even classic Atari video games.
34) What is data augmentation? Can you give some examples? [src]
Data augmentation is a technique for synthesizing new data by modifying existing data in such a way that the target is not changed, or it is changed in a known way.
Computer vision is one of fields where data augmentation is very useful. There are many modifications that we can do to images:
- Resize
- Horizontal or vertical flip
- Rotate
- Add noise
- Deform
- Modify colors Each problem needs a customized data augmentation pipeline. For example, on OCR, doing flips will change the text and won’t be beneficial; however, resizes and small rotations may help.
35) What is Turing test? [src]
The Turing test is a method to test the machine’s ability to match the human level intelligence. A machine is used to challenge the human intelligence that when it passes the test, it is considered as intelligent. Yet a machine could be viewed as intelligent without sufficiently knowing about people to mimic a human.
Precision (also called positive predictive value) is the fraction of relevant instances among the retrieved instances
Precision = true positive / (true positive + false positive)
[src]
Recall (also known as sensitivity) is the fraction of relevant instances that have been retrieved over the total amount of relevant instances.
Recall = true positive / (true positive + false negative)
[src]
38) Define F1-score. [src]
It is the weighted average of precision and recall. It considers both false positive and false negative into account. It is used to measure the model’s performance.
F1-Score = 2 * (precision * recall) / (precision + recall)
39) What is cost function? [src]
Cost function is a scalar functions which Quantifies the error factor of the Neural Network. Lower the cost function better the Neural network. Eg: MNIST Data set to classify the image, input image is digit 2 and the Neural network wrongly predicts it to be 3
40) List different activation neurons or functions. [src]
- Linear Neuron
- Binary Threshold Neuron
- Stochastic Binary Neuron
- Sigmoid Neuron
- Tanh function
- Rectified Linear Unit (ReLU)
Learning rate is a hyper-parameter that controls how much we are adjusting the weights of our network with respect the loss gradient. [src]
Momentum lets the optimization algorithm remembers its last step, and adds some proportion of it to the current step. This way, even if the algorithm is stuck in a flat region, or a small local minimum, it can get out and continue towards the true minimum. [src]
Batch gradient descent computes the gradient using the whole dataset. This is great for convex, or relatively smooth error manifolds. In this case, we move somewhat directly towards an optimum solution, either local or global. Additionally, batch gradient descent, given an annealed learning rate, will eventually find the minimum located in it's basin of attraction.
Stochastic gradient descent (SGD) computes the gradient using a single sample. SGD works well (Not well, I suppose, but better than batch gradient descent) for error manifolds that have lots of local maxima/minima. In this case, the somewhat noisier gradient calculated using the reduced number of samples tends to jerk the model out of local minima into a region that hopefully is more optimal. [src]
- Epoch: one forward pass and one backward pass of all the training examples
- Batch: examples processed together in one pass (forward and backward)
- Iteration: number of training examples / Batch size
45) What is vanishing gradient? [src]
As we add more and more hidden layers, back propagation becomes less and less useful in passing information to the lower layers. In effect, as information is passed back, the gradients begin to vanish and become small relative to the weights of the networks.
46) What are dropouts? [src]
Dropout is a simple way to prevent a neural network from overfitting. It is the dropping out of some of the units in a neural network. It is similar to the natural reproduction process, where the nature produces offsprings by combining distinct genes (dropping out others) rather than strengthening the co-adapting of them.
47) Define LSTM. [src]
Long Short Term Memory – are explicitly designed to address the long term dependency problem, by maintaining a state what to remember and what to forget.
48) List the key components of LSTM. [src]
- Gates (forget, Memory, update & Read)
- tanh(x) (values between -1 to 1)
- Sigmoid(x) (values between 0 to 1)
49) List the variants of RNN. [src]
- LSTM: Long Short Term Memory
- GRU: Gated Recurrent Unit
- End to End Network
- Memory Network
50) What is Autoencoder, name few applications. [src]
Auto encoder is basically used to learn a compressed form of given data. Few applications include
- Data denoising
- Dimensionality reduction
- Image reconstruction
- Image colorization
51) What are the components of GAN? [src]
- Generator
- Discriminator
Boosting and bagging are similar, in that they are both ensembling techniques, where a number of weak learners (classifiers/regressors that are barely better than guessing) combine (through averaging or max vote) to create a strong learner that can make accurate predictions. Bagging means that you take bootstrap samples (with replacement) of your data set and each sample trains a (potentially) weak learner. Boosting, on the other hand, uses all data to train each learner, but instances that were misclassified by the previous learners are given more weight so that subsequent learners give more focus to them during training. [src]
53) Explain how a ROC curve works. [src]
The ROC curve is a graphical representation of the contrast between true positive rates and the false positive rate at various thresholds. It’s often used as a proxy for the trade-off between the sensitivity of the model (true positives) vs the fall-out or the probability it will trigger a false alarm (false positives).
54) What’s the difference between Type I and Type II error? [src]
Type I error is a false positive, while Type II error is a false negative. Briefly stated, Type I error means claiming something has happened when it hasn’t, while Type II error means that you claim nothing is happening when in fact something is. A clever way to think about this is to think of Type I error as telling a man he is pregnant, while Type II error means you tell a pregnant woman she isn’t carrying a baby.
55) What’s the difference between a generative and discriminative model? [src]
A generative model will learn categories of data while a discriminative model will simply learn the distinction between different categories of data. Discriminative models will generally outperform generative models on classification tasks.
-
Instance-based Learning: The system learns the examples by heart, then generalizes to new cases using a similarity measure.
-
Model-based Learning: Another way to generalize from a set of examples is to build a model of these examples, then use that model to make predictions. This is called model-based learning. [src]
This question generally depends on your dataset and the model which you wish to apply. But still, a few points to note before choosing the right encoding technique for your model:
We apply One-Hot Encoding when:
- The categorical feature is not ordinal (like the countries above)
- The number of categorical features is less so one-hot encoding can be effectively applied
We apply Label Encoding when:
- The categorical feature is ordinal (like Jr. kg, Sr. kg, Primary school, high school)
- The number of categories is quite large as one-hot encoding can lead to high memory consumption
Both LDA and PCA are linear transformation techniques: LDA is a supervised whereas PCA is unsupervised – PCA ignores class labels.
We can picture PCA as a technique that finds the directions of maximal variance. In contrast to PCA, LDA attempts to find a feature subspace that maximizes class separability.
t-Distributed Stochastic Neighbor Embedding (t-SNE) is an unsupervised, non-linear technique primarily used for data exploration and visualizing high-dimensional data. In simpler terms, t-SNE gives you a feel or intuition of how the data is arranged in a high-dimensional space.
The first thing to note is that PCA was developed in 1933 while t-SNE was developed in 2008. A lot has changed in the world of data science since 1933 mainly in the realm of compute and size of data. Second, PCA is a linear dimension reduction technique that seeks to maximize variance and preserves large pairwise distances. In other words, things that are different end up far apart. This can lead to poor visualization especially when dealing with non-linear manifold structures. Think of a manifold structure as any geometric shape like: cylinder, ball, curve, etc.
t-SNE differs from PCA by preserving only small pairwise distances or local similarities whereas PCA is concerned with preserving large pairwise distances to maximize variance.
UMAP (Uniform Manifold Approximation and Projection) is a novel manifold learning technique for dimension reduction. UMAP is constructed from a theoretical framework based in Riemannian geometry and algebraic topology. The result is a practical scalable algorithm that applies to real world data.
The biggest difference between the output of UMAP when compared with t-SNE is this balance between local and global structure - UMAP is often better at preserving global structure in the final projection. This means that the inter-cluster relations are potentially more meaningful than in t-SNE. However, it's important to note that, because UMAP and t-SNE both necessarily warp the high-dimensional shape of the data when projecting to lower dimensions, any given axis or distance in lower dimensions still isn’t directly interpretable in the way of techniques such as PCA.
It generates a pseudo random number based on the seed and there are some famous algorithm, please see below link for further information on this. [src]
64) Given that we want to evaluate the performance of 'n' different machine learning models on the same data, why would the following splitting mechanism be incorrect :
def get_splits():
    df = pd.DataFrame(...)
    rnd = np.random.rand(len(df))
    train = df[ rnd < 0.8 ]
    valid = df[ rnd >= 0.8 & rnd < 0.9 ]
    test = df[ rnd >= 0.9 ]

    return train, valid, test

#Model 1

from sklearn.tree import DecisionTreeClassifier
train, valid, test = get_splits()
...

#Model 2

from sklearn.linear_model import LogisticRegression
train, valid, test = get_splits()
...
The rand() function orders the data differently each time it is run, so if we run the splitting mechanism again, the 80% of the rows we get will be different from the ones we got the first time it was run. This presents an issue as we need to compare the performance of our models on the same test set. In order to ensure reproducible and consistent sampling we would have to set the random seed in advance or store the data once it is split. Alternatively, we could simply set the 'random_state' parameter in sklearn's train_test_split() function in order to get the same train, validation and test sets across different executions.
65) What is the difference between Bayesian vs frequentist statistics? [src]
Frequentist statistics is a framework that focuses on estimating population parameters using sample statistics, and providing point estimates and confidence intervals.
Bayesian statistics, on the other hand, is a framework that uses prior knowledge and information to update beliefs about a parameter or hypothesis, and provides probability distributions for parameters.
The main difference is that Bayesian statistics incorporates prior knowledge and beliefs into the analysis, while frequentist statistics doesn't.
Contributions are most welcomed.
- Fork the repository.
- Commit your questions or answers.
- Open pull request.
- All of Statistics: A Concise Course in Statistical Inference by Larry Wasserman
- Machine Learning by Tom Mitchell
- Designing Machine Learning Systems: An Iterative Process for Production-Ready Applications by Chip Huyen
Data structures: Lists, stacks, queues, strings, hash maps, vectors, matrices, classes & objects, trees, graphs, etc. Algorithms: Recursion, searching, sorting, optimization, dynamic programming, etc. Computability and complexity: P vs. NP, NP-complete problems, big-O notation, approximate algorithms, etc. Computer architecture: Memory, cache, bandwidth, threads & processes, deadlocks, etc. Probability and Statistics Topics
Conditional probability, Bayes rule, likelihood, independence, etc. Probabilistic models: Bayes Nets, Markov Decision Processes, Hidden Markov Models, etc. Statistical measures: Mean, median, mode, variance, population parameters vs. sample statistics etc. Proximity and error metrics: Cosine similarity, mean-squared error, Manhattan and Euclidean distance, log-loss, etc. Distributions and random sampling: Uniform, normal, binomial, Poisson, etc. Analysis methods: ANOVA, hypothesis testing, factor analysis, etc. Data Modeling and Evaluation Topics
Munging/wrangling, transforming, aggregating, etc. Pattern recognition: Correlations, clusters, trends, outliers & anomalies, etc. Dimensionality reduction: Eigenvectors, Principal Component Analysis, etc. Prediction: Classification, regression, sequence prediction, etc.; suitable error/accuracy metrics. Evaluation: Training-testing split, sequential vs. randomized cross-validation, etc. Applying Machine Learning Algorithms and Libraries Topics
###Models: Parametric vs. nonparametric, decision tree, nearest neighbor, neural net, support vector machine, ensemble of multiple models, etc. Learning procedure: Linear regression, gradient descent, genetic algorithms, bagging, boosting, and other model-specific methods; regularization, hyperparameter tuning, etc. Tradeoffs and gotchas: Relative advantages and disadvantages, bias and variance, overfitting and underfitting, vanishing/exploding gradients, missing data, data leakage, etc. Software Engineering and System Design Topics
###Software interface: Library calls, REST APIs, data collection endpoints, database queries, etc. User interface: Capturing user inputs & application events, displaying results & visualization, etc. Scalability: Map-reduce, distributed processing, etc. Deployment: Cloud hosting, containers & instances, microservices, etc.