With the rapid generation of high throughput datasets, the need for quick and reproducible data analysis tools has become paramount. Thus we developed DRPPM-EASY, an Expression Analysis App hosted in R ShinY. The application minimizing the need for extensive computational experience, providing an easy plug-and-play process to allow the user explore their expression data on a web-based platform. The application provides many of the typical exploratory analyses and visualization, such as unsupervised hierarchical clustering, Gene Set Enrichment (GSEA), and differential gene expression. Results can be downloaded as a comprehensive table or gmt gene set for further downstream analysis.
The ability to analyze omics data (such as genomic and proteomic data) is of significant interest. Thus we also generated DRPPM-EASY-Integration to facilitate the integration between multiple expression data set. DRPPM-EASY-Integration allows users to compare expression data between two matrices. The user can use the platform to identify key features being shared or differentated between the two data sets. We have implemented a pipeline to perform reciprocal GSEA and gene set comparison, to examine the "connectivity" between two data matrices.
Finally, we developed an interface for exploration of complex hetergeneous data such as CCLE or CPTAC. DRPPM-EASY-LargeProject utilizes a sample selection tab which allows users to select expression and meta data and the DRPPM-EASY-LargeProject-Integration allows the user to compare there expression data with samples they choose to select from a large project dataset. As an example, we have implemented an instance of querying the Cancer Cell Line Encyclopedia (CCLE) data based on cancer type or lineage and sample type for analysis within the DRPPM-EASY app http://shawlab.science/shiny/DRPPM_EASY_LargeProject_CCLE/. Separate instance of the Large Project implementation is http://shawlab.science/shiny/DRPPM_EASY_LargeProject_LSCC_CPTAC/. Backup instance of these server are made available in
The flow chart below gives a layout of the EASY app's family infrastructure which we will describe in further detail.

- Download ZIP file from https://github.com/shawlab-moffitt/DRPPM-EASY-ExprAnalysisShinY
- Unzip and load into directory as a project in R Studio
- Open the ‘App.R’ script and write in user input files and options as directed at the top of the script
- ‘App.R’ script begins with example files loaded in from the ExampleData folder
- Press ‘Run App’ button in R Studio to run in application or browser window and enjoy!
- The app script will install any missing packages that the user may not have locally
- Clone the GitHub Repository into the destination of your choice.
git clone https://github.com/shawlab-moffitt/DRPPM-EASY-ExprAnalysisShinY.git- To run in R studio I recommend opening R Studio and starting a new project with a name of your choice
- In the terminal tab at the bottom you can type in the git clone command from above
- Make sure to set 'DRPPM-EASY-ExprAnalysisShinY-main' as your working directory
- You can do this in the 'More' drop down box from the 'Files' tab on the top of the bottom-right box in R Studio
- Open the ‘App.R’ script and write in user input files and options as directed at the top of the script
- ‘App.R’ script begins with example files loaded in from the ExampleData folder
- Press ‘Run App’ button in R Studio to run in application or browser window and enjoy!
- The app script will install any missing packages that the user may not have locally
R- https://cran.r-project.org/src/base/R-4/R Studio- https://www.rstudio.com/products/rstudio/download/
| shiny_1.6.0 | shinythemes_1.2.0 | shinyjqui_0.4.0 | shinycssloaders_1.0.0 | tools_4.1.0 |
| dplyr_1.0.7 | tidyr_1.1.3 | readr_2.0.1 | tibble_3.1.3 | DT_0.18 |
| ggplot2_3.3.5 | plotly_4.9.4.1 | enrichplot_1.12.2 | pheatmap_1.0.12 | ggrepel_0.9.1 |
| enrichR_3.0 | limma_3.48.3 | clusterProfiler_4.0.5 | limma_3.48.3 | GSVA_1.40.1 |
| BiocManager_1.30.16 | reshape2_1.4.4 | ggpubr_0.4.0 |
- Expression Matrix (.tsv/.txt):
- Must be tab delimited with gene names as symbols located in the first column with subsequent columns consiting of the sample name as the header and expression data down the column.
- The current App expects lowly expressed genes filtered out and normalized data either to FPKM or TMM.
- Larger files might inflict memory issues for you local computer.
- This file type is required for the Getting Started Script, GSEA_Sig_Table_Gen.R as well as for within the app.
- Meta Data (.tsv/.txt):
- Must be tab delimited with two columns. First column of sample names and second column as phenotype grouping of the samples
- This file type is required for the Getting Started Script, GSEA_Sig_Table_Gen.R as well as for within the app.
- MSigDB Files:
- These gene set files were gathered from the Molecular Signatures Database (MSigDB) as separate collections and processed through R to generate a master gene set file to use for GSEA and ssGSEA analysis.
- These files begin with "msigdb_" and can be found here.
- Please note that some gene sets are available for Homo sapiens and Mus musculus which are designated by HS or MM respectively.
- Tab 2 Gene Set files:
- The tab 2 gene set initially written to show gene sets from the Cell Marker Database but can be adjusted by the user
- We also provide LINCS L1000 gene sets derived from small molecule perturbations following drug treatment.
- If the user choses to adjust this gene set they must also ensure there is an RData list file provided for it as well.
- This file can be generated with one of the getting started scripts we described previously.
- GMT file or Gene Set Data (optional):
- If the user chooses to user their own gene set file it must be formatted correctly.
- If using a .gmt file you can find example formatting by the Broad Institute as seen here.
- The other option, usefull if generating your own gene sets, is making a two column tab delimited file with the first column being the gene set name repeating for every gene symbol that would be placed in the second column. Examples of this format can be seen in some of the gene set files we have provided here.
- If the user chooses to use their own gene set file, it is recommended that they use the Getting Started Script, GeneSetRDataListGen.R, to generate an R data list which is needed to perform ssGSEA analysis.
- These gene set files could be used for generating the enriched signatures table in the Getting Started Script, GSEA_Sig_Table_Gen.R as well as replacing the gene set within the DRPPM-EASY app script.
- To simplify this optional input there is a tab within the app's GSEA section for the user to upload their own gene set file instead of hard coding it in. Example inputs can be downloaded https://github.com/shawlab-moffitt/DRPPM-EASY-ExprAnalysisShinY/tree/main/ExampleData
- If the user chooses to user their own gene set file it must be formatted correctly.
One of the file inputs for the Shiny App is the GSEA enriched signatures table for your samples. While it is not fully required to get the app running, it is a helpful tool to examine all of the gene sets in a ranked table format. The production of this table can take several minutes depending on the number of gene sets that are being ranked, but to save time we wrote a script that requires just a few file inputs and does the rest for you! We use all of the collections from the Molecular Signatures Database (MSigDB) for the initial ranking but the getting started script and the Shiny App both allow for user input of gene set/gmt files.
More details on these file inputs in the Required Files section.
expr_file- Expression matrix filemeta_file- Meta FileGeneSet_file- Gene set file as .gmt or tab delimited, as describe here.- Intial script uses MSigDB gene set file
OutPath- Text input of user defined outfile path - This is where your enriched signature table(s) will be written to. The specific file naming is taken care of in the script.
Once these files are input in the script it can be run in its entirety. The script consists of reading the files and correcting for any formatting issues, generating groups based off of the meta file, and running through the signal-to-noise calculation. Based off the groups found in the meta file, an enriched signatures table will be made for each combination of the groupings and writen to a file containing the group names being compared.
If you choose to use your own Gene Sets either in .gmt or tab delimited format as described above, in order to perform ssGSEA analysis the Gene Set must be converted into an RData list object when loaded into the app. This list can take several minutes to generate depending on the size of the gene set file, so there is a separate script to perform this with GeneSetRDataListGen.R. The only user input is the Gene Set file path and name, whether or not it has a header, and the desired outfile path and name. Once they are input, the code can be run as a whole and it will produce and save an RData list which can be input to the R Shiny app. These RData lists have already been generated for provided Gene Sets and can be found in the Gene Sets folder of this repsitory.
Similar to generating the Enriched Signatures Table, the Shiny App requires just a few user inputs and it can be up and running. Once the app script is loaded all that is needed is to update the user input and then it can be run!
Below is the begining chunk of code for the Shiny App and where the user will designate which files to use for the analysis. Here you designate the name for the app, your expression and meta data, a single or list of enriched signature tables to display (if you do not provide one you can remove the content within the parentheses), as well as your gene set seletion for the second tab of the GSEA section (initially fill with Cell Marker Gene Set data). Along with answering some TRUE or FALSE statements in this chunk, it should be the only secion that requires editing by the user, though to note, there is a section below in the script that calls on the MSigDB gene sets based on the 'Human' TRUE or FALSE statement. These paths for these files are coded in to the proper path as long as the installation instructions are followed properly.
####----User Data Input----####

#Input desired project name for webpage - will be followed by 'Expression Analysis'
ProjectName <- "USP7 Human Demo"

##--User Input File Names--##

#expression data
expr_file <- "~/R/DRPPM-EASY-ExprAnalysisShinY-main/ExampleData/htseq_gene_level_fpkm_T_geneName_max_1cutoff_v2.txt"

#meta data
meta_file <- "~/R/DRPPM-EASY-ExprAnalysisShinY-main/ExampleData/USP7_meta.tsv"
#Is there a header?
header <- TRUE

#Enriched Signatures data table
ES_tables <- c("~/R/DRPPM-EASY-ExprAnalysisShinY-main/ExampleData/USP7_Enrich_Sig.tsv")

#If human: set TRUE
#If mouse: set FALSE
human <- TRUE

##--User Gene Set Input--##

#write in the name of your gene set list for shiny UI
userGSlist_name <- 'CellMarker Gene Sets'

#path to your gene set file .gmt or .txt/.tsv
userGS_file <- '~/R/DRPPM-EASY-ExprAnalysisShinY-main/GeneSets/CellMarker_gsNsym_HS.tsv'
#Does gene set file have header?
header.gs <- TRUE

#path to your R data list object for ssGSEA
userRData_file <- '~/R/DRPPM-EASY-ExprAnalysisShinY-main/GeneSets/CellMarker_GS_HS.RData'
Once the file names and choices are correctly written you should be able to hit the "Run App" button in your R Studio desktop application load up the web page if you decide to save the code to a server.
Differential gene expression analysis is performed between two groups of samples chosen by the user within the apps interface. The expression data for these groups is log transformed (log2 + 1) followed by a model matrix designed from the meta groups chosen. The matrix is then used for LIMMA linear modeling followed by Bayes statistics to rank the genes based on statistical significance. Figures and tables produce through these methods include hetmaps, volcano, MA, and box plots, as well as a gene expression scatter plot and pathway analysis with enrichR.

- The option the display a custom heatmap of selected genes and samples
- Download sample cluster results based on cut tree and the clustering method chosen
- Download most variable genes list as a ranked table or as a .gmt file for GSEA
- Variance measure can be selected by user

- User may select or type in genes they wish to view
- This is initially filled with gene involved with tumor and immun cell interaction
- Specific samples may also be selected to view
- All samples are shows to start but within the box you may delete the name to un-select the sample

- User may select sample groups by meta type to compare in the LIMMA analysis
- Log2FC and -log10(P.Value) may be adjusted to move the dashed lines on the plot
- The number of top hits displayed may be adjusted and the user may select hits to annotate by selecting or writing in a gene name
- Depending on how many genes being displayed, name may overlap
- Hovering over a poin/gene on the plot will display a text box below showing the name of the gene and statistical values
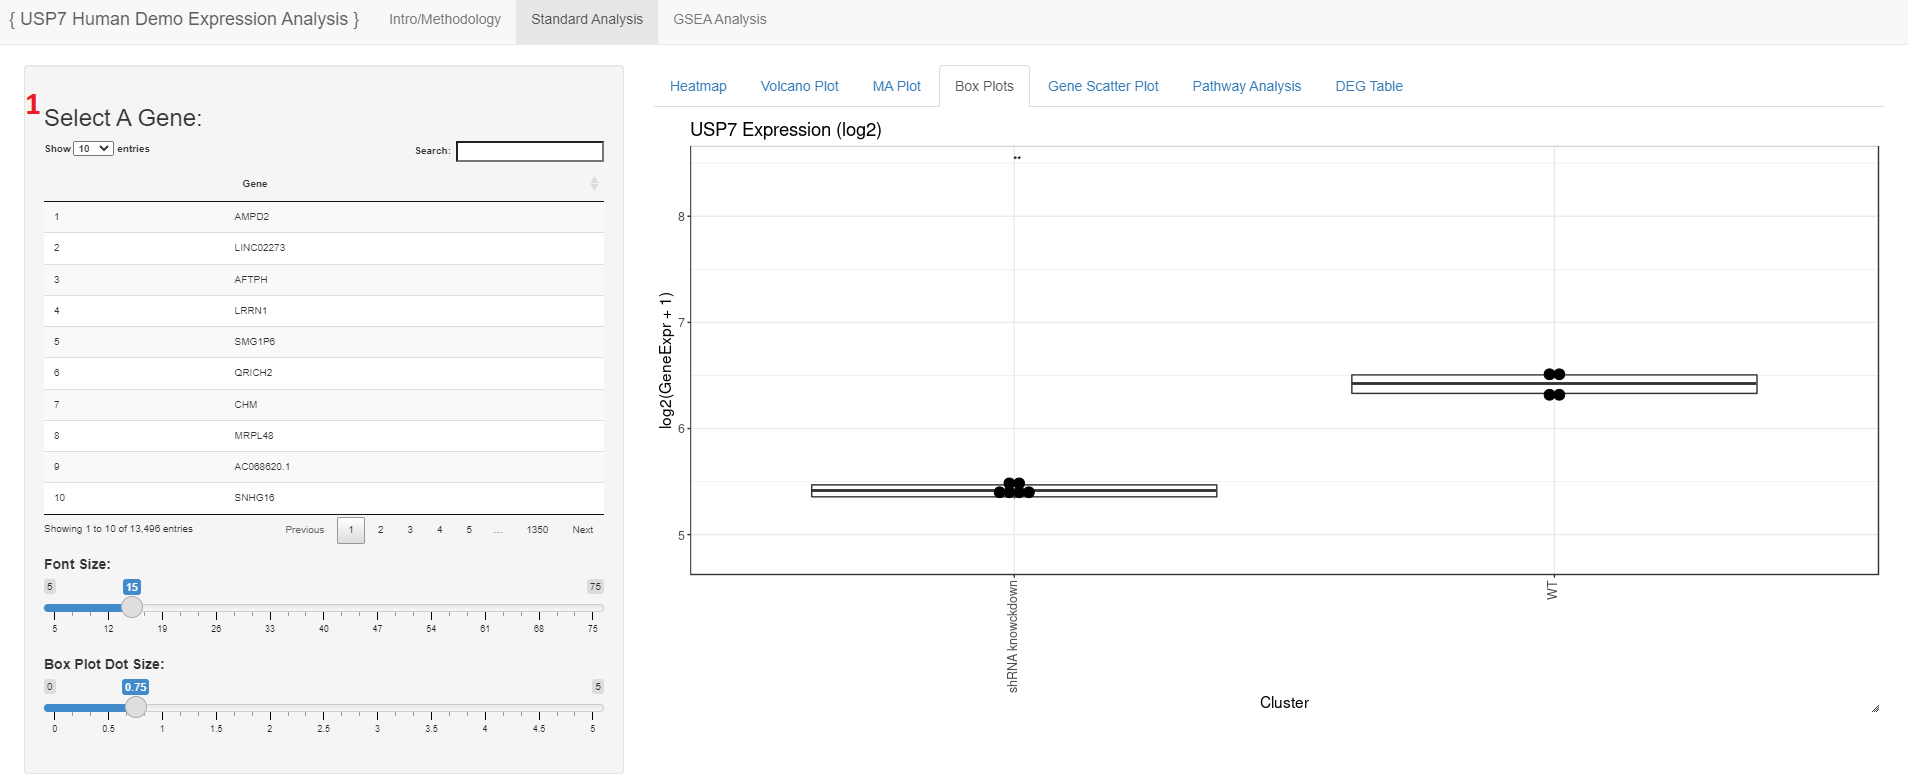
- Users may search for and select a gene to view log2 transformed expression values as a box plot
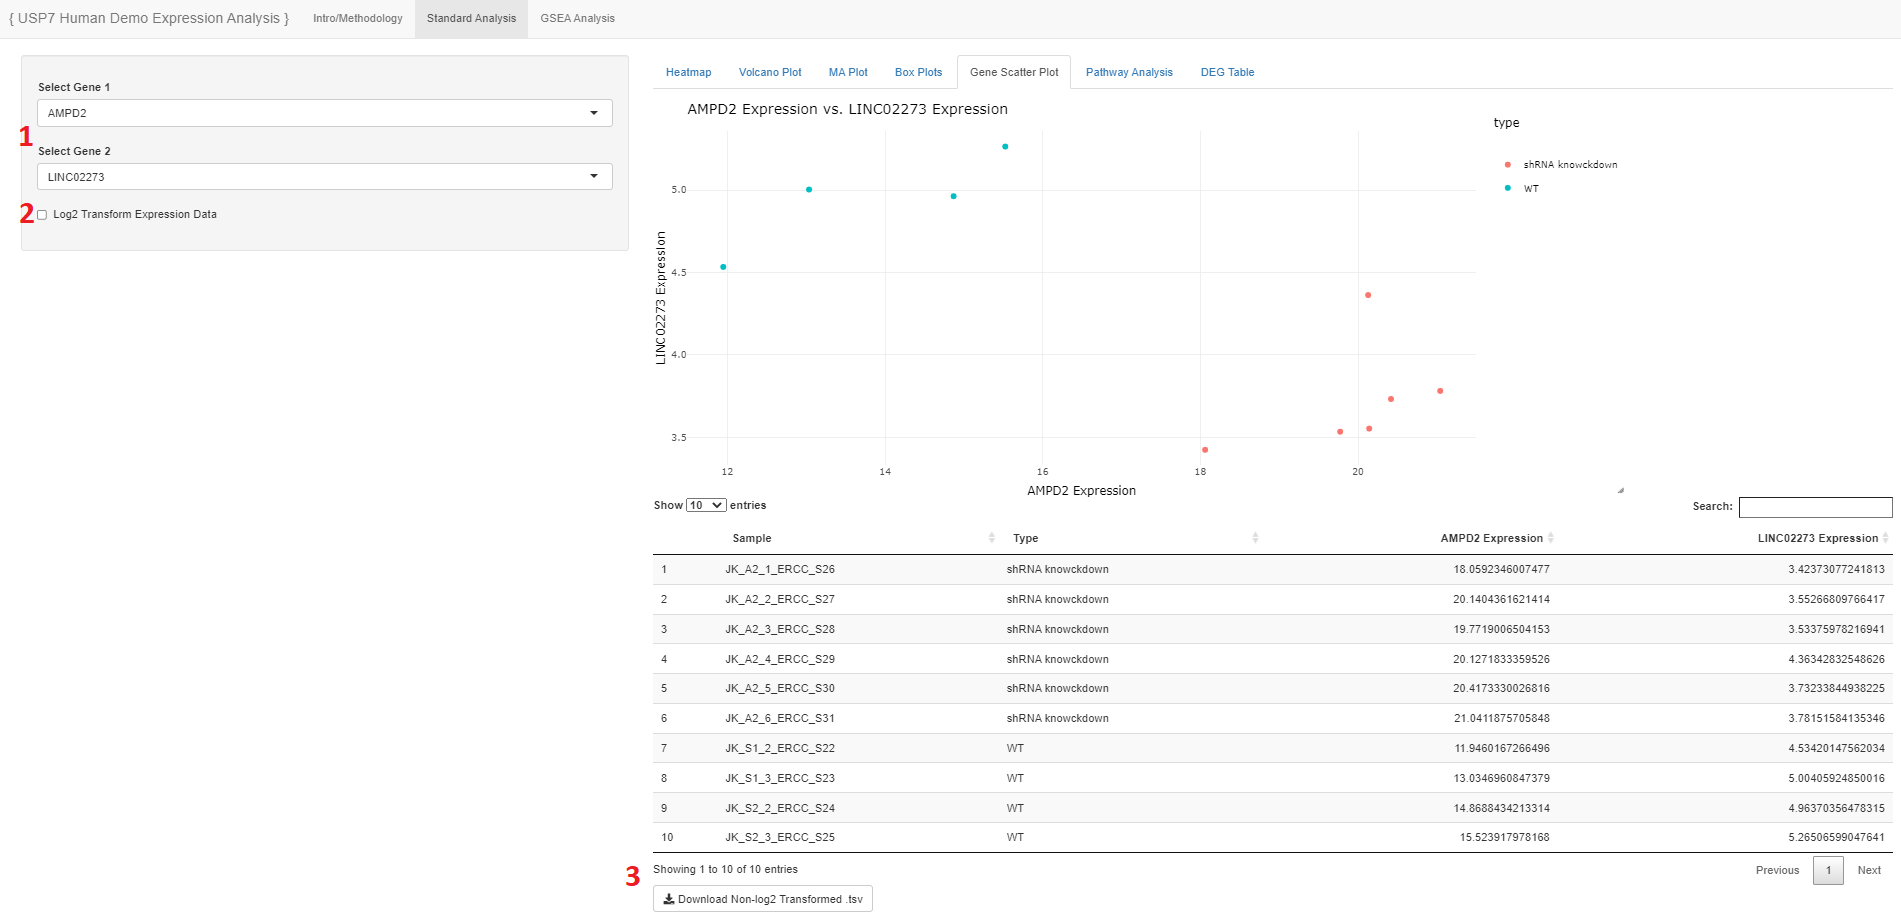
- Users may select two genes they want to compare
- The expression data show will be originally un-logged, so the user may choose to log2 transform
- The user may download the table of expression values
- The table will be of un-logged values
- Users may select the comparison groups for analysis
- Adjusted P-Value and logFC cutoff may be adjusted based on the users preference of significance
- Depending on the thresholds given an error might show if there are no genes that make this cutoff
- The user may select a pathway from the EnrichR database
- The up and down regulated pathway tables may be downloaded as they are or in GMT format
- The table displayed may be downloaded as a gmt file of one gene set based on the number of top hits input
- At the bottom of the table there is a download button for the entire top table
Gene set enrichment analysis (GSEA) is performed through signal-to-noise calculations on the expression matrix. This scales the difference of means by standard deviation, producing a ranked list of genes. The GSEA function identifies the enrichment score of a gene set by taking the ranked genes list into account.
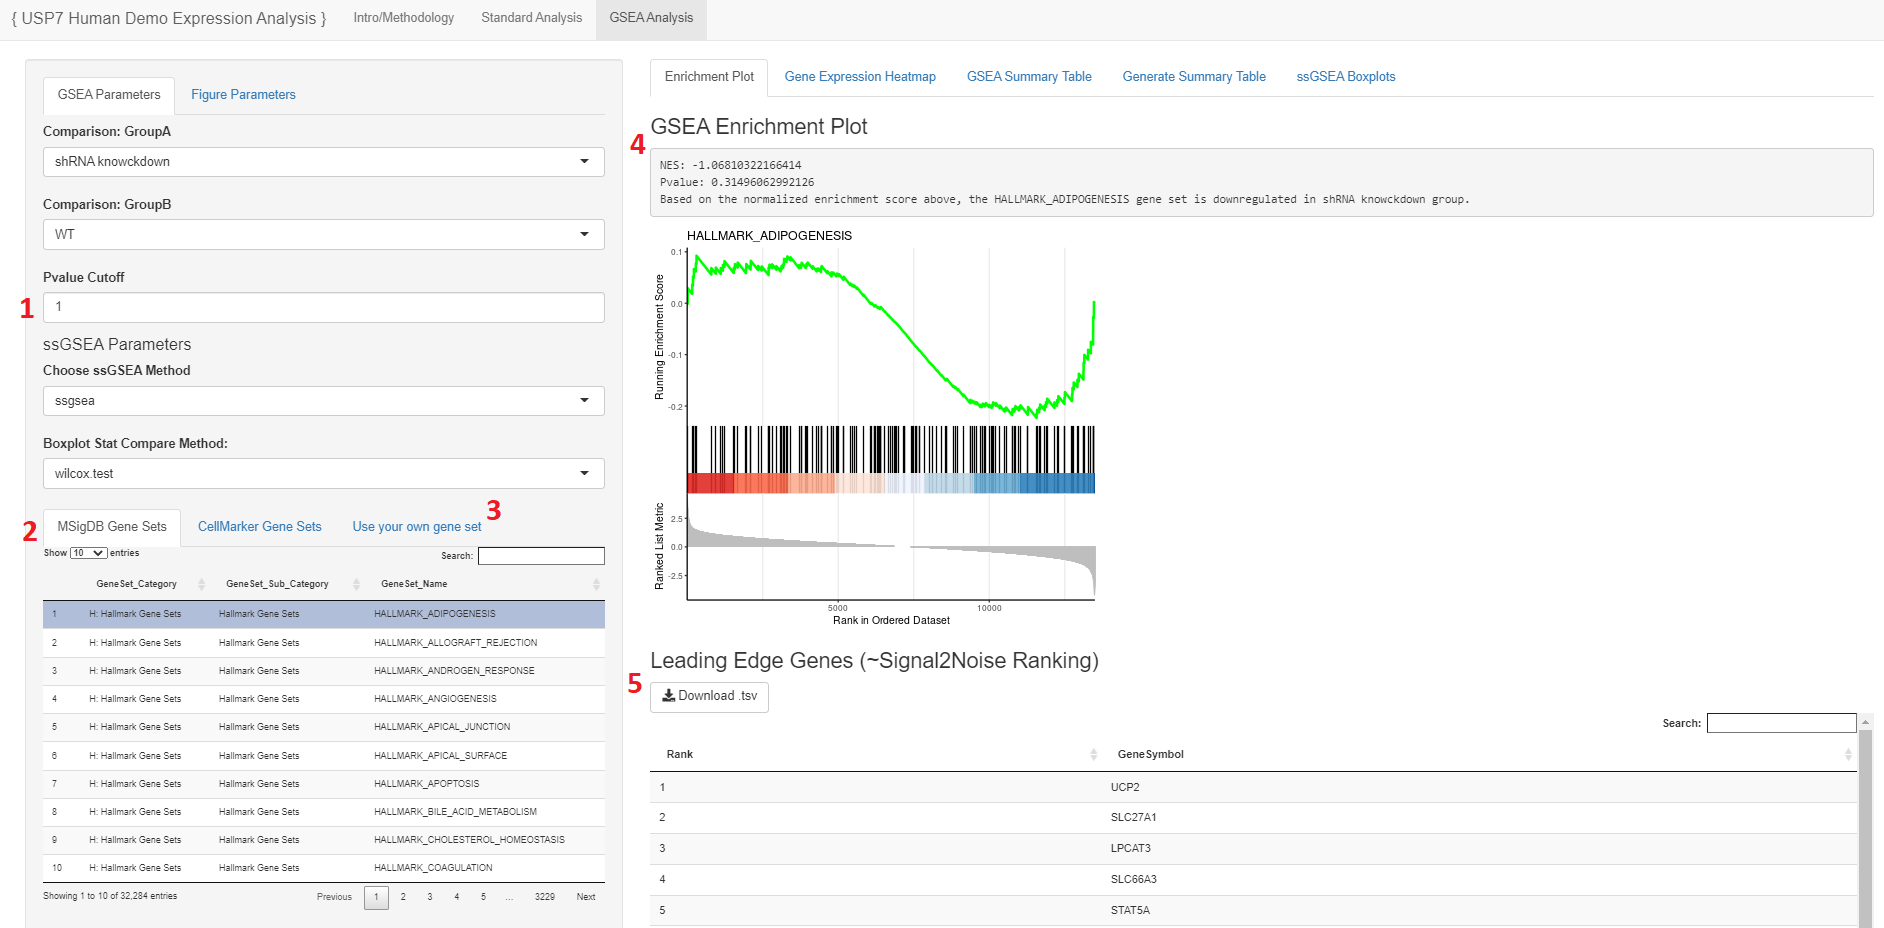
- The user may select the P-Value cutoff for the significance of the gene when running through the ranked list during GSEA
- Please note: Depending on the designated P-value selected as well as the genes in the expression matrix, there will be some gene sets that may show errors. This is due to the genes within the gene set not being significantly enriched or available to produce any data or visualizations.
- Users may select a gene set to view in the enrichment plot from MSigDB or another database that is loaded in
- Initially the second tab has the Cell Marker database but that can be adjusted by the user
- The user may upload their own gene set file as one of the formats described in the gene set bullet point of reqired files
- The Normalized Enrichement Score (NES) and P-value will be annotated above the plot
- The leading edge gene list of the plot may be downloaded

- The user may adjust figure parameters
- The user must choose a gene set to display
- The user may also upload there own, similar to the enrichment plot

- If multiple tables loaded into the app, the user may choose which to view based on file name
- The user may generate their own enriched signatures table with a gmt or gene set file of their choice

- A single sample GSEA (ssGSEA) method may be chosen and a stat compare method to view in the boxplot
- The user may choose a gene set to view
- If the user chooses to use their own gene set they will have to upload here and select the button to generate an RData list
- The ssGSEA score file may be downloaded here
- This table may be used in the DRPPM-EASY-Integration App wher you can compare two of these types of files to each other, or you can compare one of the files to an expression matrix to generate a correlation ranking
Please email Alyssa Obermayer at alyssa.obermayer@moffitt.org if you have any further comments or questions in regards to the R Shiny Application.