


In 1854, Dr. John Snow used spatial analysis by mapping patterns and occurrences of cholera outbreaks in Soho, London. He mapped the deaths in the neighbourhood and determined that a vast majority occurred around one particular water well and that those that died used that well.
In this Python project, you will reanalyze the data and recreate his famous map.
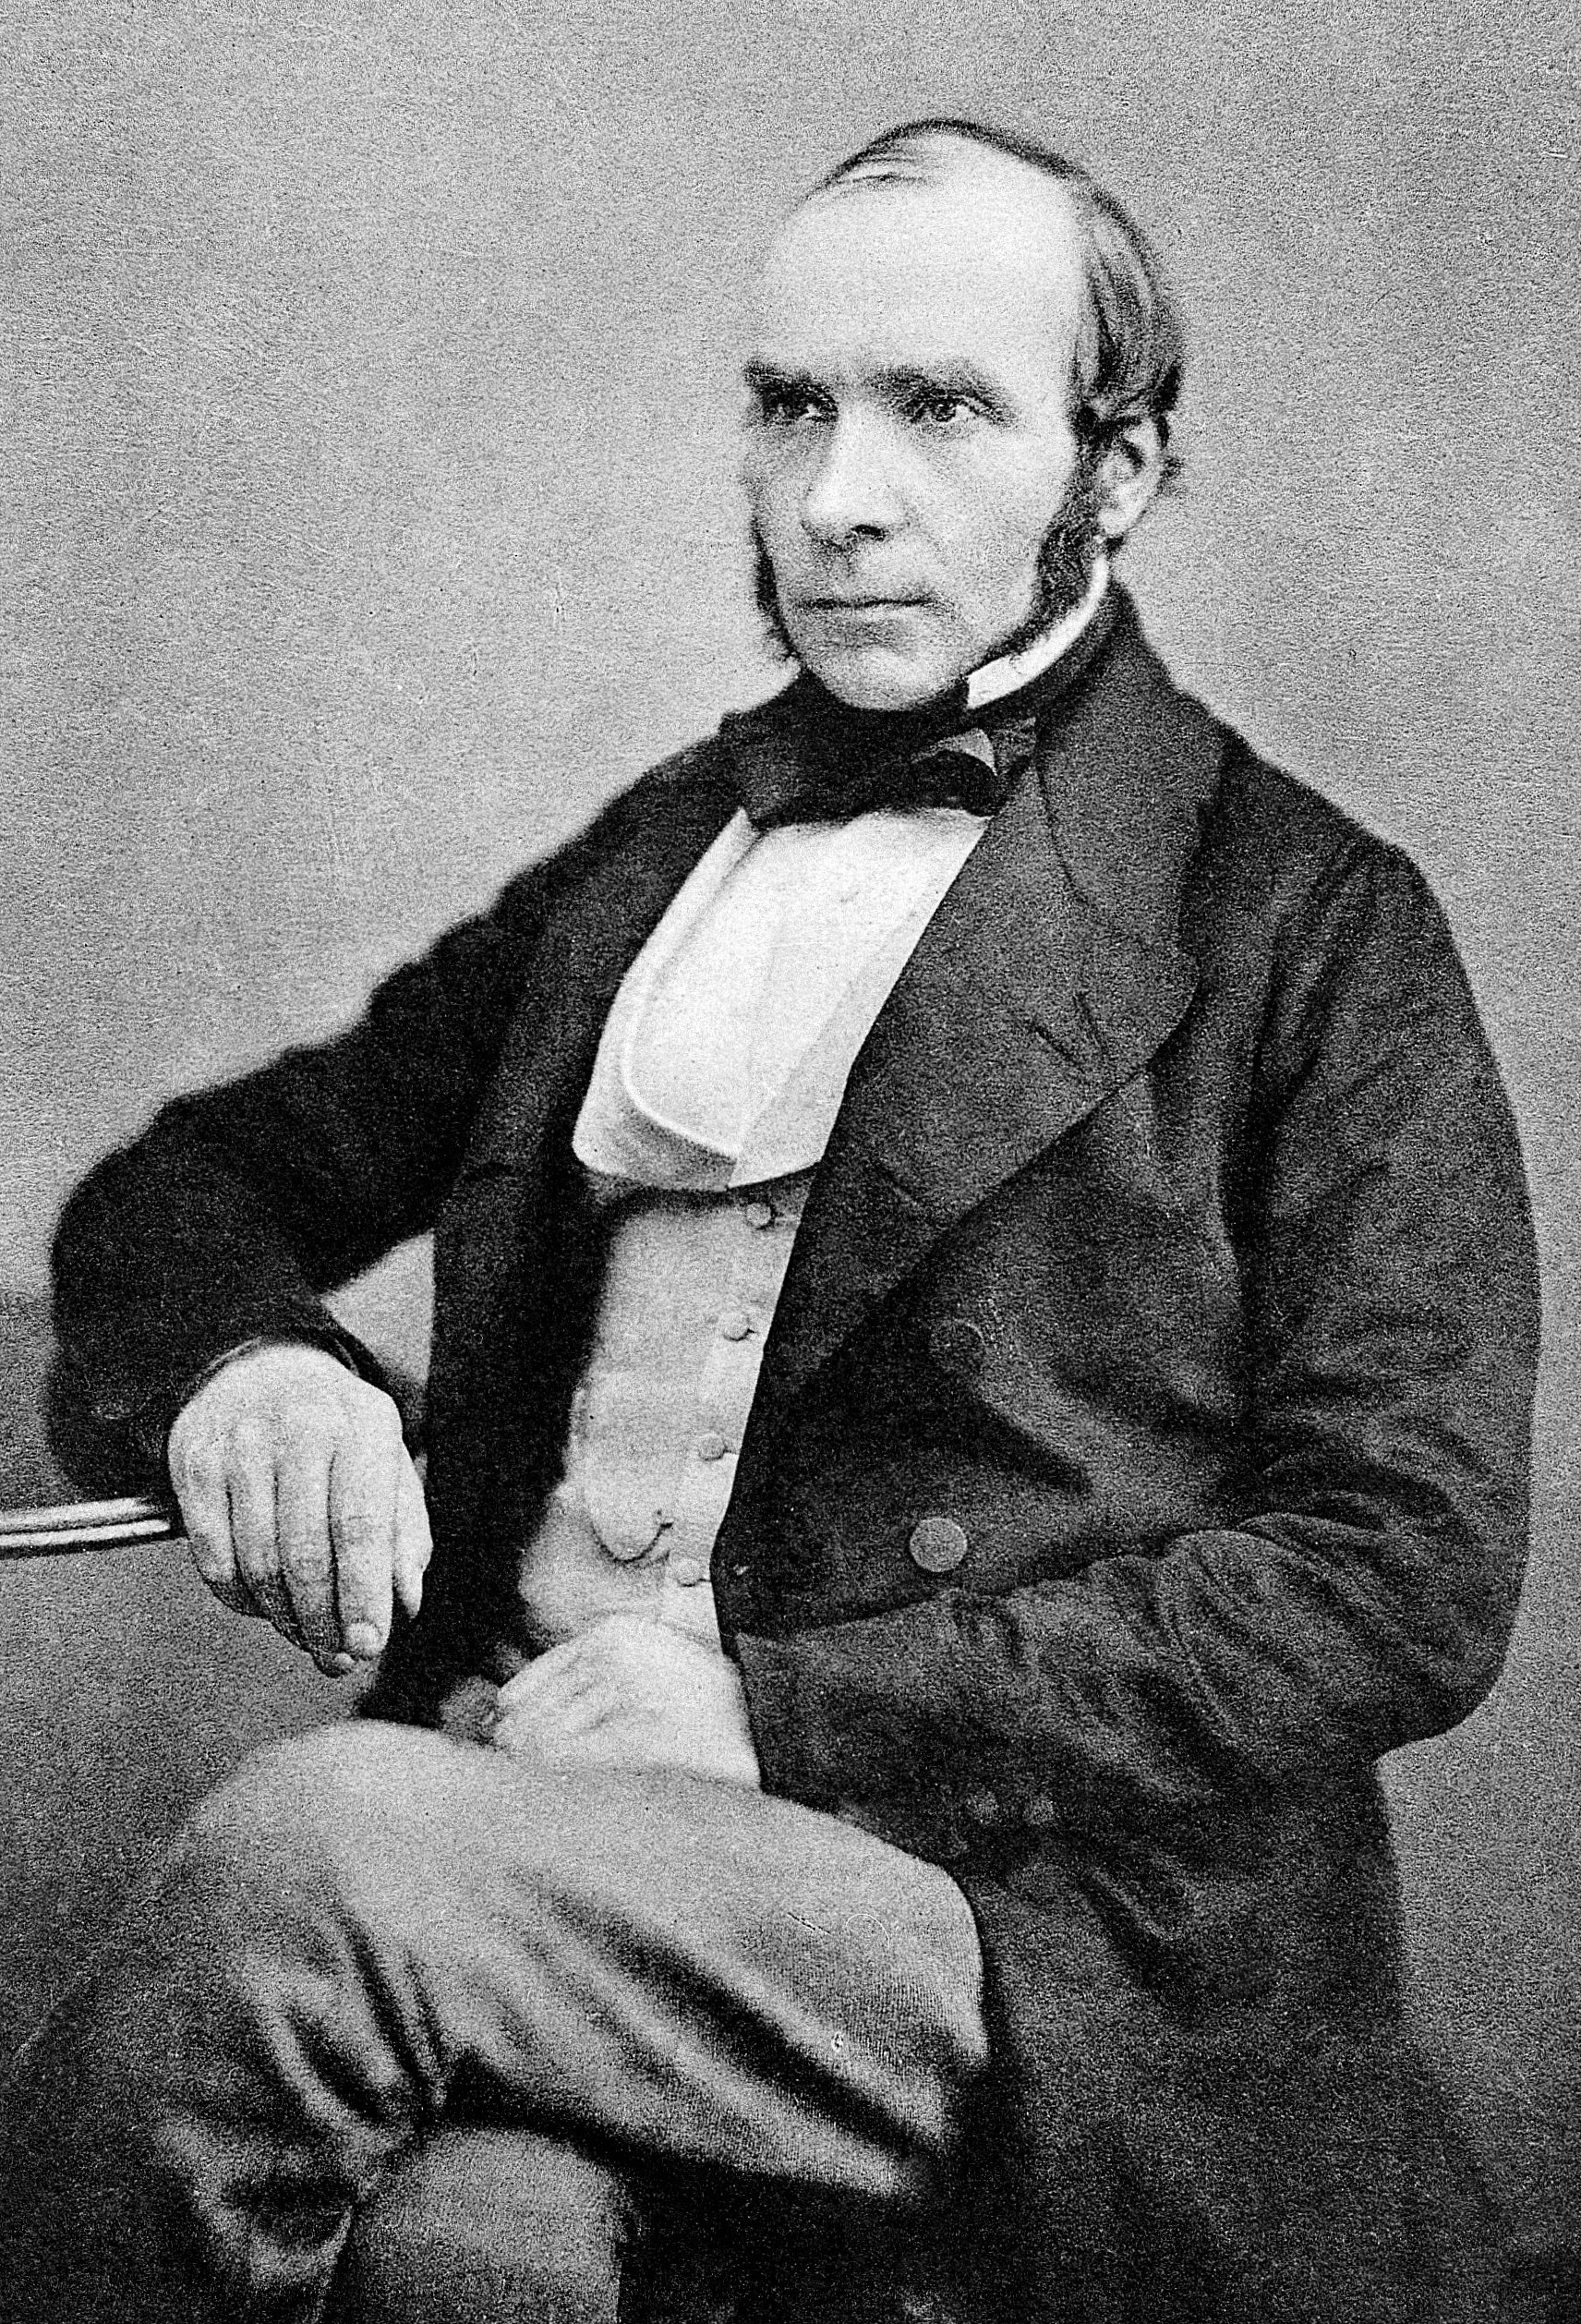
Dr. John Snow (1813-1858) was a famous British physician and is widely recognized as a legendary figure in the history of public health and a leading pioneer in the development of anesthesia. Some even say one of the greatest physicians of all time.
deaths = pd.read_csv('datasets/deaths.csv')

newcols = {
    'Death': 'death_count',
    'X coordinate': 'x_latitude',
    'Y coordinate': 'y_longitude'
    }

deaths.rename(newcols, inplace=True,axis='columns')
print(deaths.shape)

>>> (489, 3)

print(deaths.head())| death_count | x_latitude | y_longitude | |
|---|---|---|---|
| 0 | 1 | 51.513418 | -0.137930 |
| 1 | 1 | 51.513418 | -0.137930 |
| 2 | 1 | 51.513418 | -0.137930 |
| 3 | 1 | 51.513361 | -0.137883 |
| 4 | 1 | 51.513361 | -0.137883 |
Originally he formulated and published his theory that cholera is spread by water or food in an essay, which received negative reviews, but we know he was right.
print(deaths.describe())| death_count | x_latitude | y_longitude | |
|---|---|---|---|
| count | 489.0 | 489.000000 | 489.000000 |
| mean | 1.0 | 51.513398 | -0.136403 |
| std | 0.0 | 0.000705 | 0.001503 |
| min | 1.0 | 51.511856 | -0.140074 |
| 25% | 1.0 | 51.512964 | -0.137562 |
| 50% | 1.0 | 51.513359 | -0.136226 |
| 75% | 1.0 | 51.513875 | -0.135344 |
| max | 1.0 | 51.515834 | -0.132933 |
His medical colleagues simply said: "You know nothing, John Snow!" However, a reviewer made a helpful suggestion in terms of what evidence would be compelling: the crucial natural experiment would be to find people living side by side with lifestyles similar in all respects except for the water source.
.jpg)
We now know how John Snow did it and have the data too, so let's recreate his map using modern techniques.
import folium

locations = deaths[['x_latitude', 'y_longitude']]
deaths_list = locations.values.tolist()

map = folium.Map(location=[51.5132119,-0.13666], tiles='Stamen Toner', zoom_start=17)
for point in range(0, len(deaths_list)):
    folium.CircleMarker(deaths_list[point], radius=8, color='red', fill=True, fill_color='red', opacity = 0.4).add_to(map)
map
After marking the deaths on the map, what John Snow saw was not a random pattern.The majority of the deaths were concentrated at the corner of Broad Street (now Broadwick Street) and Cambridge Street (now Lexington Street). A cluster of deaths around the junction of these streets was the epicenter of the outbreak, but what was there? Yes, a water pump.
pumps = pd.read_csv('datasets/pumps.csv')
locations_pumps = pumps[['X coordinate', 'Y coordinate']]
pumps_list = locations_pumps.values.tolist()

map1 = map
for point in range(0, len(pumps_list)):
    folium.Marker(pumps_list[point], popup=pumps['Pump Name'][point]).add_to(map1)
map1
Removing the handle from the pump prevented any more of the infected water from being collected. The spring below the pump was later found to have been contaminated with sewage. This act was later recognized as an early example of epidemiology, public health medicine and the application of science (the germ theory of disease) in a real-life crisis.
import bokeh
from bokeh.plotting import output_notebook, figure, show
output_notebook(bokeh.resources.INLINE)

# Set up figure
p = figure(plot_width=900, plot_height=450, x_axis_type='datetime', tools='lasso_select, box_zoom, save, reset, wheel_zoom',
          toolbar_location='above', x_axis_label='Date', y_axis_label='Number of Deaths/Attacks',
          title='Number of Cholera Deaths/Attacks before and after 8th of September 1854 (removing the pump handle)')

# Plot on figure
p.line(dates['date'], dates['deaths'], color='red', alpha=1, line_width=3, legend='Cholera Deaths')
p.circle(dates['date'], dates['deaths'], color='black', nonselection_fill_alpha=0.2, nonselection_fill_color='grey')
p.line(dates['date'], dates['attacks'], color='black', alpha=1, line_width=2, legend='Cholera Attacks')

show(p)
john_snow_knows_nothing = False