This tutorial briefly explains how to use Sigfox's callback method to POST data to a Python Flask server. This example utilises a mock/placeholder 'Temperature' sensor that is represented by an Akeru Board (by Snootlabs) but could easily be replaced with a Sigfox enabled device of your choosing. We'll use ngrok to publicly expose our server for testing purposes.


If you do not have these libraries/packages installed please follow the attached links to install them. This tutorial assumes you have at least a novice level of understanding of Python, HTML/CSS/JS and Arduino.
Python 2.7
Javascript
Arduino
Ngrok
To begin we must first start by configuring our server to receive data from the Sigfox Backend. Flask is a great package for handling HTTP requests and we'll use it to accept incoming POST requests from the Sigfox Backend to display in our web browser.
We'll start by configuring two end points on the server, /data/ and /graph. The /data/ endpoint will be where Sigfox will post our sensor data to. We've set it up to pass a value so that if we decide to include multiple devices with multiple sensors we can differentiate which sensor data we have received.
Create two methods as shown below and import the required packages...
from flask import Flask, request, jsonify, render_template
import datetime

app = Flask(__name__)

@app.route('/data/<sensor>', methods=['POST'])

@app.route('/graph') # the default REST method in flask is GET

if __name__ == '__main__':
    app.run(host= '0.0.0.0',debug=True)
We then want to start populating these with instructions as what to do when either data is POSTed to /data or a user visits /graph.
from flask import Flask, request, jsonify, render_template
import datetime

app = Flask(__name__)

tempStore = []
dateStore = []

@app.route('/data/<sensor>', methods=['POST'])

@app.route('/graph') # the default REST method in flask is GET

if __name__ == '__main__':
    app.run(host= '0.0.0.0',debug=True)
Start by creating two lists to hold the data for the X and Y axis of the graph. We'll call these tempStore[] and dateStore[], respectively.
Next we'll start building the method to handle the POSTed data.
from flask import Flask, request, jsonify, render_template
import datetime

app = Flask(__name__)

tempStore = []
dateStore = []

@app.route('/data/<sensor>', methods=['POST'])
def add_message(sensor):

    content = request.json # grab the json data from the POST request
    time = int(content['time'])
    time = datetime.datetime.fromtimestamp(time).strftime('%Y-%m-%d %H:%M:%S') # convert epoch time to human readable time
    tempStore.append(content['temp'])
    dateStore.append(time)
    if len(tempStore) > 10: # truncate data after 10 elements to avoid large lists
        del tempStore[0]
        del dateStore[0]
    print tempStore # print useful info to the debug console
    print time
    print content['device']
    return ('', 200)

@app.route('/graph') # the default REST method in flask is GET

if __name__ == '__main__':
    app.run(host= '0.0.0.0',debug=True)
As we're not using a database to store our values, we'll truncate our data to only the 10 most recent recordings of temperature to avoid creating overly large lists.
Now that we're correctly handling the POST data, we should focus on how we'll display this data. For simplicity, I've chosen to use the ChartJS library to easily draw and display a line chart at our /graph endpoint.
from flask import Flask, request, jsonify, render_template
import datetime

app = Flask(__name__)

tempStore = []
dateStore = []

@app.route('/data/<sensor>', methods=['POST'])
def add_message(sensor):

    content = request.json # grab the json data from the POST request
    time = int(content['time'])
    time = datetime.datetime.fromtimestamp(time).strftime('%Y-%m-%d %H:%M:%S') # convert epoch time to human readable time
    tempStore.append(content['temp'])
    dateStore.append(time)
    if len(tempStore) > 10: # truncate data after 10 elements to avoid large lists
        del tempStore[0]
        del dateStore[0]
    print tempStore # print useful info to the debug console
    print time
    print content['device']
    return ('', 200)

@app.route('/graph') # the default REST method in flask is GET
def show_graph():

    return render_template('index.html', temps=tempStore, dates=dateStore)

if __name__ == '__main__':
    app.run(host= '0.0.0.0',debug=True)
Here we've used the flask method 'return_template' to return our index.html file to the user's browser upon request. When returning this view to the user, we pass in the variables 'temps' and 'dates' which store our lists of incoming data.
This is the python part of our project now finished! Next we'll move to the HTML view that we'll use display to the user.
<!doctype html>
<html>
<head>
    <script src="https://cdnjs.cloudflare.com/ajax/libs/Chart.js/2.2.2/Chart.bundle.min.js"></script>
</head>
<body>
    <canvas id="myChart" width="400" height="180"></canvas>
    <script></script>
</body>
</html>
Start by grabbing the ChartJS library. If you wish to, you can include the actual files into your repo but for what we're doing, it's simple enough just to grab the javascript from ChartJS's server.
Create a canvas element with the id, 'myChart' and create an empty script tag.
<!doctype html>
<html>
<head>
    <script src="https://cdnjs.cloudflare.com/ajax/libs/Chart.js/2.2.2/Chart.bundle.min.js"></script>
</head>
<body>
    <canvas id="myChart" width="400" height="180"></canvas>
    <script>
        var temps = {{temps | safe}};
        var dates = {{dates | safe}};

        var ctx = document.getElementById("myChart");
        var myChart = new Chart(ctx, {
            type: 'line',
            data: {
                labels: dates,
                datasets: [{
                    label: 'Sigfox Temperature',
                    data: temps,
                    backgroundColor: [
                        'rgba(75, 192, 192, 0.2)',
                    ],
                    borderColor: [
                        'rgba(75, 192, 192, 1)',
                    ],
                    borderWidth: 1
                }]
            },
            options: {
                scales: {
                    yAxes: [{
                        ticks: {
                            beginAtZero: true
                        }
                    }]
                }
            }
        });
    </script>
</body>

</html>
Create variables to hold the POSTed data, temps and dates. Instantiate an instance of the ChartJS with a simple line chart. Take a look at their library/documentation if you wish to customise the graph to your liking! Fire up the flask server using your terminal to ensure that it's functioning correctly. Navigate to http://localhost:5000/graph and you should see an empty graph.
And that's it for the server side of things! On to the Arduino next!
#include <Akeru.h>

#define TX 4
#define RX 5

Akeru akeru(RX, TX);

int8_t randNumber;
Lets begin by creating a new Arduino sketch and including the Akeru library. We'll define the serial RX and TX pins required to communicate to the Sigfox module and instantiate a variable we'll use to hold our random number that we can use for testing.
#include <Akeru.h>

#define TX 4
#define RX 5

Akeru akeru(RX, TX);

int8_t randNumber;

void setup()
{
  // initialize serial communication at 9600 bits per second:
  Serial.begin(9600);
  Serial.println("Starting...");

  // Check TD1208 communication
  if (!akeru.begin())
  {
    Serial.println("TD1208 KO");
    while(1);
  }

  // initialize a random seed
  randomSeed(analogRead(0));
  //akeru.echoOn(); // uncomment this line to see AT commands
}
Now we can jump into our setup() function. Initialise the serial connection, check that the TD1208 SIGFOX Module is communicating correctly and create a random seed from a floating analogue pin.
#include <Akeru.h>

#define TX 4
#define RX 5

Akeru akeru(RX, TX);

int8_t randNumber;

void setup()
{
  // initialize serial communication at 9600 bits per second:
  Serial.begin(9600);
  Serial.println("Starting...");

  // Check TD1208 communication
  if (!akeru.begin())
  {
    Serial.println("TD1208 KO");
    while(1);
  }

  // initialize a random seed
  randomSeed(analogRead(0));
  //akeru.echoOn(); // uncomment this line to see AT commands
}

void loop()
{
  randNumber = random(100);

  // send the value over serial incase we need to debug
  Serial.println(randNumber);

  // convert to hexadecimal before sending
  String data = akeru.toHex(randNumber);

  // akeru.sendPayload() returns 0 if message failed.
  if (akeru.sendPayload(data))
  {
    Serial.println("Message sent !");
  }

  // Wait for 10 minutes.
  // Note that delay(600000) will block the Arduino (bug in delay()?)
  for (int second = 0; second < 600; second++)
  {
    delay(1000);
  }
}
We can now start building our loop() function. Start by generating a random number and storing it to the variable we created earlier. You can choose the value that goes inside the random() function or leave it set at 100 (this generate a value between 0 and 100). We then need to convert the value to Hexidecimal (required for Sigfox server side decoding of the data) and then we can transmit the payload!
That's it for Arduino! Compile your sketch and upload it to the Akeru board.
Now we'll take a look at ngrok as a method of exposing your python server publicly so that the Sigfox Backend can POST data to it. Assuming you have ngrok already installed enter the following command into your terminal.
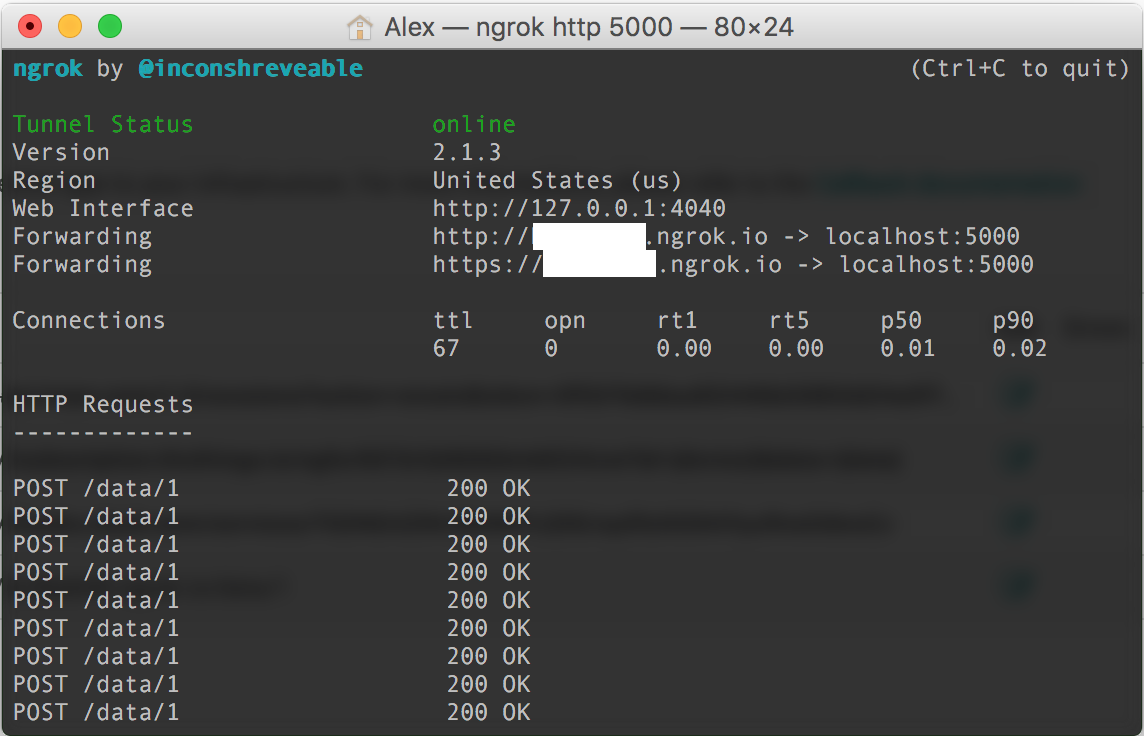
$ ngrok http 5000This will expose your server (on the port 5000) publicly. To double check that this has worked, copy the address that will have appeared in your terminal window under 'forwarding' and navigate to it using your browser; it should look something like this. Make note of this as we'll need it again later!
If that works for you, you're almost there! We just need to setup the Sigfox Backend now.
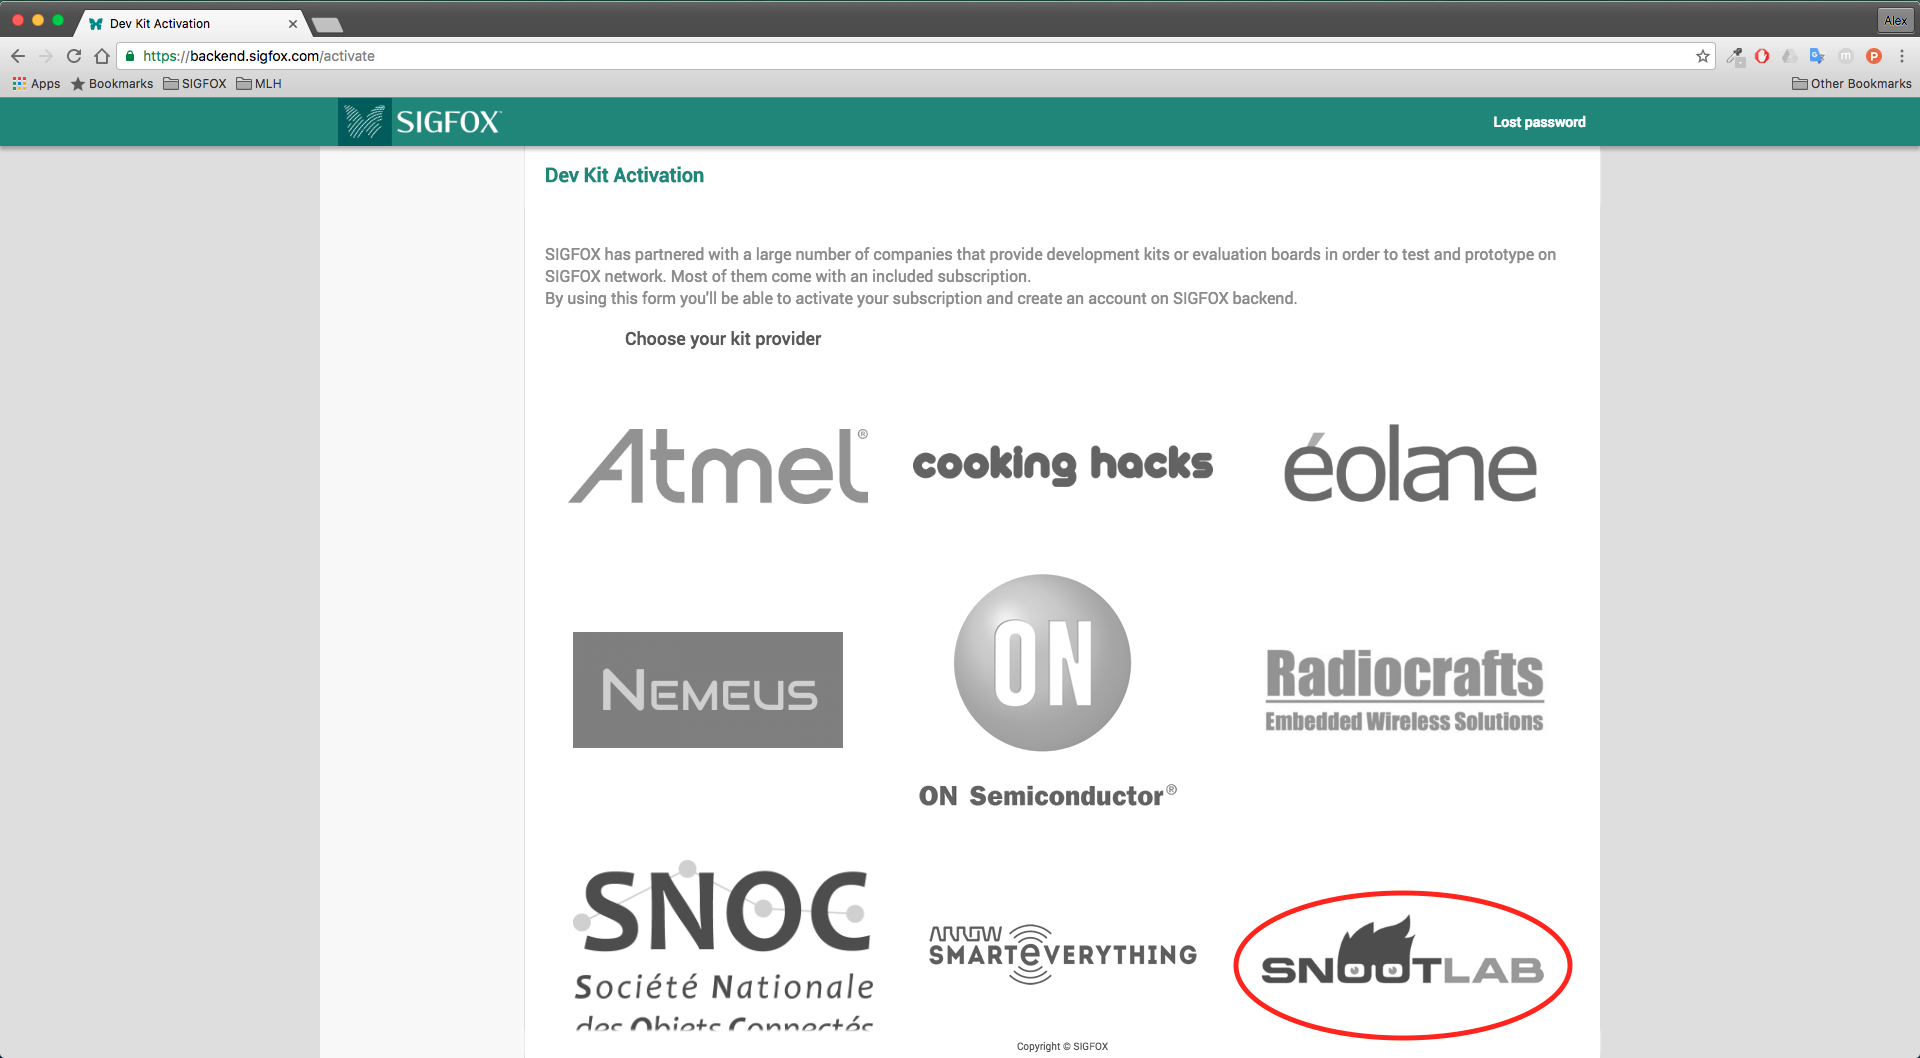
Direct your browser to https://backend.sigfox.com. If you haven't yet activated your Akeru module, you will need to do this now. Navigate to https://backend.sigfox.com/activate and choose Snootlab as your Dev Kit provider. Next pick your country and respective provider. Find your Akeru's Device ID and PAC number as you'll need these for activation (you can find them on the box that the device came in!). You'll then be asked to enter some personal details and create an account. Do this and you should be registered on the Sigfox Backend! Check the email account that you registered with and you should have a link inviting you to activate your account. The device you added should appear in your account!
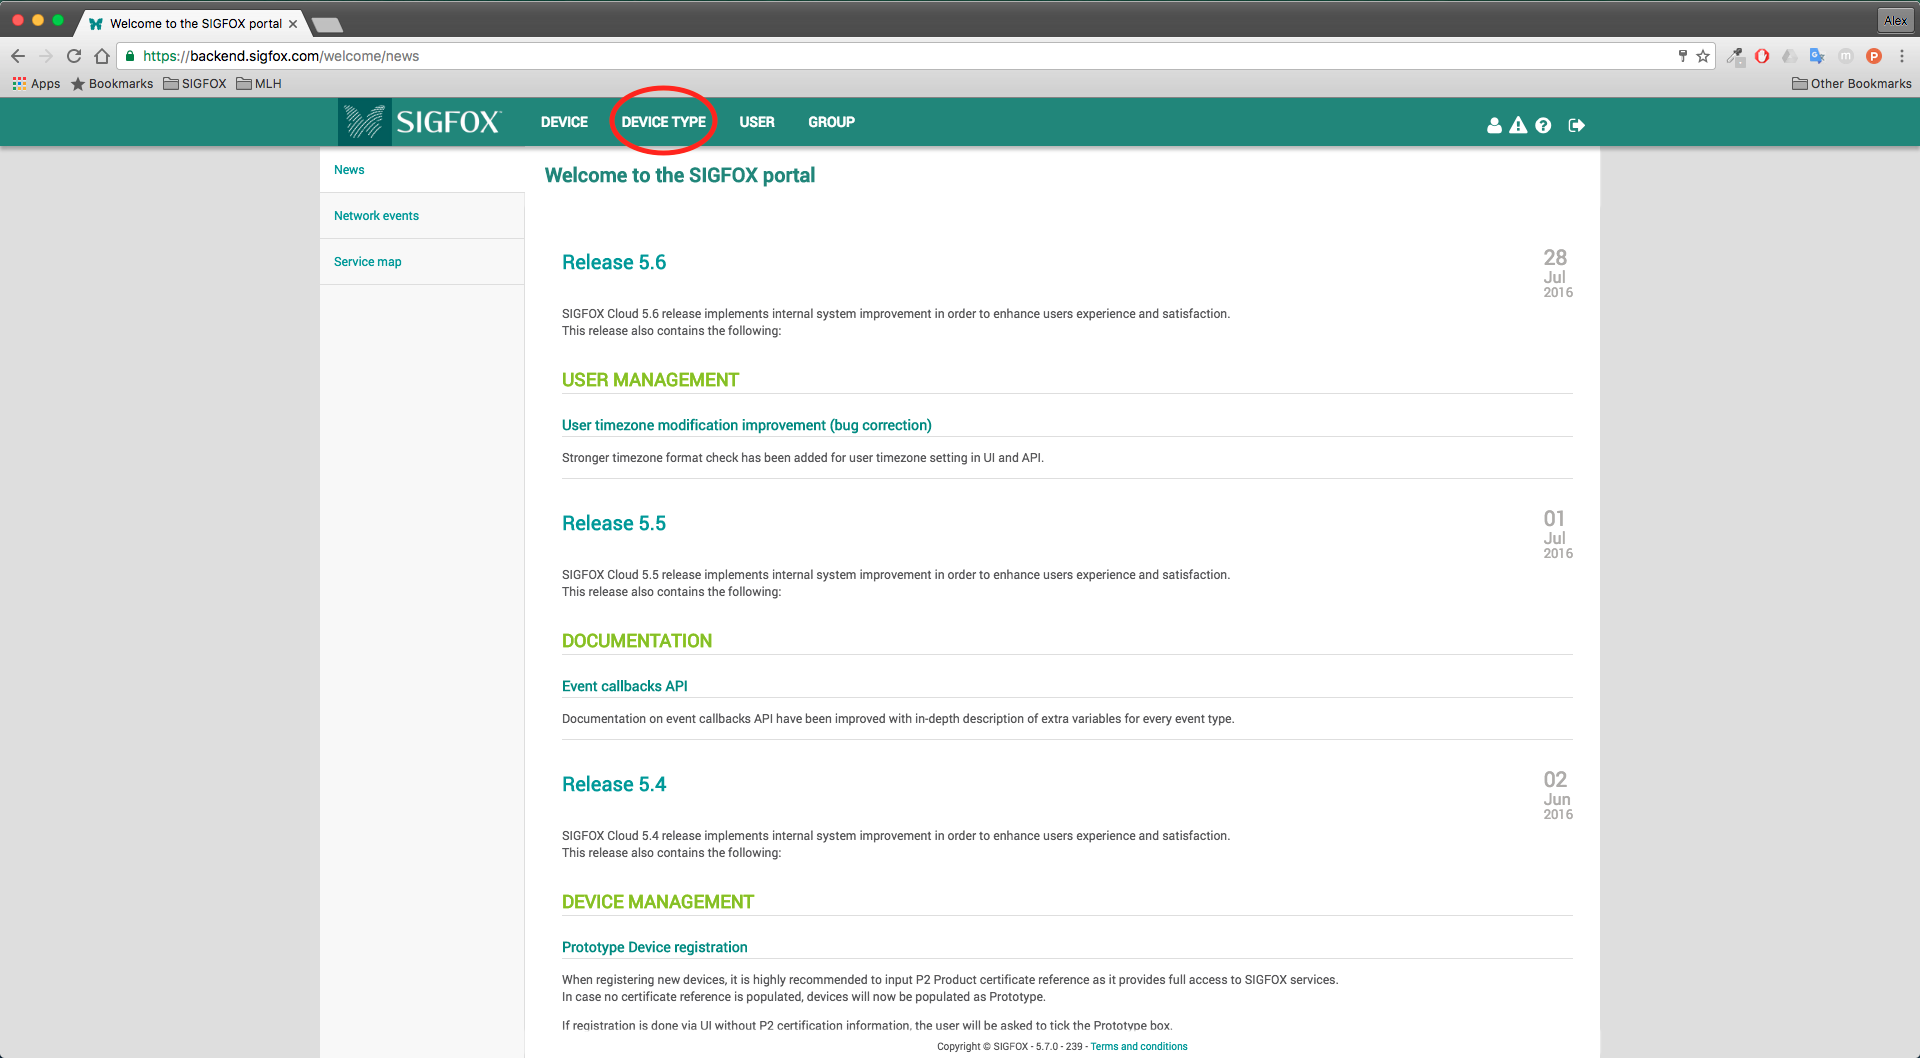
Once you've activated your device and have an account created, log in to the backend.sigfox.com and click on the device tab. Enter the ID of your device and filter for it. You should have a single result with the device type and ID visible.
We need to setup the format that the Sigfox Backend is expecting to receive from the Akeru device. Log into the Backend and click on the 'Device Type' tab. In the information panel, click 'edit' and a list of fields will appear. We want to set this up such that the server knows what to expect from the device.
Go to 'Display Type' and select custom from the dropdown box. This lets us customise how to specify the data field. We'll set ours up to use a 'temp::int:8' which is a signed integer of 8 bits. This allows us to simulate negative temperatures if we wish as we'll be staying within temperature values that we could expect in the real world. Click the '?' if you want to find out what other data types the Sigfox Backend can decode. Click 'OK' to confirm your selection. You will be returned to the 'Device Type' page.
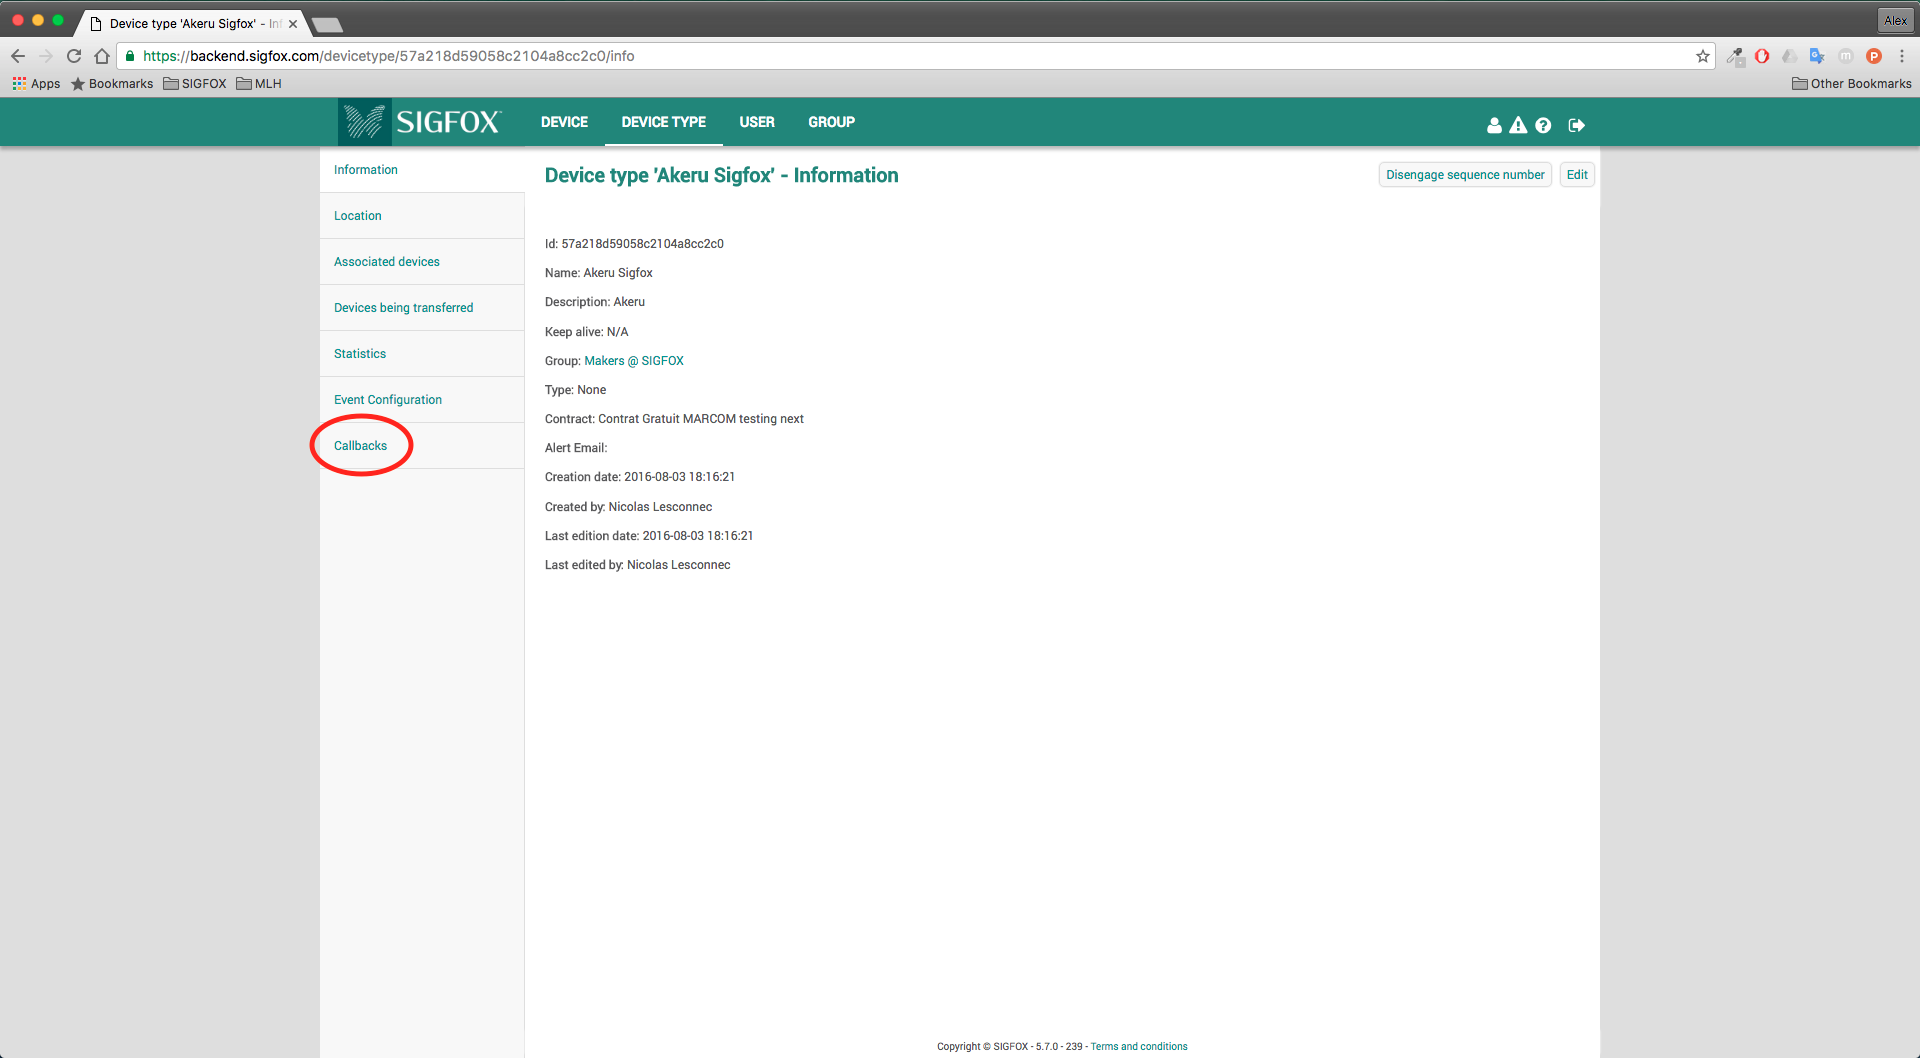
Now head to 'Callback' where we'll create a new callback for our Sigfox device. Click 'New' in the top right corner and you'll be brought into a screen where you can setup a callback for the device. Click 'Custom callback' and you'll be brought to a page where you'll be presented with a selection of different options to choose from. Choose the following options for your callback:
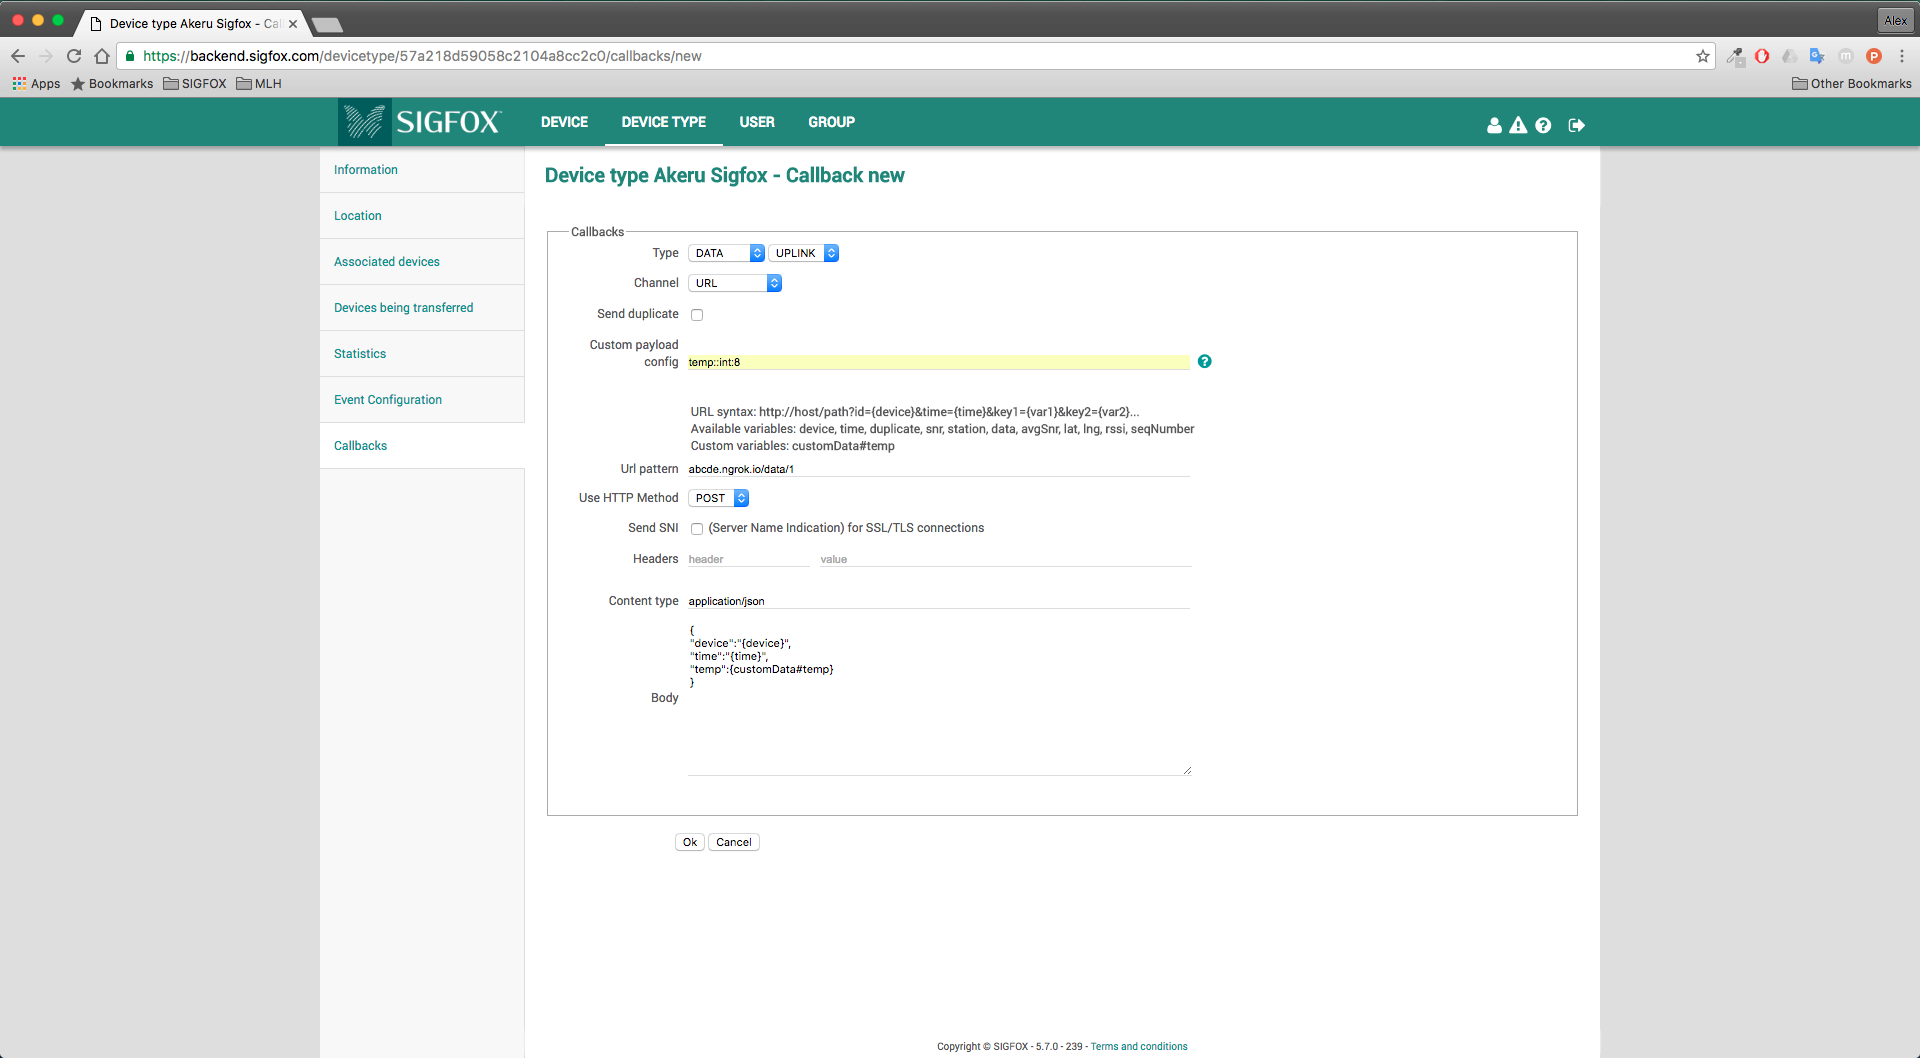
Type - DATA - UPLINK
Channel - URL
Send Duplicate - N/A (Leave this empty)
Custom payload config - temp::int:8
Url pattern - insert your external forwarding address that was generated by ngrok, it should look something like this 'http://abcd1234.ngrok.io'. You should append your data end point to this address so that it becomes 'http://abcd1234.ngrok.io/data/1'. We've added the 1 to end of the URL to specify that this is the first sensor instance that we're transmitting to our Python server.
Use HTTP Method - POST
Headers - N/A (Leave this empty)
Content type - application/json
Body -
{
"device":"{device}",
"time":"{time}",
"temp":{customData#temp}
}
Click 'OK' to confirm these details. That's it! Everything should be set up and ready to go now! Your Akeru device will transmit a new message every 10 minutes over Sigfox and you should see the incoming requests reach your flask server via the debug interface.
Finished this tutorial and want to extend its functionality? Here's a couple of different things you could try!
-
Add Server Authentication using ngrok and/or flask
-
Use AJAX to add new data points to the graph without reloading the webpage
-
Add additional SIGFOX enabled devices to send more data to the server!
If you want to learn more about Sigfox and how to get your devices connected to our network check out some of our other tutorials and documentation!