grapt is a set of tools that allow you to easily visualize data from a
simple, easy to produce format. It was developed out of frustration when
I realized that getting the shape of data requires a lot of extra work.
grapt isn't and will never be a fully featured graphing package.
See gnuplot if you have those needs. It will
however give you just enough insight into your data, and can easily be
invoked at the end of a shell pipeline that produces a bunch of numbers.
You'll need libcairo, make, and a C compiler. Then:
$ makeShould get you an executable named grapt. Once you have that, copy it
into a place that is configured in your $PATH.
$ grapt -h
usage: grapt [options]

    -H, --height        Height of canvas
    -w, --width         Width of canvas
    -o, --output        Output filename (defaults output.png)
    -h, --help          This message
    -t, --tee           Tee input to stdout
-v, --version Version information$ grapt
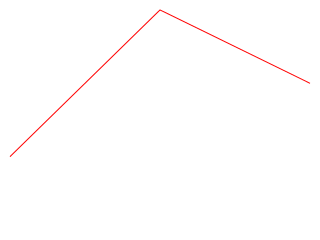
1
3
2
^DThis should produce a PNG file called output.png, which gives you a basic 2 line segment plot.
$ iostat 1 30 | grep 'sda' | awk '{print $2}' | grapt -o iops.png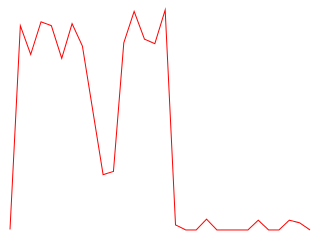
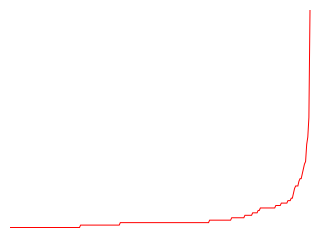
for n in `cat *.[ch] | sed -e 's/[^0-9a-zA-Z_]/ /g'`; do
   echo $n;
done | sort | uniq -c | sort -n | awk '{print $1}' \
| grapt -w 320 -H 240 -o word-dist.png
This gives you the word distribution from the source code, which at the time of this writing was:
If you'd like to fix or contribute something, please fork and submit a pull request, or open an issue. There's lots of room for improvement, and much more work to be done.
Andrew Gwozdziewycz web@apgwoz.com
Copyright 2014, Andrew Gwozdziewycz, web@apgwoz.com
Licensed under the GNU GPLv3. See LICENSE for more details