- Overview
- What's new
- Requirements
- Installation
- Docker setup
- influxDB Schemas
- Pruning database entries
- Setting the utility meter
- Debugging
- Grafana Dashboards
- Thanks
Python data collection utility for the CircuitSetup Expandable 6 Channel ESP32 Energy Meter. Sensor data is sourced using the ESPHome API and stored in an InfluxDB database.
The processing is split between this application which uses the ESPHome API to subscribe to the CircuitSetup 6-channel power monitoring hardware and send it to the InfluxDB database. 22 channels are used for various home circuits and the other two CTs collect information on each of the split phases.
At startup the application creates numerous InfluxDB tasks which run independently on the InfluxDB server at scheduled intervals and convert the sample data to database entries organized by device and location (see the data schema below). This is all organized in a YAML file that has entries similar to these:
  sensors:
    - sensor:
        enable:         True
        sensor_name:    'cs24_volts'
        display_name:   'Line Voltage'
        measurement:    'voltage'
        device:         'line'
        location:       ''
    ...
    - sensor:
        sensor_name:    'cs24_w'
        display_name:   'Total load'
        measurement:    'power'
        device:         'line'
        location:       ''
        integrate:      True
- updated Docker contaainer to use Ubuntu Jammy
- reduced CPU use by batching sensors
- create database pruning predicates in the YAML configuration file: Pruning database entries
- set the initial value of the utility meter: Setting the utility meter
- test that the InfluxDB token permits full access (needed for organization access)
-
Python 3.8 or later (currently using 3.10 from an Ubuntu Jammy Docker container)
-
Python packages used include (but the list in the
setup.pyfile is the definitive list of packages)- asyncio
- aioesphomeapi
- python-dateutil
- influxdb-client
- python-configuration
- pyyaml
-
CircuitSetup Expandable 6 Channel ESP32 Energy Meter hardware (developed using a 24 channel version, my ESPHome code is found here.
-
Docker (a Dockerfile is supplied to allow running in a Docker container, I run this on a Raspberry Pi4 with 8GB memory that also has containers running instances of Portainer, InfluxDB, Grafana, and other useful applications)
- Clone the CS/ESPHome repository and install the Python packages:
    git clone https://github.com/sillygoose/cs_esphome.git
    cd cs_esphome
    pip3 install -e .
-
Rename the
example.secrets.yamlfile tocs_esphome_secrets.yaml, if you plan on using secrets. Thecs_esphome_secrets.yamlfile is tagged in the.gitignorefile and will not be included in your repository but if you wish you can putcs_esphome_secrets.yamlin any parent directory as CS/ESPHome will start in the current directory and look in each parent directory up to your home directory for it (or just the current directory if you are not running in a user profile).Edit
cs_esphome.yamlandcs_esphome_secrets.yamlto match your CircuitSetup hardware, you will need the URL, port, and password for the CircuitSetup ESPHome API. If interfacing to InfluxDB you need the host URL, site name, bucket, and login credentials.There are some other fields to configure for the CircuitSetup senrors you will be importing, etc, these should be easy to adjust to your unique setup.
-
Test that CS/ESPHome connects to your CircuitSetup hardware and the InfluxDB database:
python3 cs_esphome/cs_esphome.pyRun the InfluxDB dashbaord and confirm that the database is being ppoulated with records.
Once you have the working cs_esphome.yaml and cs_esphome_secrets.yaml files you can build a Docker container that runs CS/ESPHome:
    sudo docker build --no-cache -t cs_esphome:your-tag .
    sudo docker image tag cs_esphome:your-tag cs_esphome:latest
    sudo docker-compose up -d
where your-tag is a string of your choosing (the --no-cache option will force Docker to pull the latest version of CS/ESPHome from GitHub). The docker-compose.yaml file assumes the image to be cs_esphome:latest, the second command adds this tag so you can use the docker-compose file to start the new instance and keep the old image as a backup until the new version checks out.
As an example, suppose you download the current CS/ESPHome build of 1.0.0. Then to create and run the Docker container you would use
    sudo docker build --no-cache -t cs_esphome:0.4.9 .
    sudo docker image tag cs_esphome:0.4.9 cs_esphome:latest
    sudo docker-compose up -d
Data is organized in InfluxDB using the following schemas, refer to the Flux queries for examples of pulling data from InfluxDB for dashboard or other use.
Power:
    _measurement    power
    _device         device (W)
    _location       (optional)
    _field          sample (W)
    _time           local time

    _measurement    power
    _location       current power being consumed in the location
    _field          today (W)
    _time           midnight

Energy:
    _measurement    energy
    _device         device
    _location       (optional)
    _field          today (Wh), month (Wh), year (Wh)
    _time           midnight

    _measurement    energy
    _location       location
    _field          today (Wh), month (Wh), year (Wh)
    _time           midnight

    _measurement    energy
    _meter          delta_wh
    _field          today (Wh)
    _time           midnight

    _measurement    energy
    _meter          reading
    _field          today (Wh)
    _time           midnight

Voltage:
    _measurement    voltage
    _field          line (V), l1 (V), l2 (V)
    _time           local time

Frequency:
    _measurement    frequency
    _field          frequency (Hz)
    _time           local time

Power factor:
    _measurement    power_factor
    _field          pf
    _time           local time
Some data points get stale quickly and can be deleted, the pruning option can be used to remove them. Here is an example pruning task that keeps the last 3 days of the power factor sensor:
  influxdb2:
    ...
    pruning:
      - task:
          name: 'pf'
          predicate: '_measurement="power_factor"'
          keep_last: 3
You can have as many of these as desired, the sample YAML file has entries for the voltage, line frequency, and also discards the sample data after it is unlikely to be accessed.
There is a task in InfluxDB that allows you adjust the utility meter to match reality:
cs_esphome._meter.writing.energy.year
Using the InfluxDB web interface, locate this task and edit the code to supply the new meter reading (in kWh) for midnight today and run the task manually.
If running this task at midnight you have no adjustments and can just enter the new reading but later in the day you must factor in the change due to production and consumption. For example, if the current meter reading is 100 and you have consumed 10 kWh of energy today, set the new_reading value to 90, this is the value the meter would have been at midnight.
new_reading = 90
Save the task and click on the smal gear at the right and select 'Run task'.
Create the environment variable CS_ESPHOME_DEBUG and set to 1 or True to enable debug output.
This is also required if you wish to use the debugging options that automatically delete or create the database. This is nice during development but would not want to accidentally cause somthing bad to happen when in production.
A sample Grafana 8.2 dashboard is available, it contains the Flux queries needed to visualize the power and energy flows through the house pulled from the InfluxDB database. The dashboard is organized into rows which provide an overview, utility meter, trend, power, and energy views.
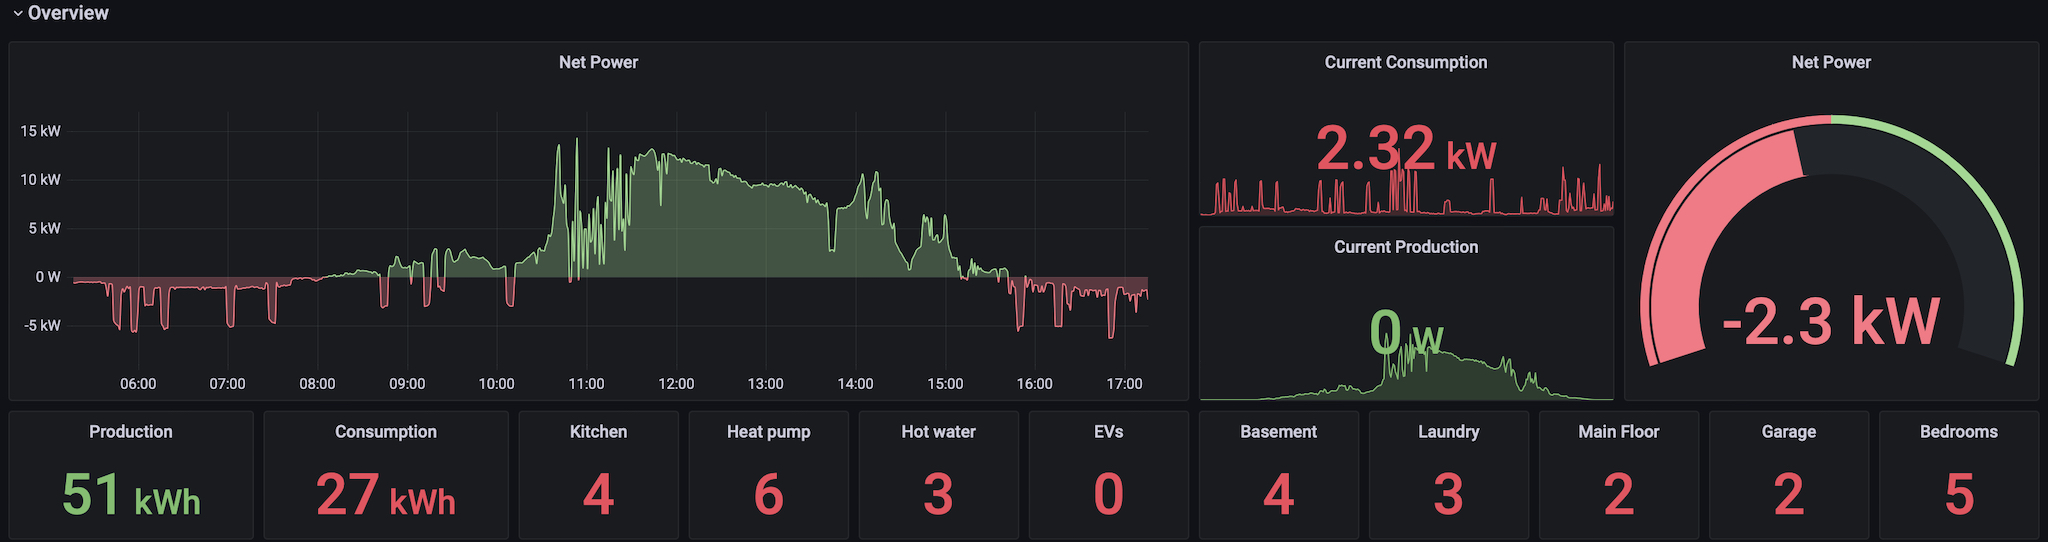
The overview row has the most Graana panels, the top row is the display of net energy, which is the production minus the consumption. Green areas is where the solar panels produce more energy than the house consumes, this is exported to the grid and the utility runs backward. The next two panels are the home current consumption and the net power being produced.
The bottom row are little meters showing the total energy consumed and the breakdown by room or system. The dashbaord has a variable with 'Today', 'Month', and 'Year' options which display the totals for the selected period.
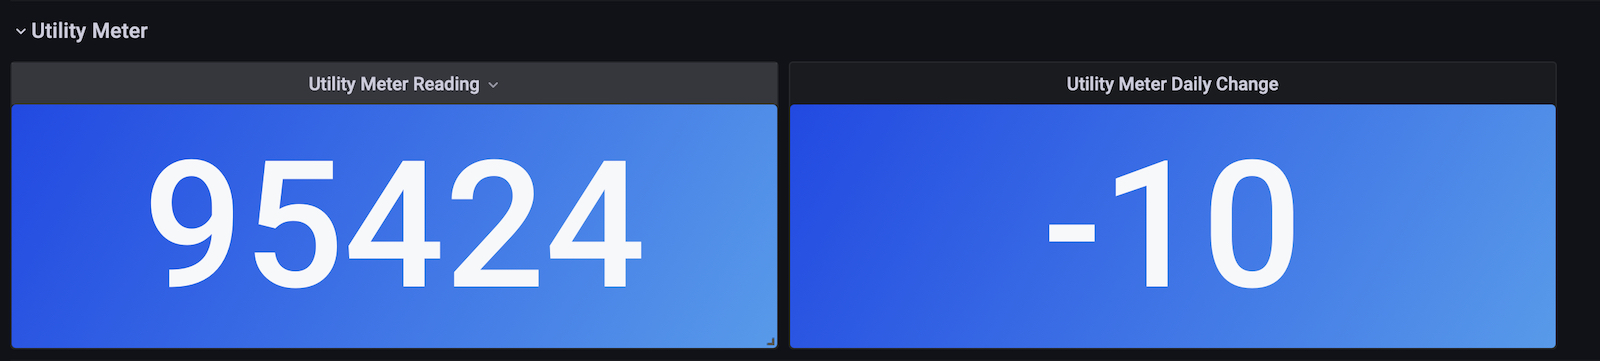
This one just displays the expected value of the home utility meter and the daily change in kWh. I happen to have a dumb meter so I have no way of reading the value, this is my lame attempt to integrate the line and solar and track what the real utility meter is doing.
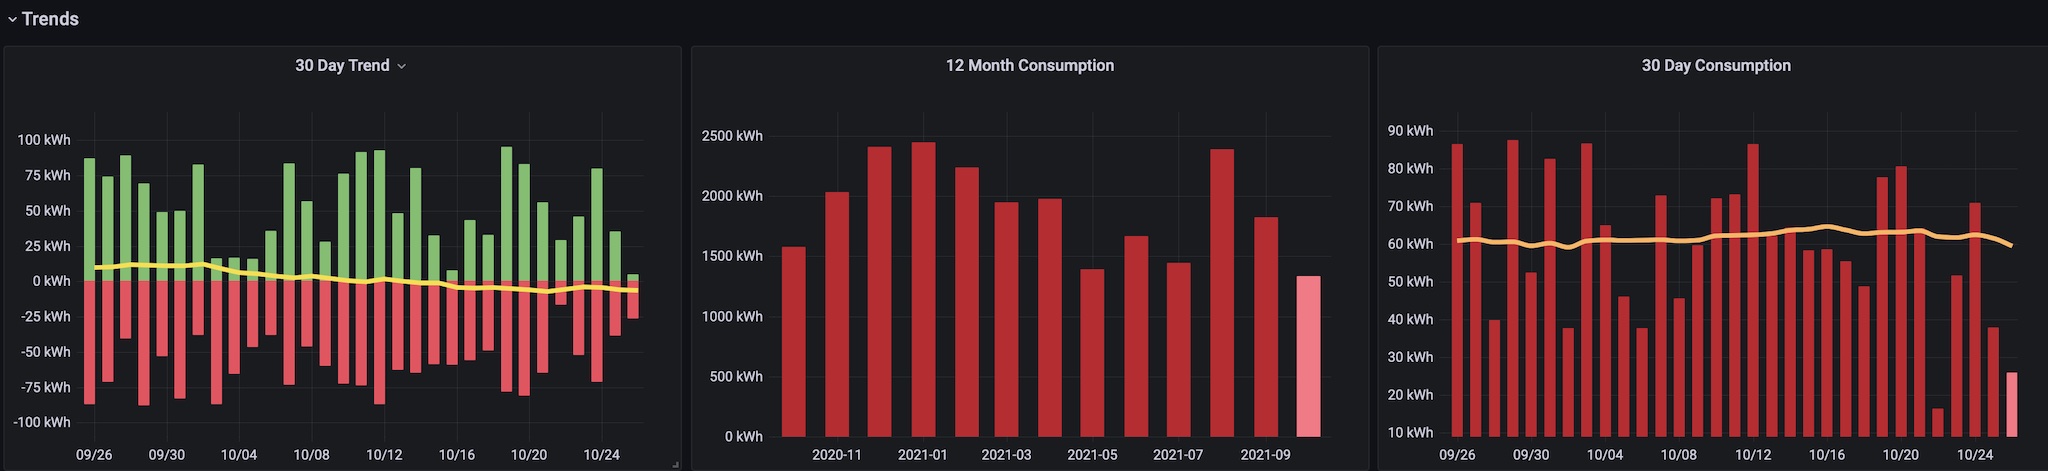
The trend charts are a work in progress since I don't have much past consumption to play with. The leftmost chart has the daily production (green) and consumption (red), the line is the 30-day moving average of the difference. Right now fall is coming into full swing so production is falling and consumption is rising, this is when I become a net imported of energy until the days lengthen and the gets higher in the sky.
The las two are the past 13 months of consumption and the past 3-days with a moving average.
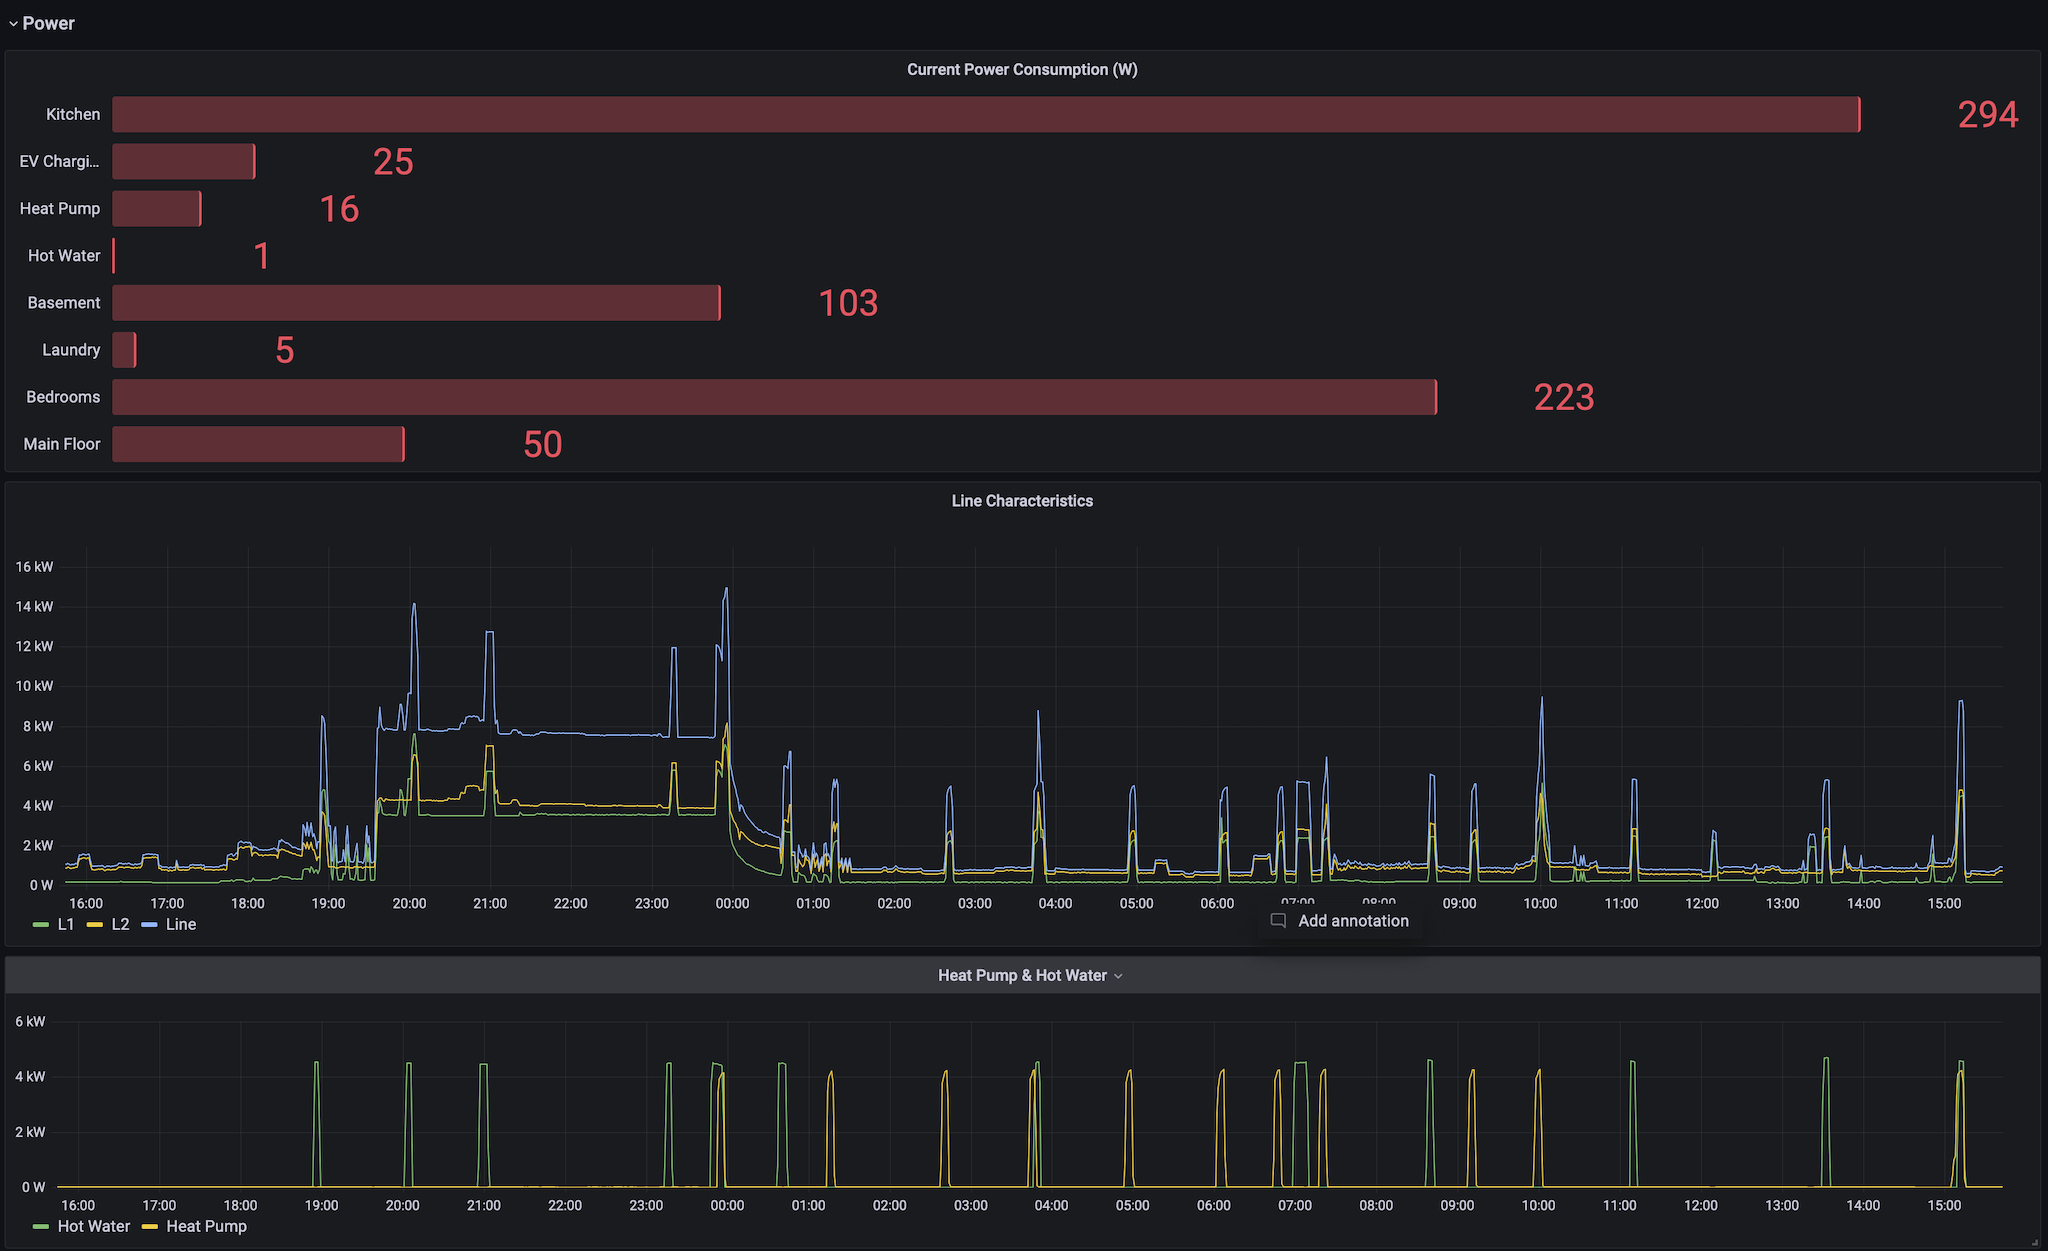
All the power displays, either time-series graphs or home systems or rooms in the home. The top panel shows the current power in the house if you like to see where the loads currently are.
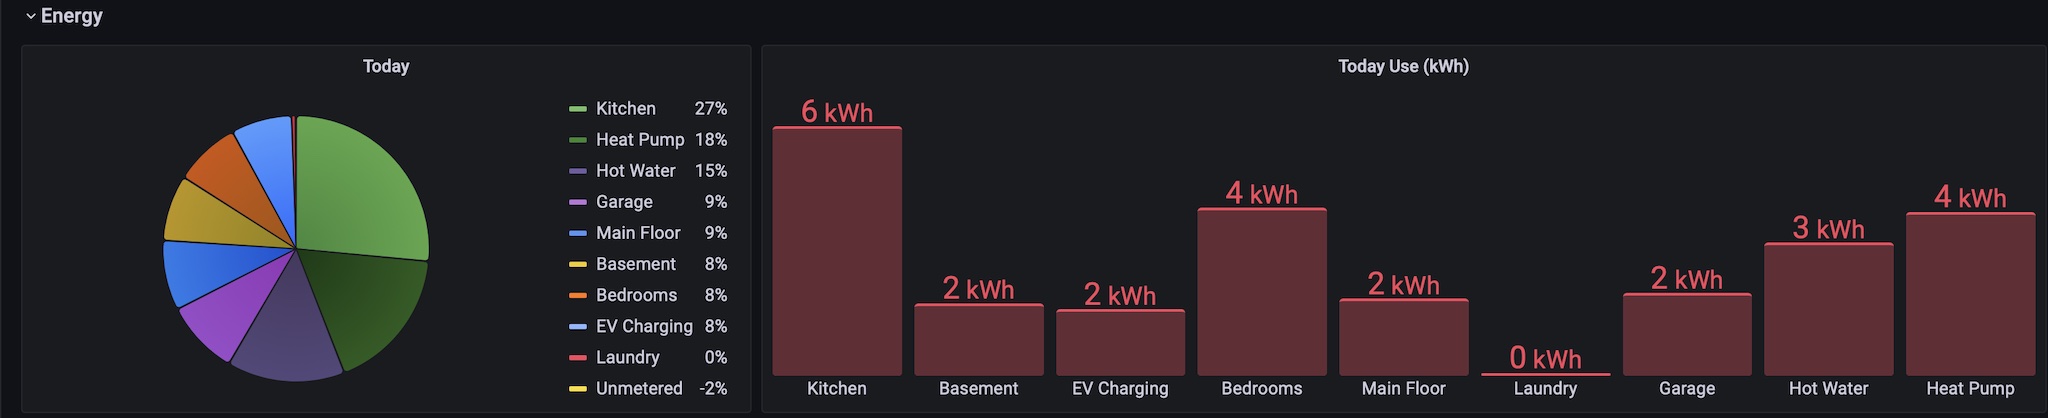
Energy is the power per unit time, most displays are in kWh as that is how your utility bills your usage. First up is a pie chart of the % energy distribution for today, the month to date, or the year to date. Looks pretty with lots of colors.
To the right is the same information but displayed as a bar chart with kWH in place of percentages.
Thanks for the following packages used to build this software: