The script visualize.py should allow you to visualise a spectrogram
of the output of a JACK client using a trained StyleGAN 2 network of your
choosing.
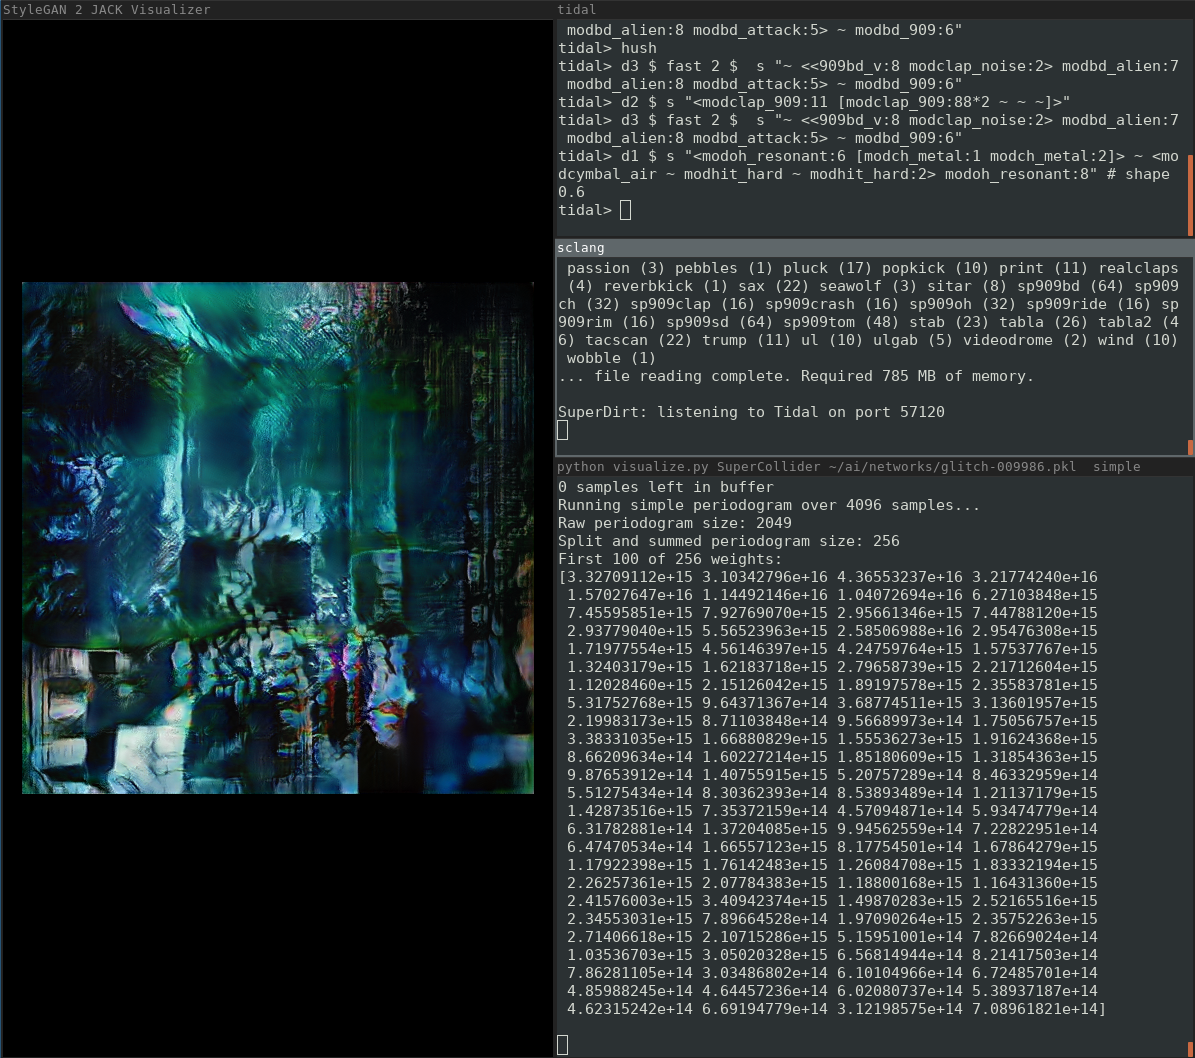 The screenshot above shows the script used to visualise Tidal Cycles audio output
with a network trained on glitch art images.
The screenshot above shows the script used to visualise Tidal Cycles audio output
with a network trained on glitch art images.
First, load the stylegan2 repository submodule.
git submodule initNow you need to install the dependencies for StyleGAN 2. I've successfully set StyleGAN 2 up on Ubuntu 18, so that's the OS I'd recommend.
You need to install the following on your system:
- Nvidia drivers (>= 410.48)
- CUDA 10.0 toolkit
- cuDNN 7.5
- Python 3.6
See the StyleGAN2 readme for more details.
To display the image, you'll also need a system-level package for Tkinter:
sudo apt install python3-tkOnce you have the system-level requirements, you'll need some pip packages:
pip install -r requirements.txtFinally, you'll need tensorflow-gpu.
Version 1.14 is recommended by the StyleGAN 2 developers.
pip install tensorflow-gpu==1.14If you have issues with version 1.14, please try:
pip install tensorflow-gpu==1.15The script is a Click CLI and it's --help output is below.
Usage: visualize.py [OPTIONS] JACK_CLIENT_NAME NETWORK_PKL

Options:
  -p, --periodogram [simple|welch]
                                  Algorithm used to compute spectral density.
                                  [required]

  -s, --seeds-list TEXT           Comma-separated list of input seeds or seed
                                  ranges. e.g. '1, 3, 5, 2-44, 100, 355,
                                  512-533'. These seeds are mapped onto
                                  frequency 'bins' for audio. The first seed
                                  is mapped onto the lowest frequency bin and
                                  the last onto the highest. Generally, the
                                  more seeds you specify, the more detailed
                                  your visualisation. Unless you're working
                                  with exceptionally high-frequency audio,
                                  you're mainly going to see images based on
                                  first few seeds.

  -f, --seeds-file TEXT           A YAML file containing named lists of seeds
                                  and the starting name. See the README for
                                  details of the format.

  --truncation-psi FLOAT          Psi value used for StyleGAN's truncation
                                  trick. Lower values result in images closer
                                  to an 'average' of what the network has
                                  learned; these images tend to be better
                                  quality but less varied. Conversely, a
                                  higher value leads to more varied but
                                  potentially lower quality images.

  --samples-per-image INTEGER     How many samples of audio to use for each
                                  generated image. With the default value of
                                  2048 and sample rate of 48000 you should see
                                  around 23.4 FPS.This value should ideally be
                                  kept to multiples the size audio frames
                                  coming from JACK (usually 1024).You may need
                                  to increase this value to reduce latency.

  --sample-rate INTEGER           JACK sample rate.
  --help                          Show this message and exit.
You'll need to supply two positional arguments: JACK_CLIENT_NAME and NETWORK_PKL.
In all examples below, the jack client name SuperCollider is used.
This works if Supercollider's server is running and outputting audio to JACK.
If you're outputting to JACK with something else you can check the client name
using one of the control applications listed
here.
The stylegan2-cat-config-a.pkl network pkl is used in most examples.
It should automatically download from Google Drive.
While fast, this network is a bit boring.
If you want something more sophisticated,
try one of the config-e or config-f networks in the
StyleGAN2 Google Drive.
You can of course train your own.
Along with the two positional arguments,
you'll need to specify a periodogram algorithm using the --periodogram option.
The simplest approach is to pass a list of seeds and seed ranges
using the --seeds-list option.
This command will output an image from the stylegan2-cat-config-a.pkl
network for every 4096 samples from Supercollider.
python visualize.py SuperCollider gdrive:networks/stylegan2-cat-config-a.pkl \
    --periodogram simple --samples-per-image 4096 \
    --seeds-list '0-64, 112, 224, 512-532'
Assuming the JACK client is ouputting audio, you'll get console output like this initially:
250880 samples left in buffer
Running simple periodogram over 4096 samples...
Raw periodogram size: 2049
Split and summed periodogram size: 88
Weights:
[1.62874881e+17 1.52382244e+16 4.39852791e+15 2.49385394e+15
 1.77420505e+15 1.37694515e+15 1.16670374e+15 9.80901338e+14
 6.80234098e+14 5.26510187e+14 4.43498261e+14 3.07176947e+14
 2.89884427e+14 3.50866331e+14 1.71887415e+14 2.99365047e+14
 2.23899402e+14 2.29891724e+14 2.82177737e+14 1.47459634e+14
 1.85780398e+14 7.83581343e+13 8.12000129e+13 8.61307248e+13
 9.48126226e+13 8.36000480e+13 9.31130208e+13 1.13291195e+14
 1.06086351e+14 1.18170884e+14 9.80504995e+13 7.40222281e+13
 4.89594063e+13 3.90779427e+13 3.13035643e+13 5.65370389e+13
 4.27247184e+13 4.52579210e+13 4.44271680e+13 4.39362791e+13
 3.63108501e+13 6.03700898e+13 5.03071064e+13 5.21651650e+13
 7.26366105e+13 6.49155562e+13 7.30669698e+13 5.21192821e+13
 6.80588799e+13 8.96171484e+13 7.52140442e+13 8.65527008e+13
 9.74496553e+13 7.60527803e+13 5.96430855e+13 3.90482217e+13
 2.22638878e+13 1.97252876e+13 3.61592703e+13 5.44136064e+13
 7.76638232e+13 9.87939283e+13 8.98473443e+13 7.73551101e+13
 7.13356902e+13 4.16756000e+13 3.12903151e+13 1.43157947e+13
 1.42667931e+13 2.36814498e+13 2.19928353e+13 3.20155659e+13
 2.43769106e+13 1.89355683e+13 2.75517133e+13 4.21659923e+13
 3.97438765e+13 5.98897624e+13 5.23206476e+13 4.08010149e+13
 4.74632607e+13 2.51305414e+13 2.34539285e+13 1.25338212e+13
 1.45019479e+13 3.05652696e+13 3.87013586e+13 4.84158710e+13]
(If the JACK client is silent, all the weights will be 0.)
The number of samples in the buffer should decrease over time.
If this doesn't happen, you need to increase --samples-per-image.
Once there are consistently a small number of samples in the buffer (ideally 0), you should get reasonably low-latency visualisation of your audio output.
If you want to switch between multiple lists of seeds, you can pass
the location of a YAML file using the --seeds-file-option.
This example illustrates the format:
starting_name: "nice cats"
seeds:
  "nice cats": [144, 333, 6000-6080, 9090]
  "scary cats": [
    3, 11, 21, 41, 45, 49, 94, 101, 110, 112, 146, 271, 277, 279, 284, 364,
    368, 369, 373, 386, 515, 539, 588, 625, 638, 640, 659, 666, 682, 755,
    1024
  ]
If you save the above file somewhere on your system you should be able to run a command like this:
python visualize.py SuperCollider gdrive:networks/stylegan2-cat-config-a.pkl \
    --periodogram simple --samples-per-image 4096 \
    --seeds-file ~/ai/jack-visualizer-seeds/cat-test.yaml
Once the StyleGAN2 Jack Visualizer window launches, you should be able to switch to the second seed list. To do this, hover your cursor over the StyleGAN2 Jack Visualizer window, type scary cats and press ENTER. You can then switch back by typing nice cats followed by ENTER as before. If you make a mistake, you can erase the last charactar with the BACKSPACE key.
The text you type is deliberately not displayed in the GUI for aesthetic reasons.
Just specify a path to a local .pkl file rather than using the gdrive prefix.
This example won't work unless you have the network, but should serve to illustrate:
python visualize.py SuperCollider ~/ai/networks/glitch-009084.pkl \
    --samples-per-image 5120 -p simple \
    --seeds '1137,1028,1139,1285,1776,2051,936,915,848,838,812,791,
             1,2,3,4,5,6,7,8,9,10,11,12,13,15,14,16,17,18,19,20,21,
22,23,24,25,26,27,28,29,30,31,32,33,34'The Welch periodogram uses overlapping frequency bins, which may look smoother. This is currently more buggy than the simple periodogram and you may need to tweak the number of seeds to get it to work.
This example will output images based on 32 overlapping frequency bins for some custom seed numbers.
python visualize.py SuperCollider gdrive:networks/stylegan2-cat-config-a.pkl \
    --periodogram welch --samples-per-image 4096 \
    --seeds '0,1,1,2,3,5,8,13,21,34,55,89,144,233,377,610,
             987,1597,2584,4181,6765,10946,17711,28657,46368,75025,
             121393,196418,17811,514229,832040,1346269'